Korean J Anesthesiol Search

CLOSE


Korean J Anesthesiol > Epub ahead of print
Yuan, Bong, and Chao: Intraoperative pediatric electroencephalography monitoring - an updated review

Abstract

Intraoperative electroencephalography (EEG) monitoring under pediatric anesthesia has begun to attract increasing interest, driven by the availability of pediatric-specific EEG monitors and the realization that traditional dosing methods based on patient movement or changes in hemodynamic response often lead to imprecise dosing, especially in younger infants who may experience adverse events (e.g., hypotension) due to excess anesthesia. EEG directly measures the effects of anesthetics on the brain, which is the target end-organ responsible for inducing loss of consciousness. Over the past ten years, research on anesthesia and computational neuroscience has improved our understanding of intraoperative pediatric EEG monitoring and expanded the utility of EEG in clinical practice. We now have better insights into neurodevelopmental changes in the developing pediatric brain, functional connectivity, the use of non-proprietary EEG parameters to guide anesthetic dosing, epileptiform EEG changes during induction, EEG changes from spinal/regional anesthesia, EEG discontinuity, and the use of EEG to improve clinical outcomes. This review article summarizes the recent literature on EEG monitoring in perioperative pediatric anesthesia, highlighting several of the topics mentioned above.

Introduction

Traditionally, pediatric anesthetics are administered according to patient movement (minimal alveolar concentration [MAC]) or changes in hemodynamic response (heart rate and arterial blood pressure). Inherent imprecisions in dosing occur when relying on population pharmacokinetics, spinal cord reflexes (MAC), or subcortical activity (hemodynamic responses). Therefore, the administration and dosing of anesthetics should be based on direct measurements of pharmacologic effects on the brain, the target end-organ responsible for inducing loss of consciousness.
Over the past 30 years, interest in using electroencephalography (EEG) to directly monitor the brain’s response to anesthetics has increased. EEG assesses neural oscillations (rhythms) within specific frequency bands that reflect local and large-scale network interactions [1,2]. EEG correlates of anesthetic effects can be found during critical periods of neurodevelopment in young children. As several national anesthesia societies have highlighted the importance of EEG-guided anesthesia, with recommendations such as “EEG monitoring should be considered as part of the vital organ monitors to guide anesthetic management” [3] and “anesthetists should be familiar with the principles, interpretation and limitations of EEG monitoring” [4].
Precise anesthetic dosing is especially important in pediatric patients and younger infants as they are at increased risk of adverse events (e.g., hypotension) from excessive anesthesia [5]. Research in anesthesia and computational neuroscience over the past ten years has improved intraoperative EEG monitoring in children and expanded the utility of EEG monitoring in clinical practice. We now have better insights into neurodevelopmental changes in the developing pediatric brain, functional connectivity, anesthetic dosing guided by non-proprietary EEG parameters, epileptiform EEG changes during induction, EEG changes from spinal anesthesia, EEG discontinuity, and the use of EEG to improve clinical outcomes. This review article summarizes recent literature on EEG monitoring in perioperative pediatric anesthesia, highlighting several of the topics mentioned above.

Search strategy

For this literature review, articles from NCBI PubMed published between 2013 and 2023 were retrieved. The following search terms returned 213 articles: “((pediatric anesthesia EEG) OR (pediatric anesthesia electroencephalography)) OR (paediatric anaesthesia EEG).” The following articles were excluded: those not focusing on the intraoperative period; those focusing on epilepsy, autism, attention-deficit hyperactivity disorder, intensive care unit settings, and extracorporeal membrane oxygenation; and those from conference proceedings, editorials, reviews, case reports, protocols, and animal studies. Non-English language articles were also excluded. A total of 67 articles were selected for the final review.

EEG basics and changes in the anesthetized brain

EEG measures the summation of excitatory and inhibitory postsynaptic electrical discharges generated from pyramidal neuronal activity in the neocortex [6] and consists of waveforms that can be characterized by their amplitude (i.e., the magnitude of waveforms measured in microvolts [μV]) and frequency (i.e., the number of cycles per second [Hz]) [7]. Typical EEG amplitudes range from 10 to 100 μVs, which is 100 times lower than those of an electrocardiography. EEG activity is often described in terms of EEG power, which is the square of the EEG amplitude (μV2). EEG frequencies are grouped into different bands, conventionally called the slow (< 1 Hz), delta (1–4 Hz), theta (5–8 Hz), alpha (9–12 Hz), beta (13–25 Hz), and gamma (26–80 Hz) bands [2].
The relationship between EEG activity in different regions of the neocortex can be described using coherence and phase shift. Coherence measures the degree of correlation between two EEG signals in a specific frequency band; a coherence value of 1 represents two perfectly correlated synchronous signals, whereas a coherence value of 0 represents no correlation [8]. Typically, coherence is used to measure the synchronization between the left and right sides of the brain, and increased coherence is observed with deeper sedation or anesthesia. Phase shift or phase synchrony can be used to determine the temporal relationship (connectivity) between EEG signals in different regions of the brain [9].
Anesthetics alter the electrical activity of the brain and generate distinct age- and dose-dependent EEG patterns, followed by topographic distributions, suggesting that multiple neural circuits contribute to inducing loss of consciousness [2,10]. Gamma aminobutyric acid (GABAergic) anesthetics (e.g., sevoflurane and propofol) increase EEG amplitude while decreasing EEG frequency. At surgical anesthesia levels, most EEG activity exists in the slow/delta and alpha bands. Alpha activity stems from the interaction between the cortical and thalamic pacemakers (corticothalamic network) [6], which can decrease with increased anesthetic doses and may not be present in younger infants, as discussed in the next section [8].

Intraoperative EEG changes with age

Infants undergo rapid changes in brain myelination and maturation, resulting in changes in EEG amplitude and frequency [8]. EEG in newborn children is dominated by slow oscillations that diminish in amplitude with age [6]. Markus et al. [11] measured frontal EEG in infants aged < 12 months under sevoflurane anesthesia and found that newborns had a much higher relative delta power (80%) than older infants aged 10–12 months (48%). Compared to older infants (4–6 months), newborns had lower relative alpha (4.6% vs. 14.4%) and beta (3.2% vs. 10.9%) power. De Heer et al. [12] found that in infants aged < 6 months under sevoflurane anesthesia, alpha coherence and beta coherence were absent, whereas theta and delta oscillations were present. In infants younger than 3 years under sevoflurane anesthesia, Cornelissen et al. [8] used multichannel EEG recordings to show that (1) slow/delta (0.1–4 Hz) oscillations were present in all ages, (2) theta (4–8 Hz) and alpha (8–12 Hz) oscillations emerged by 4 months, (3) alpha oscillations increased in power from 4 to 10 months, (4) frontal alpha-oscillation predominance emerged at 6 months, (5) frontal slow oscillations were coherent from birth until 6 months, and (6) frontal alpha oscillations became coherent at around 10 months, persisting into older ages. These EEG changes reflect developmental milestones in the maturation of the thalamocortical circuity and “highlight the importance of developing age-dependent strategies to monitor the brain states of children receiving general anesthesia” [8].
In children under sevoflurane anesthesia, Akeju et al. [13] assessed changes in frontal EEG power spectra and coherence as a function of age and found that EEG power significantly increased from infancy through approximately 6 years, subsequently declining to a plateau at approximately 21 years. Alpha (8–13 Hz) coherence, an EEG feature associated with sevoflurane-induced unconsciousness in adults, was absent in patients aged < 1 years. In a study by the same group, Lee et al. [14] showed that under propofol anesthesia, the total EEG power (0.1–40 Hz) peaked at approximately 8 years and declined with increasing age. In children aged > 1 years, propofol-induced EEG was qualitatively similar regardless of age, featuring slow and coherent alpha oscillations. In infants aged < 1 years, frontal alpha oscillations were not coherent.

Intraoperative EEG changes with anesthetic dose

Changes in EEG due to variances in anesthetic levels have been evaluated in children. Rigouzzo et al. [15] described EEG properties in children aged 5–18 years over a wide range of anesthetic concentrations: (1) propofol using target-controlled infusion targets of 2–6 μg/ml in 1 μg/ml increments or (2) expired sevoflurane (eSevo) 1%–5% in 1% increments. Propofol induced dose-dependent EEG suppression of higher-frequency oscillations, whereas eSevo > 3% was associated with an increase in higher-frequency oscillations. Cornelissen et al. [16] used raw EEG data to report the relationship between sevoflurane concentrations and clinical signs of emergence in children aged 0–3 years. Frontal slow-delta (0.1–4 Hz) oscillations were present from 2% eSevo throughout emergence in all children. In children aged > 3 months, frontal alpha EEG oscillations were present at 2% eSevo and disappeared at 0.5%. The time from the disappearance of alpha oscillations and onset of body movement was 2.2 min (95% CI [0.6, 3.7]). In 99% of the patients, body movement occurred within 5 min of the loss of alpha oscillations. In children aged < 3 months with decreasing eSevo, frontal alpha power decreased with a simultaneous but transient increase in beta oscillations (13–30 Hz).

EEG functional connectivity

During changes in consciousness under general anesthesia, alterations in local EEG oscillations are accompanied by organized changes in the connectivity patterns between various brain regions, known as functional connectivity. Functional connectivity has been explored as an index of anesthetic state transitions and has been shown to discriminate between anesthetic-mediated changes in states of consciousness. This is important in children aged < 10 months as the power-frequency relationship-based EEG cannot always reliably distinguish between wakefulness and unconsciousness [17].
Puglia et al. [18] recorded a 16-channel EEG in children aged 8–16 years and observed changes in functional connectivity associated with anesthetic state transitions across multiple regions and frequency bands. The baseline period, prior to any sedation or anesthesia, was compared to the anesthetic maintenance period, approximately halfway between surgical incision and cessation of anesthesia, with an age-adjusted MAC value > 0.7 and a change of < 0.1%. Functional connectivity was estimated using a weighted phase lag index, which is a measure of the phase synchronization of two signals. If two EEG signals are completely synchronized (phase-locked), then the weighted phase-lag index is 1. Conversely, if the phase relationship between two EEG signals is random, the weighted phase-lag index would be lower. If there is no phase difference, the value is zero. From baseline to maintenance, an increase in connectivity between prefrontal–frontal regions was noted for the alpha frequency band: median (Q1, Q3) 0.07 (0.05, 0.10) vs. 0.47 (0.29, 0.61), P < 0.001 and theta frequency band: 0.04 (0.03, 0.05) vs. 0.40 (0.25, 0.49), P < 0.001 along with a decrease in parietal–occipital alpha connectivity: 0.17 (0.15, 0.24) vs. 0.09 (0.06, 0.13), P < 0.001. The authors concluded that general anesthesia in children correlates with changes in functional connectivity patterns. Unlike in adults, where functional connectivity can undergo structured transitions during the stable maintenance phase, even after controlling for surgical stimuli [19], functional connectivity in children did not exhibit the same transitions during the maintenance phase and was consistently dominated by theta and alpha prefrontal–frontal and alpha frontal–parietal connectivity.
In an exploration of functional connectivity and network topology in the developing brain, Desowska et al. [17] used a weighted phase lag index and found that sevoflurane-based anesthesia modulated functional connectivity in children aged 0–3 years. Functional connectivity was reduced in delta oscillations between anesthesia and wakefulness. Preserved alpha connectivity, notably in the frontal and frontoparietal connections, emerged at around 10 months. In the youngest infants (0–6 months) who lack robust alpha oscillations and exhibit little difference in power spectra between different anesthetic states, functional connectivity analysis could be used to identify differences between wakefulness and unconsciousness. In another study by the same group that focused on young infants aged 0–4 months, Pappas et al. [20] showed that slow-wave connectivity decreased under sevoflurane administration, particularly between the frontal and parietal areas.
Phase-amplitude coupling (PAC), in which the phase of the slower wave modulates the amplitude of the higher-frequency wave, has been studied as another method for differentiating the depth of consciousness under anesthesia [21,21]. Thalamocortical PAC is believed to be a process by which general anesthesia prevents information transmission across the brain by disrupting neuronal dynamics through coupled rhythmic oscillations [23]. Liang et al. [22] analyzed PAC as a function of age in children aged 0.6–18 years and in adults undergoing propofol induction and sevoflurane maintenance. In infants aged < 1 years, the PAC pattern between slow-alpha and delta-alpha oscillations was absent. In children aged > 1 years, the PAC modulation strength between delta-alpha oscillations increased with age. Zakaria et al. [21] reported similar delta-alpha PAC characteristics in children aged 10 months to 3 years under sevoflurane anesthesia. PAC was also absent in children aged < 1 years, presumably because of a lack of strong alpha oscillations.

Non-proprietary EEG parameters

Limitations of proprietary processed EEG indices in children

Commercial EEG monitors approved for intraoperative monitoring in children include the bispectral index (BIS) (Medtronic), SedLine (Masimo), Narcotrend (MonitorTechnik), and M-Entropy (GE Healthcare). These monitors were developed for adult patients using adult EEG data [24] and were adapted for children by reducing the size of the sensors. The processed EEG (pEEG) value is derived from the manufacturer’s proprietary algorithm, which is purported to summarize the depth of anesthesia. However, exactly how these pEEG numbers are computed for children or whether the algorithms are modified to account for age-related differences and changes with neurodevelopment [25], is not clear.
The rationale for creating a numeric proprietary index to indicate hypnotic depth is to simplify the technology and make it more accessible for anesthesiologists. However, this approach may lead to an overreliance on the pEEG index without a clear understanding of the EEG or the limitations of this index. Given age-related differences in intraoperative EEG, the fact that proprietary pEEG indices such as the BIS and patient state index (PSI) have been shown to be unreliable in young children [26,27], particularly in neonates and infants aged < 6 months [28,29], is not surprising. Although several studies have shown that BIS and PSI values generally correlate with increasing propofol and sevoflurane doses or sedation depth in children aged > 1 years [30,31], this correlation is not always reliable.
In children aged 6 months to 12 years, the BIS decreases as expected in response to increasing sevoflurane from 1% to 3%; however, the BIS paradoxically increases when sevoflurane is increased from 3% to 5%, in association with the appearance of fast oscillations and epileptoid signs on EEG [15]. Children also have relatively greater power in the high-frequency bands; thus, children aged < 2 years may display higher pEEG than older children during similar sedative states [32,33], which can lead to inaccurate or misleading pEEG data in children. Moreover, as in adults, pEEG indices do not reliably account for the effects of non-GABAergic agents, muscle tone, pain response, artifacts, and noise, which can lead to falsely high or low readings, further limiting their utility in assessing overall anesthetic depth.
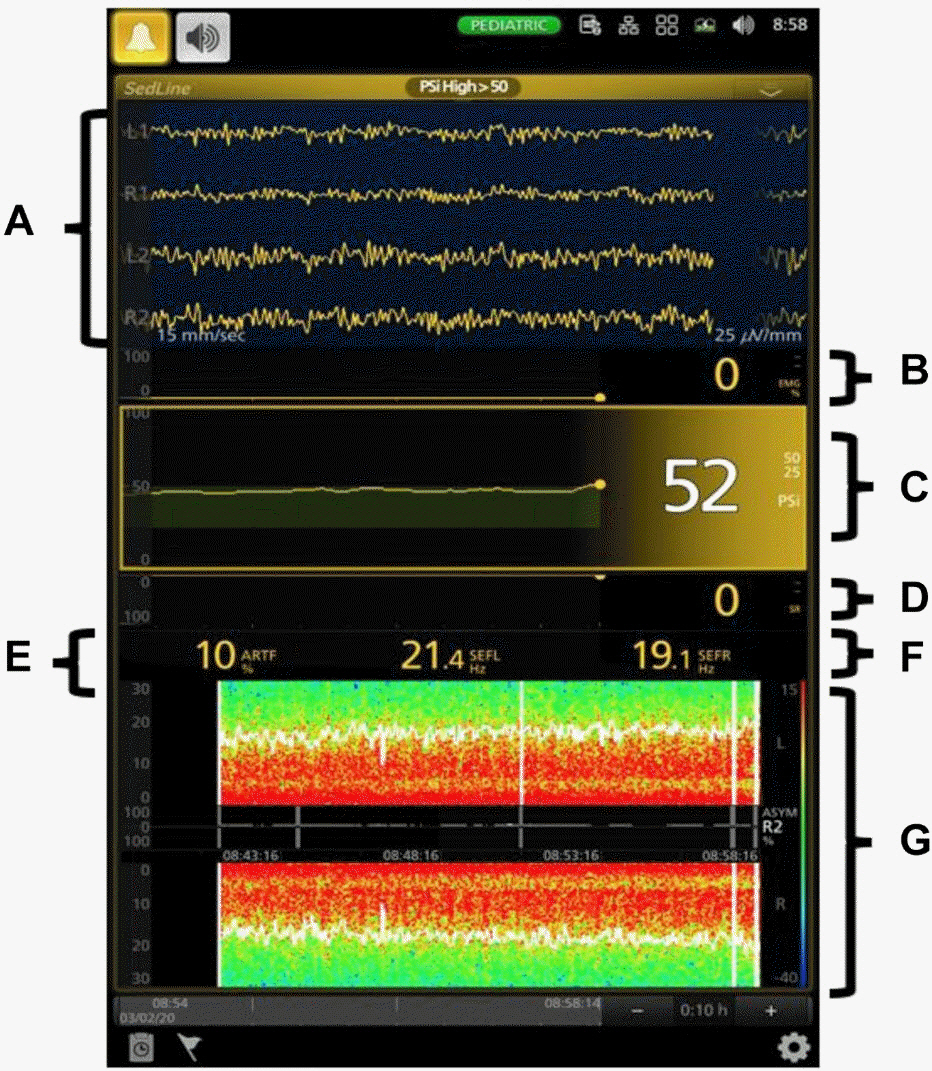
Understanding the raw EEG waveform and non-proprietary EEG parameters can prevent an overreliance on pEEG numbers and prevent the misinterpretation of inaccurate or misleading pEEG values [25]. Most commercial EEG monitors display a pEEG index along with raw EEG waveforms and non-proprietary processed parameters, such as the density spectral array (DSA), spectral edge frequency (SEF95), and burst suppression ratio (BSR). These EEG parameters (Fig. 1), which will be discussed in the following sections, can be collectively used to guide anesthesia management.

Density spectral array or spectrogram

A DSA or spectrogram is a simplified quantitative method for analyzing EEG signals that provides information on the strength of different frequencies of synchronized neural activity over time [2]. Through Fourier transformation, at each point in time (x-axis), the power or energy at different frequencies (y-axis) is computed in decibels and represented by color, with red indicating high power and blue indicating low power. Anesthetic drugs with different mechanisms of action have varying effects on the EEG waveform and have different “signatures” on the DSA. For example, propofol and inhaled anesthetics are known to act in part through a GABAergic mechanism and thus have similar spectrogram signatures. Generally, the main markers of unresponsiveness under sevoflurane or propofol are high power in the alpha band and/or a slow-delta band (0.1–4 Hz) [15,34]. At low doses, ketamine, an NMDA antagonist, acts primarily on inhibitory interneurons and causes downstream excitation, thereby inducing high-frequency gamma oscillations that are readily visible on DSA [35].

Spectral edge frequency (SEF95)

The SEF95 is the frequency below which 95% of the EEG power is located. In general, when using GABAergic agents such as propofol or sevoflurane, a lower SEF95 represents a deeper state of hypnosis [36]. The SEF95 is often used together with the DSA to assess hypnotic depth. Whereas the DSA provides a graphical representation of EEG frequency and power over time, the SEF95 provides a numerical index of EEG frequency and power at any given time.

Burst suppression

Burst suppression reflects a profound state of brain inactivation and is frequently observed during deep anesthesia and hypothermia. The raw EEG waveform (Fig. 2) is recognized as cycles of short periods of high activity and flat (isoelectric) activity, switching back and forth every few seconds [37]. On DSA (Fig. 3), burst suppression appears as a pattern of alternating high- and low-power across many different frequencies, giving the spectrogram a striated appearance [38].

Burst suppression ratio

The BSR shows the percentage of time that the EEG is isoelectric. On the BIS monitor, the BSR represents the percentage of the previous 63 s epoch of EEG recognized as those periods longer than 0.5 s, during which the EEG voltage does not exceed approximately ± 5 μV (BIS VISTA Monitoring System [2008]). The BSR is 100% for an isoelectric EEG signal and 0 for an EEG signal without isoelectric periods [39].

Relative beta ratio

The relative beta ratio is the ratio of power in the theta versus beta frequency bands. A higher ratio indicates more power at slower frequencies and a deeper state of hypnosis. The relative beta ratio is used to compute the pEEG value but is not typically displayed on commercial monitors.

Non-EEG information on signal quality

The signal quality is indicated by various EEG monitors. The signal quality index of the BIS monitor predicts the reliability of the signal; the higher the signal quality index, the more reliable the BIS value. The electromyography (EMG) value indicates EMG activity, which reflects muscle stimulation caused by an increase in muscle tone or muscle movement. The higher the EMG value, the less reliable the pEEG number.

Combining non-proprietary EEG parameters to guide anesthetic dosing

The DSA can be monitored in conjunction with raw EEG waveforms and the SEF95 to guide anesthesia management in children [7,10,25,40]. DSA monitoring allows clinicians to directly and accurately visualize the effects of various anesthetic drugs on a patient’s EEG without relying on the pEEG number, enabling them to make better clinical inferences and titrate anesthesia doses more precisely to meet each patient’s requirements at any given time. This is particularly important in children with less predictable anesthetic requirements, such as those receiving total intravenous anesthesia (TIVA), neuromuscular blockers, or a combination of anesthetics with different mechanisms of action; those with atypical neurodevelopment or altered levels of consciousness prior to anesthesia; and those with hemodynamic instability as they need their anesthetic doses titrated more precisely to prevent over- or undersedation [25].

Children of all ages

In general, a shift in the SEF95 towards a lower frequency range during sevoflurane and propofol anesthesia (with a corresponding increase in slow/delta power on the DSA and decrease in alpha power) indicates increased hypnotic depth, while a shift in the SEF95 towards a higher frequency range indicates decreased hypnotic depth. For infants and children of all ages receiving propofol anesthesia, Xu et al. [41] suggested that SEF95 values of 15–20, 10–15, and 6–14 Hz should be targeted for sedation, surgical maintenance, and laryngoscopy/surgical incision, respectively. In infants aged > 3 months receiving sevoflurane anesthesia, Koch et al. [42] identified SEF95 cutoff values of < 7 Hz for deep anesthesia, < 13 Hz for surgical anesthesia, and > 20 Hz for sedation/consciousness, while Yuan et al. [10] proposed targeting SEF95 at 15–20 Hz for sedation, 10–15 Hz for surgical maintenance, and 6–14 Hz for laryngoscopy/surgical incision. These suggested values should be considered in the context of the patient’s raw EEG waveform, DSA, and other clinical parameters including heart rate, blood pressure, and movement to accurately assess the overall hypnotic state.

Infants aged 3 months to 1 year

Because proprietary pEEG indices are generally unreliable in infants aged < 1 years [26,27], the raw EEG waveform and DSA can be used to titrate both sevoflurane and propofol dosages. In infants aged > 6 months, alpha power is usually present [8], while in infants aged 4–5 months, intermittent (versus continuous) alpha power is often visualized using the DSA. Similar to that with older children, the EEG power shifts towards the slow/delta frequency range with increasing doses of propofol and sevoflurane. Thus, a shift in the SEF95 towards a lower range indicates increased hypnotic depth, while a shift in the SEF95 towards a higher range indicates decreased hypnotic depth.

Infants aged < 3 months

In infants aged < 3 months, frontal alpha coherence is absent. Alpha power is not visible on the DSA, and the overall power is low. Compared to that of older infants, neonatal EEG is characterized by a lower frequency and power. In preterm neonates at 28–34 weeks of gestational age, periods of isoelectric EEG are common, occurring during both wakefulness and sleep. Thus, a normal EEG in a non-anesthetized preterm neonate may appear similar to an EEG in an anesthetized child, potentially leading to confusion. The SEF95 and BSR do not reliably indicate changes in sevoflurane concentrations in infants aged < 3 months [43]. As such, the EEG waveform can be used to assess the level of hypnosis in neonates and infants and to identify periods of isoelectricity as an indicator of cortical inactivity and excess sevoflurane or propofol doses. When an infant demonstrates burst suppression or isoelectricity on the EEG waveform, with a correspondingly low SEF95, high BSR, and low EMG value (low likelihood of artifact), the sevoflurane or propofol dose should be decreased until activity returns on the EEG waveform. Correlations should be made with other clinical parameters, such as heart rate, blood pressure, and clinical signs of responsiveness.

EEG-guided anesthetic dosing examples

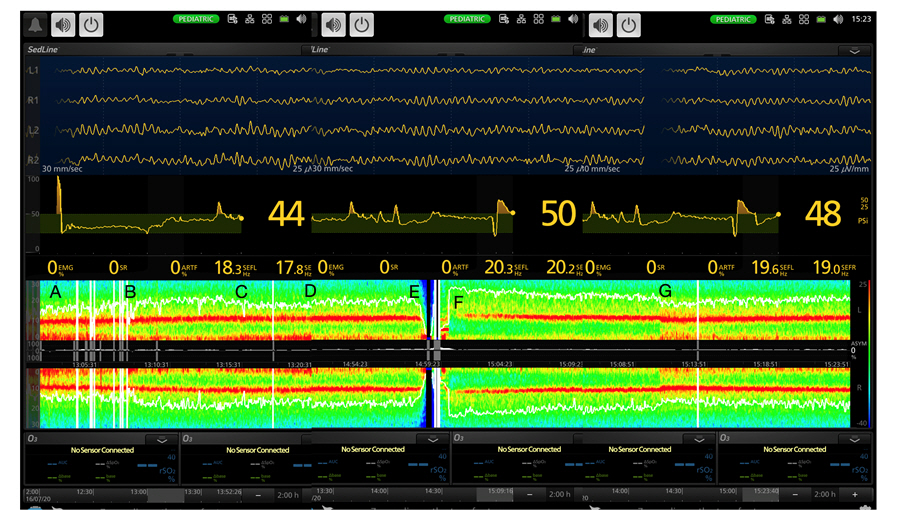
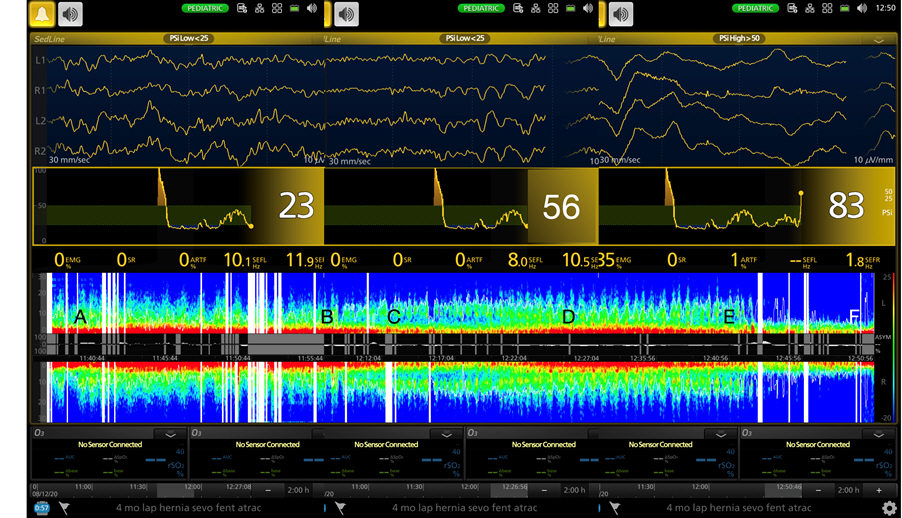
Figs. 35 illustrate examples of how to titrate anesthetic doses in response to oversedation, undersedation, and for young infants.

Case 1: Over-sedation

Fig. 3 shows a screenshot of the Sedline monitor of a 7-year-old, 23 kg male receiving sevoflurane anesthesia for right elbow fracture fixation. After sevoflurane inhalation induction, a laryngeal mask airway was inserted at Time A. The DSA showed high power only in the slow/delta frequency range, and the SEF95 was between 6 and 8 Hz. As the eSevo was reduced from 5.1% (A) to 2.5% during the maintenance phase (B), the DSA showed an increase in alpha power, and the SEF95 (indicated by the blue arrow) increased from 8 to 14 Hz, indicating decreasing hypnotic depth. During positioning and surgical preparation, the patient developed laryngospasm in response to the change in stimulation (C). Sevoflurane was increased, and propofol (2 mg/kg) was administered to treat the laryngospasm. Less than a minute after the propofol bolus, the EEG showed burst suppression, as seen on the DSA by the appearance of striated black lines at 08:59. Burst suppression can be clearly visualized in the time-domain trace during this time (Fig. 2). The eSevo was temporarily decreased until the EEG no longer showed burst suppression, and the SEF95 gradually increased to approximately 10 Hz (D), after which sevoflurane was increased to 3.0% and surgery proceeded uneventfully.
This case illustrates how EEG monitoring of both the time-domain trace and DSA can help clinicians detect periods of oversedation and burst suppression (due to a propofol bolus), thus prompting a reduction in eSevo and avoiding further oversedation.

Case 2: Under-sedation

Fig. 4 illustrates a combination of three serial Sedline screenshots of a 7-year-old, 19.1 kg female with cyanotic heart disease and pulmonary hypertension undergoing diagnostic cardiac catheterization. At Time A, the patient was hemodynamically stable, with an eSevo of 2.0%. During cannulation of the femoral vessels at Time B, the patient’s SEF95 increased from 14 to 18 Hz, with a corresponding decrease in slow/delta power, indicating a decrease in the hypnotic level. At Time C, the eSevo increased to 2.2%, SEF95 decreased to 15 Hz, and slow/delta power increased, indicating an increase in the hypnotic level. At Time D, the patient’s blood pressure started to decrease; hence, eSevo was reduced to 1.8%, which led to an increase in the SEF95 to 17 Hz and a decrease in the slow/delta power. At Time E, the patient suddenly developed transient severe hypotension (blood pressure, 40/20 mmHg) and bradycardia (heart rate, 48 beats/min). During this time, burst suppression was observed on EEG. Adrenaline 1 µg/kg was administered, cardiac output was rapidly restored, and EEG activity returned after approximately one minute. This was followed by a gradual increase in the SEF95 (24 Hz) with visible alpha power but minimal slow/delta power, indicating arousal. As the patient remained relatively hypotensive, eSevo was maintained at 1.6% until Time G, when the blood pressure stabilized in response to a vasopressor. This allowed the eSevo to increase to 1.8%, which led to a decrease in the SEF95 and return of slow/delta power.
This case illustrates how EEG can be used to detect undersedation during periods of hemodynamic instability. The DSA and SEF95 allow for accurate titration of sevoflurane concentrations within narrow therapeutic windows in hemodynamically unstable children.

Case 3: Young infant

Fig. 5 shows a combination of three Sedline screenshots from a 4-month-old, 6.6 kg male receiving sevoflurane anesthesia for laparoscopic inguinal hernia repair. The EEG and DSA showed low overall power, with a general absence of alpha power, as expected based on the child’s age. After inhalation induction with sevoflurane, atracurium 0.5 mg/kg was administered and endotracheal intubation was performed at Time A. At this time, eSevo was 2.4%, the EEG waveform showed predominantly slow/delta oscillations, DSA showed high slow/delta power, and SEF95 was between 7 and 9 Hz. The eSevo was then increased to 2.7% and fentanyl 0.5 µg/kg and intravenous paracetamol were administered in anticipation of surgical incision at Time B. Following surgical incision, no increase in heart rate or blood pressure was observed; therefore, eSevo was reduced to 2.05%. Following the creation of pneumoperitoneum at Time C, the EEG waveform showed higher frequency oscillations, SEF95 increased to 16 Hz, and slow/delta power decreased on the DSA, indicating arousal. Minimal changes in the heart rate and blood pressure were noted. Fentanyl 0.5 µg/kg was administered and eSevo increased. At Time D, eSevo was 3%, the SEF95 had decreased to 10 Hz, and the DSA showed increased delta power, indicating an increased hypnotic level, albeit to a lesser extent than that at Time A. Surgery was completed uneventfully, and sevoflurane was discontinued at Time E. A progressive increase in SEF95 levels and a loss of delta power was observed as the patient returned to consciousness and extubation was performed within 10 min (Time F).
This case illustrates how the EEG waveform, DSA, and SEF95 can be used to titrate sevoflurane doses during anesthesia in a 4-month-old infant. EEG monitoring was useful for detecting periods of arousal and undersedation intraoperatively, even in the absence of hemodynamic changes.

EEG-guided propofol anesthesia

Whereas the dosing examples above were all for a sevoflurane-based anesthetic, propofol-based TIVA has gained popularity recently as an environmentally friendlier alternative to sevoflurane, with a lower associated incidence of laryngospasm, emergence agitation, and postoperative nausea and vomiting. Unlike eSevo concentration monitoring, the propofol concentration (Ce) in the brain cannot be easily monitored, making dosing less accurate and predictable. EEG has been suggested as a reliable dynamic surrogate for brain propofol Ce to guide propofol TIVA dosing [41]. However, EEG-guided TIVA is uncommon in pediatric patients, and EEG curricula are not commonly taught in anesthesia training programs [4]. To take advantage of the clinical benefits of propofol TIVA and improve the dosing accuracy with EEG, Yuan et al. [44] and Jones Oguh et al. [45] initiated a quality improvement project to train their division on using EEG to guide TIVA dosing. The group used a combination of intraoperative teaching, didactic lectures, and quality improvement metrics to develop a sustainable, effective, and scalable program. The group emphasized the use of a combination of raw EEG, SEF95, and DSA data to titrate propofol and provided algorithms for use during induction, maintenance (Fig. 6), and emergence. Over the 12 month period, 79% (62/79) of the clinicians completed the EEG training program, and their knowledge test scores improved from 38% before training to 59% after training (P < 0.001). Four Plan-Do-Study-Act (PDSA) cycles were initiated, and the prevalence of using EEG to guide TIVA cases increased from 5% to 75% [45]. The incidence of perioperative emergency activation did not change significantly, while the emergence time for EEG-guided TIVA cases was significantly longer, the difference was not clinically significant (18 vs. 16 min, P < 0.001).

Epileptiform EEG changes

Since the advent of sevoflurane for clinical use in pediatric anesthesia, reports have described involuntary behaviors suggestive of seizure-like movements [46]. Initial case reports and subsequent studies have described these movements, with some studies recording EEG to detect brain wave correlates [47]. EEG studies have utilized nomenclature to describe patterns that have been defined in the neurology-epileptology literature but are unfamiliar to most anesthesiologists [47]. During induction, a prevalence of 30% (95% CI [27.2, 34.5]) has been reported for epileptiform changes [47], while other studies have reported estimates from 19% to 60% [48]. An important consideration to account for this wide range in prevalence is the use of heterogeneous EEG outcome classifications and variability in the number of channels recorded [47]. A standard definition, which is a simplified version of the International League Against Epilepsy (ILAE) and the American Clinical Neurophysiology Society (ACNS) classifications, has been proposed to help with future classifications. These classifications are presented verbatim below.
  • (1) No interictal epileptiform discharges or electrographic seizures

  •  (1a) Normal EEG

  •  (1b) Focal or generalized slowing, including rhythmic delta activity

  • (2) Interictal epileptiform discharges, defined as spikes, poly-spikes, sharp waves, or spike and wave complexes, reflecting possible areas of cortical irritability and potential epileptogenticity that are

  •  (2a) Isolated/sporadic epileptiform discharges, meaning they occur singly without repetition or periodic recurrence.

  •  (2b) Repetitive/periodic epileptiform discharges, meaning they occur repetitively, sometimes regularly at a specific frequency.

  • (3) Electrographic or electroclinical seizures, with electrographic seizure referring to observed salient EEG findings alone without clinical manifestations (e.g., no convulsions or other motor behaviors), in contrast to electroclinical seizures, which are characterized by both salient EEG features and clinical manifestations, such as tonic or clonic movements [47].”

While some EEG changes are abnormal and associated with certain clinical epilepsy syndromes, their clinical significance in healthy children under anesthesia with no history of neurological diseases is unclear and warrants further research. Therefore, any extrapolation from the anesthetized state should be done with caution.

EEG changes during spinal anesthesia

Spinal anesthesia is achieved by administering sodium (Na+) channel antagonists (e.g., bupivacaine) in the subarachnoid space, which produces regional, infraumbilical surgical antinociception [49] with significantly less apnea, hypoxia, and hypotension than that with general anesthesia [50,51]. Na+ channel antagonism in the lower spinal regions is not known or expected to produce sedation or decreased level of consciousness. However, the administration of spinal bupivacaine in young infants is associated with an ostensibly decreased level of arousal in the absence of any sedative-hypnotic agent. The neural basis for these spinal anesthesia-associated sedative effects and their implied central effects at an early age have been investigated. EEG data obtained from infants receiving spinal bupivacaine demonstrate distinct, measurable changes consisting of voltage attenuation, frequency slowing with significantly increased delta (0.5–5 Hz) spectral power, and the appearance of sleep spindle complexes of 12–14 Hz resembling normal physiological sleep [49,52]. Sleep spindles are a hallmark of Stage 2 non-rapid-eye-movement sleep, suggesting that spinal anesthetics may confer a more physiological sleep state than traditional sedative-hypnotic effects during general anesthesia [49,52]. Age-related changes in sleep spindles during spinal anesthesia generally correspond to developmental changes reported in the sleep EEG literature, supporting a sleep-related mechanism for the apparent sedation observed during infant spinal anesthesia [53]. Thalamocortical circuitry maturation is thought to be involved in the generation of sleep spindle oscillations, which begin to appear at approximately 46–48 weeks of gestational age [52,53].

Discontinuity and isoelectric EEG in young children

Isoelectric EEG reflects electrical inactivity in the cortex and can be observed in states of brain pathology (e.g., hypothermia and coma). Intraoperative isoelectric EEG is concerning in both adults and children under anesthesia, as it is thought to represent an “over-anesthetized” brain. Isoelectric EEG is associated with worse long-term neurological outcomes in neonates undergoing cardiac surgery [54]. In adults, intraoperative low-voltage EEG has been associated with postoperative delirium [55]. In children aged < 3 years undergoing sevoflurane anesthesia, Cornelissen et al. [56] found that 51% experienced isoelectric/discontinuity EEG, which was mostly observed during the first 30 min of anesthesia and was associated with younger age. High induction doses of propofol were administered to children with discontinuity events. In a related study from the same group, Agrawal et al. [37] found that in children aged > 4 months, a decrease in high-frequency activity occurred tens of seconds before each discontinuous event and a decline in spectral edge frequency occurred in the seconds immediately following each discontinuity.
Yuan et al. [57] observed isoelectric EEG events in 63% of children aged 0–37 months undergoing sevoflurane or propofol anesthesia. In a follow-up 15-center international study, the observed occurrence of isoelectric EEG events was 32% in 648 children aged < 37 months, but varied significantly between sites (9%–88%), suggesting that variances in anesthesia practice could contribute to the occurrence of isoelectric EEG [58]. Isoelectric events were associated with younger age, endotracheal tube use, propofol bolus for airway placement, and higher eSevo, and were less likely to occur when muscle relaxants were used for intubation. Importantly, isoelectric events were associated with moderate and severe hypotension between induction and incision (odds ratio [OR]: 3.5–4.6) and during surgical maintenance (OR: 3.6–7.1). Infants aged 0–12 mo who experienced isoelectric events had lower pediatric quality-of-life scores at baseline and postoperatively. The authors concluded that sicker infants were more prone to isoelectric EEG and relying on traditional MAC dosing may be “overdosing” the infant brain.
To determine the sevoflurane concentration associated with the occurrence of isoelectric EEG in 50% of children (MACisoEEG), He et al. [59] enrolled children aged 3–8 years and allocated them to one of three groups: (1) sevoflurane in 100% O2, (2) sevoflurane in 50% N2O mixed with 50% O2, and (3) sevoflurane in 100% O2 with a fentanyl bolus (3 μg/kg). The MACisoEEG was determined using Dixon’s up-down method after a 15-min period of steady eSevo. The MACisoEEG in the 100% O2 group was (median [95% CI]): 5.30% (5.12, 5.48), 5.83% (5.67, 5.99) in the 50% N2O group, and 5.37% (5.21, 5.53) in the fentanyl group. The authors concluded that the addition of 50% N2O modestly increased the MACisoEEG, whereas 3 μg/kg fentanyl had no effect on the MACisoEEG.

Alpha band associated with EEG discontinuity

In older infants and children, propofol and sevoflurane generate an alpha frequency (8–12 Hz) oscillation that represents coordinated firing activity of neurons between the thalamus and cerebral cortex [6062]. The degree of alpha oscillatory power during anesthesia decreases with age and is correlated with cognitive function, suggesting its capacity as a neurophysiological marker with potential clinical significance [63,64]. Plausibly, an association could be found between the alpha oscillatory power and low-voltage EEG patterns, such as discontinuous or isoelectric EEG, during anesthesia. Low alpha power in adults has been associated with the propensity for burst suppression and could be a neurophysiological phenotype for a “vulnerable brain” [65]. Similarly, in an observational cohort study of 54 infants, the degree of alpha oscillatory power induced by sevoflurane anesthesia was associated with the prevalence of EEG discontinuity, with every decibel increase in alpha power associated with a 49% reduction in the odds of developing low-voltage EEG (OR: 0.51, 95% CI [0.30, 0.89], P = 0.02), even after adjusting for chronological age and propofol administration [66]. No differences in alpha power in the baseline awake state were seen before anesthesia among the infants, and this effect could not be explained by differences in anesthetic dosing. These findings suggest hidden brain circuit properties could be unmasked under anesthesia. Anesthetic-induced alpha power is a putative marker of thalamocortical circuit development during the first year of life and can be useful in identifying young patients who have a greater chance of developing low-voltage patterns, with potential future applications in anesthesia management [66].

EEG monitoring to improve clinical outcomes

EEG monitoring provides insight into individual patients’ brain responses to anesthetic drugs, which are dependent on a variety of factors, including age, neurodevelopmental stage, disease state, concomitant medications, hemodynamic status, and surgical stimulation [10,25]. Multiple studies have demonstrated the utility of EEG monitoring in pediatric anesthesia [40,41,67,68], particularly during cardiac surgery, when cardiopulmonary bypass, induced hypothermia, and hemodynamic instability render the anesthetic requirements much less predictable [69,70]. EEG-guided anesthesia allows for accurate and timely visualization of brain responses and can complement routine monitoring in children to optimize anesthesia delivery and improve patient safety and experience. Recent studies have demonstrated that EEG monitoring may improve periprocedural outcomes in children undergoing anesthesia.

Reducing anesthetic dosage

Several randomized controlled trials (RCTs) have demonstrated that EEG-guided anesthesia can reduce intraoperative anesthetic dosage. In an RCT of 200 children aged 1–6 years undergoing minor surgery, Long et al. [71] showed that EEG-guided anesthesia resulted in lower sevoflurane requirements and a lower incidence of burst suppression than standard care. EEG guidance also enabled greater appreciation of the higher anesthetic requirements in younger children aged 1–2 years compared to children aged > 2 years. Han et al. [72] studied 54 children aged 2–12 years undergoing urological surgery and demonstrated that EEG-guided anesthesia management reduced the intraoperative sevoflurane dose and incidence of emergence delirium (ED). Weber et al. [73] reported that in children aged 12–17 years underdoing deep sedation for gastrointestinal endoscopy, propofol dosing guided by the Narcotrend index led to faster recovery, lower propofol consumption, and fewer episodes of oversedation than propofol dosing according to clinical surrogate parameters of depth of hypnosis.

Reducing perioperative adverse events

EEG-guided anesthesia may be associated with a reduced incidence of periprocedural adverse events. In a retrospective study of 206 children aged 2–8 years undergoing deep sedation with propofol target-controlled infusion, those who underwent BIS monitoring had a lower incidence of periprocedural adverse events (including hypoxia, apnea, and recurrent cough) and a shorter time to discharge [74].

EEG and emergence delirium

ED is common following pediatric anesthesia and consists of an altered mental status following emergence from anesthesia, with hallmark features of behavioral agitation and disorientation that are generally self-limiting in duration [75]. Several observational studies have found that certain EEG characteristics can predict the occurrence of ED in the post-anesthesia care unit. In a study involving 62 children, Koch et al. [76] showed that epileptiform EEG discharges in the form of interictal spike events observed during anesthesia induction was correlated with ED occurrence. In a similar study of 97 children conducted by the same group, no association was observed between intraoperative burst suppression and the development of ED [77]. In another observational study of 60 children, Martin et al. [78] found that, compared to age-matched controls without ED, children with ED showed higher frontal regional functional connectivity after discontinuation of sevoflurane anesthesia, suggesting a state of cortical hyperexcitability. In children without ED, an EEG pattern of sleep or drowsy states was observed before peaceful awakening, whereas in children with ED, arousal with clinical delirium occurred before the observation of EEG patterns of sleep. Kim et al. [79] showed that EEG characteristics, such as high relative delta power and an increased ratio of low-frequency (delta and theta) to high-frequency (alpha and beta) oscillations, were associated with the occurrence of ED. The authors suggested that transitioning rapidly from deep anesthesia to wakefulness in the absence of an EEG pattern resembling non-rapid-eye-movement Stage 2 sleep may predispose children to ED.
Three studies examined the association between EEG-guided anesthesia and the development of ED [72,80,81]. The first study compared the incidence of ED in children targeting anesthesia to an EEG SEF95 of 10–15 Hz vs. no EEG guidance [72]. The investigators observed a significantly lower incidence of ED among the children who received EEG-guided anesthetic management than among those who did not (5.6% vs. 36.8%, P = 0.04). The mean eSevo was also lower in the EEG-guided group. The second study examined the association between pEEG indices (Narcotrend index) and ED in children who underwent cardiac surgery with cardiopulmonary bypass and hypothermia [80]. A lower minimum Narcotrend index (corresponding to deeper hypnosis) was associated with a worse ED score (moderate negative correlation: rho = −0.41, 95% CI [−0.70, 0.0], P = 0.046). Furthermore, children with burst suppression EEG had a longer median intubation time in the intensive care unit than those without burse suppression EEG (P = 0.023). Lastly, in a study of 130 children, an EEG-derived wavelet analysis demonstrated that some processed indices could distinguish between children who would and would not develop ED, with an area under the curve of 0.84−0.89 [81].
Further studies with larger sample sizes are required to identify EEG characteristics that consistently predict ED to institute more precise and effective prevention strategies. Future research should collect EEG data to assess the effect of dexmedetomidine on ED, as well as any association with the quality of analgesia.

Future Studies

EEG monitoring has been shown to be a useful complement to the current standard anesthesia monitoring and management principles in children, enabling anesthesia to be personalized to each patient’s needs at any given moment. EEG monitoring allows for the detection of periods of over- or under-sedation and avoidance of intraoperative burst suppression, a state of profound brain inactivation that is common in infants but unnecessary for routine surgical anesthesia [26,57,66]. At present, whether intraoperative burst suppression is associated with subsequent neurological sequelae is unknown [37,58]; however, prolonged intraoperative burst suppression is associated with postoperative delirium [55,82]. Future studies should investigate whether intraoperative burst suppression is associated with ED and long-term neurodevelopmental outcomes. Clearer EEG predictors (such as functional connectivity or PAC indices) need to be established for anesthetic state transitions and emergence, particularly in young children. Well-designed prospective studies with larger sample sizes are needed to demonstrate the value of intraoperative EEG monitoring in reducing adverse events and improving clinical outcomes.

NOTES

Funding

I.Y: Received a consulting fee and research grant from Masimo Corp. (Irvine, CA, USA) for work unrelated to this review article; C.L.B: None; J.Y.C: Received a grant from the National Institutes of Health (NIH) National Center for Advancing Translational Science (NACTS) Einstein-Montefiore CTSA Grant Nos. UL1TR002556, KL2TR002558, and K23DA057499 for work unrelated to this review article.

Conflicts of Interest

No potential conflict of interest relevant to this article was reported.

Data Availability

Data sharing not applicable to this article as no datasets were generated or analyzed during the current study.

Author Contributions

Ian Yuan (Conceptualization; Formal analysis; Investigation; Methodology; Writing – original draft; Writing – review & editing)

Choon L. Bong (Conceptualization; Investigation; Methodology; Writing – original draft; Writing – review & editing)

Jerry Y. Chao (Conceptualization; Formal analysis; Investigation; Methodology; Writing – original draft; Writing – review & editing)

Fig. 1.
EEG parameters on a commercial EEG monitor. (A) EEG waveforms shows real-time 4-channel recordings from the left and right sides of the forehead, (B) percentage of EMG interference as number and graphic recordings, (C) PSI, a numeric proprietary index used by Masimo Inc., (D) percentage of BSR, (E) percentage of artifact, (F) SEF95 from left and right sides of the forehead, and (G) DSA showing left (top) and right (bottom) of the forehead (white line indicates the spectral edge frequency SEF95). This figure was adopted with permission [7]). EEG: electroencephalography, EMG: electromyography, PSI: patient state index, BSR: burst suppression ratio, SEF: spectral edge frequency, DSA: density spectral array.
kja-23843f1.jpg
Fig. 2.
Time domain trace (raw EEG waveform) on Sedline monitor showing burst suppression. Burst suppression is recognized on EEG as cycles of short periods of flat (isoelectric) activity (A) and short periods of high-amplitude activity (bursts) (B), switching back and forth every few seconds. Burst suppression reflects a profound state of brain inactivation during deep anesthesia and indicates a state of over-sedation. EEG: electroencephalography.
kja-23843f2.jpg
Fig. 3.
Screenshot of Sedline monitor indicating oversedation. (A) Insertion of the laryngeal mask airway after induction, (B) progressive increase in SEF95 from 8–12 Hz, indicating a decrease in hypnotic levels in response to decreasing sevoflurane concentrations, (C) a bolus of propofol was administered to treat laryngospasm caused by inadequate hypnotic levels in response to a change in stimulation, which led to burst suppression (indicated by the striated black lines between 08:59 and 09:01), and (D) patient is out of bust suppression and SEF95 gradually increased to approximately 10 Hz, indicating a return to a decreased hypnotic level. SEF: spectral edge frequency.
kja-23843f3.jpg
Fig. 4.
Combination of three serial screenshots of Sedline monitor indicating undersedation. A combination of three serial screenshots of a 7-year-old girl with cyanotic heart disease undergoing diagnostic cardiac catheterization. (A) The patient is hemodynamically stable with a sevoflurane concentration of 2.0%, (B) cannulation of the femoral vessels: SEF95 increased from 14–18 Hz with a decrease in slow/delta power, indicating a decrease in the hypnotic level, (C) sevoflurane increased to 2.2%, SEF95 decreased to 15 Hz with an increase in slow/delta power, indicating an increase in hypnotic depth, (D) sevoflurane concentration was reduced to 1.8% in response to decreasing blood pressure, (E) sudden severe hypotension and bradycardia, leading to EEG burst suppression, (F) EEG activity returned: SEF95 is 24 Hz with low alpha power and minimal slow/delta power, indicating arousal, and (G) blood pressure stabilized, allowing for the sevoflurane concentration to increase to 1.8%, SEF decreased to 19 Hz with increased slow/delta power, indicating an increase in hypnotic depth. EEG: electroencephalography, SEF: spectral edge frequency.
kja-23843f4.jpg
Fig. 5.
Combination of three serial Sedline screenshots of in a 4-month-old infant. Combination of three serial screenshots of a 4-month-old receiving sevoflurane anesthesia. (A) eSevo 2.4%, EEG waveform shows predominantly slow/delta oscillations, DSA shows high slow/delta power, SEF95 is 7–9 Hz, (B) surgical incision, eSevo 2.7%, minimal change in EEG, heart rate, and blood pressure, (C) pneumoperitoneum, eSevo 2.05%, EEG waveform showing higher frequency oscillations, SEF95 increased to 16 Hz and slow/delta power decreased on the DSA, indicating arousal, (D) eSevo 3%, SEF95 decreased to 10 Hz, DSA shows increased delta power, indicating an increased hypnotic level, (E) sevoflurane stopped, progressive increase in SEF95 and loss of delta power, and (F) patient extubated awake. EEG: electroencephalography, SEF: spectral edge frequency, DSA: density spectral array.
kja-23843f5.jpg
Fig. 6.
EEG-guided propofol TIVA dosing algorithm for anesthetic maintenance. This decision-making flowchart was provided to learners as a visual representation of the teaching points to help guide clinicians through EEG interpretation. The algorithm focuses on using raw EEG, SEF, and DSA to assess propofol Ce and titrate the propofol dose to the desired Ce to ensure an appropriate depth of hypnosis during the maintenance of general anesthesia (Adopted with permission [44]). EEG: electroencephalography, TIVA: total intravenous anesthesia, SEF: spectral edge frequency, DSA: density spectral array, propofol Ce: propofol concentration.
kja-23843f6.jpg

References

1. Lee U, Mashour GA. Role of network science in the study of anesthetic state transitions. Anesthesiology 2018; 129: 1029-44.
crossref pmid pmc pdf
2. Purdon PL, Sampson A, Pavone KJ, Brown EN. Clinical electroencephalography for anesthesiologists: Part I: background and basic signatures. Anesthesiology 2015; 123: 937-60.
crossref pmid pmc
3. Chan MT, Hedrick TL, Egan TD, García PS, Koch S, Purdon PL, et al. American Society for Enhanced Recovery and Perioperative Quality Initiative Joint Consensus Statement on the role of neuromonitoring in perioperative outcomes: electroencephalography. Anesth Analg 2020; 130: 1278-91.
crossref pmid
4. Nimmo AF, Absalom AR, Bagshaw O, Biswas A, Cook TM, Costello A, et al. Guidelines for the safe practice of total intravenous anaesthesia (TIVA): Joint Guidelines from the Association of Anaesthetists and the Society for Intravenous Anaesthesia. Anaesthesia 2019; 74: 211-24.
crossref pmid pdf
5. Disma N, Veyckemans F, Virag K, Hansen TG, Becke K, Harlet P, et al. Morbidity and mortality after anaesthesia in early life: results of the European prospective multicentre observational study, neonate and children audit of anaesthesia practice in Europe (NECTARINE). Br J Anaesth 2021; 126: 1157-72.
pmid
6. Constant I, Sabourdin N. The EEG signal: a window on the cortical brain activity. Paediatr Anaesth 2012; 22: 539-52.
crossref pmid
7. Yuan I, Xu T, Kurth CD. Using electroencephalography (EEG) to guide propofol and sevoflurane dosing in pediatric anesthesia. Anesthesiol Clin 2020; 38: 709-25.
crossref pmid
8. Cornelissen L, Kim SE, Lee JM, Brown EN, Purdon PL, Berde CB. Electroencephalographic markers of brain development during sevoflurane anaesthesia in children up to 3 years old. Br J Anaesth 2018; 120: 1274-86.
crossref pmid pmc
9. Bowyer SM. Coherence a measure of the brain networks: past and present. Neuropsychiatr Electrophysiol 2016; 2: 1.
crossref pdf
10. Yuan I, Chao JY, Kurth CD, Missett R, Cornelissen L. Intraoperative EEG monitoring in pediatric anesthesia. Curr Anesthesiol Rep 2023; 13: 135-42.
crossref pdf
11. Markus M, Nagelsmann H, Schneider M, Rupp L, Spies C, Koch S. Peri- and intraoperative EEG signatures in newborns and infants. Clin Neurophysiol 2021; 132: 2959-64.
crossref pmid
12. de Heer IJ, Bouman SJ, Weber F. Electroencephalographic (EEG) density spectral array monitoring in children during sevoflurane anaesthesia: a prospective observational study. Anaesthesia 2019; 74: 45-50.
crossref pmid pmc pdf
13. Akeju O, Pavone KJ, Thum JA, Firth PG, Westover MB, Puglia M, et al. Age-dependency of sevoflurane-induced electroencephalogram dynamics in children. Br J Anaesth 2015; 115 Suppl 1(Suppl 1): i66-76.
crossref pmid pmc
14. Lee JM, Akeju O, Terzakis K, Pavone KJ, Deng H, Houle TT, et al. A prospective study of age-dependent changes in propofol-induced electroencephalogram oscillations in children. Anesthesiology 2017; 127: 293-306.
crossref pmid pdf
15. Rigouzzo A, Khoy-Ear L, Laude D, Louvet N, Moutard ML, Sabourdin N, et al. EEG profiles during general anesthesia in children: a comparative study between sevoflurane and propofol. Paediatr Anaesth 2019; 29: 250-7.
crossref pmid pdf
16. Cornelissen L, Donado C, Lee JM, Liang NE, Mills I, Tou A, et al. Clinical signs and electroencephalographic patterns of emergence from sevoflurane anaesthesia in children: an observational study. Eur J Anaesthesiol 2018; 35: 49-59.
crossref pmid pmc
17. Desowska A, Berde CB, Cornelissen L. Emerging functional connectivity patterns during sevoflurane anaesthesia in the developing human brain. Br J Anaesth 2023; 130: e381-90.
crossref pmid
18. Puglia MP, Vlisides PE, Kaplan CM, Jewell ES, Therrian M, Mashour GA, et al. Constrained functional connectivity dynamics in pediatric surgical patients undergoing general anesthesia. Anesthesiology 2022; 137: 28-40.
crossref pmid pdf
19. Li D, Vlisides PE, Kelz MB, Avidan MS, Mashour GA. Dynamic cortical connectivity during general anesthesia in healthy volunteers. Anesthesiology 2019; 130: 870-84.
crossref pmid pdf
20. Pappas I, Cornelissen L, Menon DK, Berde CB, Stamatakis EA. δ-oscillation correlates of anesthesia-induced unconsciousness in large-scale brain networks of human infants. Anesthesiology 2019; 131: 1239-53.
crossref pmid pdf
21. Zakaria L, Desowska A, Berde CB, Cornelissen L. Electroencephalographic delta and alpha oscillations reveal phase-amplitude coupling in paediatric patients undergoing sevoflurane-based general anaesthesia. Br J Anaesth 2023; 130: 595-602.
crossref pmid
22. Liang Z, Ren N, Wen X, Li H, Guo H, Ma Y, et al. Age-dependent cross frequency coupling features from children to adults during general anesthesia. NeuroImage 2021; 240: 118372.
crossref pmid
23. Soplata AE, McCarthy MM, Sherfey J, Lee S, Purdon PL, Brown EN, et al. Thalamocortical control of propofol phase-amplitude coupling. PLoS Comput Biol 2017; 13: e1005879.
crossref pmid pmc
24. Fahy BG, Chau DF. The technology of processed electroencephalogram monitoring devices for assessment of depth of anesthesia. Anesth Analg 2018; 126: 111-7.
crossref pmid
25. Bong CL, Balanza GA, Khoo CE, Tan JS, Desel T, Purdon PL. A narrative review illustrating the clinical utility of electroencephalogram-guided anesthesia care in children. Anesth Analg 2023; 137: 108-23.
crossref pmid
26. Gao Z, Zhang J, Zhang X, Wang L, Huang Y, Yu J. A retrospective study of the patient state index during general anesthesia in infants and young children. Clin Pediatr (Phila) 2024; 63: 249-56.
crossref pmid pdf
27. Jeleazcov C, Schmidt J, Schmitz B, Becke K, Albrecht S. EEG variables as measures of arousal during propofol anaesthesia for general surgery in children: rational selection and age dependence. Br J Anaesth 2007; 99: 845-54.
crossref pmid
28. Dennhardt N, Arndt S, Beck C, Boethig D, Heiderich S, Schultz B, et al. Effect of age on Narcotrend Index monitoring during sevoflurane anesthesia in children below 2 years of age. Paediatr Anaesth 2018; 28: 112-9.
crossref pmid pdf
29. Sciusco A, Standing JF, Sheng Y, Raimondo P, Cinnella G, Dambrosio M. Effect of age on the performance of bispectral and entropy indices during sevoflurane pediatric anesthesia: a pharmacometric study. Paediatr Anaesth 2017; 27: 399-408.
crossref pmid pdf
30. Jang YE, Kim EH, Lee JH, Kim JT, Kim HS. Usefulness of bispectral index and patient state index during sevoflurane anesthesia in children: a prospective observational study. Medicine (Baltimore) 2022; 101: e29925.
crossref pmid pmc
31. Sadhasivam S, Ganesh A, Robison A, Kaye R, Watcha MF. Validation of the bispectral index monitor for measuring the depth of sedation in children. Anesth Analg 2006; 102: 383-8.
crossref pmid
32. Ricci Z, Robino C, Rufini P, Cumbo S, Cavallini S, Gobbi L, et al. Monitoring anesthesia depth with patient state index during pediatric surgery. Paediatr Anaesth 2023; 33: 855-61.
crossref pmid
33. Wang F, Zhang J, Yu J, Tian M, Cui X, Wu A. Variation of bispectral index in children aged 1-12 years under propofol anesthesia: an observational study. BMC Anesthesiol 2019; 19: 145.
crossref pmid pmc pdf
34. Akeju O, Westover MB, Pavone KJ, Sampson AL, Hartnack KE, Brown EN, et al. Effects of sevoflurane and propofol on frontal electroencephalogram power and coherence. Anesthesiology 2014; 121: 990-8.
crossref pmid pmc pdf
35. Akeju O, Song AH, Hamilos AE, Pavone KJ, Flores FJ, Brown EN, et al. Electroencephalogram signatures of ketamine anesthesia-induced unconsciousness. Clin Neurophysiol 2016; 127: 2414-22.
crossref pmid pmc
36. Hagihira S. Changes in the electroencephalogram during anaesthesia and their physiological basis. Br J Anaesth 2015; 115 Suppl 1: i27-31.
crossref pmid
37. Agrawal U, Berde CB, Cornelissen L. Electroencephalographic features of discontinuous activity in anesthetized infants and children. PLoS One 2019; 14: e0223324.
crossref pmid pmc
38. Zafar SF, Amorim E, Williamsom CA, Jing J, Gilmore EJ, Haider HA, et al. A standardized nomenclature for spectrogram EEG patterns: Inter-rater agreement and correspondence with common intensive care unit EEG patterns. Clin Neurophysiol 2020; 131: 2298-306.
crossref pmid pmc
39. Muhlhofer WG, Zak R, Kamal T, Rizvi B, Sands LP, Yuan M, et al. Burst-suppression ratio underestimates absolute duration of electroencephalogram suppression compared with visual analysis of intraoperative electroencephalogram. Br J Anaesth 2017; 118: 755-61.
crossref pmid pmc
40. Brandt SP, Walsh EC, Cornelissen L, Lee JM, Berde C, Shank ES, et al. Case studies using the electroencephalogram to monitor anesthesia-induced brain states in children. Anesth Analg 2020; 131: 1043-56.
crossref pmid pmc
41. Xu T, Kurth CD, Yuan I, Vutskits L, Zhu T. An approach to using pharmacokinetics and electroencephalography for propofol anesthesia for surgery in infants. Paediatr Anaesth 2020; 30: 1299-307.
crossref pmid pdf
42. Koch S, Stegherr AM, Mörgeli R, Kramer S, Toubekis E, Lichtner G, et al. Electroencephalogram dynamics in children during different levels of anaesthetic depth. Clin Neurophysiol 2017; 128: 2014-21.
crossref pmid
43. Hayashi K, Shigemi K, Sawa T. Neonatal electroencephalography shows low sensitivity to anesthesia. Neurosci Lett 2012; 517: 87-91.
crossref pmid
44. Yuan I, Missett RM, Jones-Oguh S, Massa CB, Babus LW, Garcia-Marcinkiewicz AG, et al. Implementation of an electroencephalogram-guided propofol anesthesia education program in an academic pediatric anesthesia practice. Paediatr Anaesth 2022; 32: 1252-61.
crossref pmid pdf
45. Jones Oguh S, Iyer RS, Yuan I, Missett R, Daly Guris RJ, Johnson G, et al. Implementation of an electroencephalogram-guided propofol anesthesia practice in a large academic pediatric hospital: a quality improvement project. Paediatr Anaesth 2024; 34: 160-6.
crossref pmid
46. Constant I, Seeman R, Murat I. Sevoflurane and epileptiform EEG changes. Paediatr Anaesth 2005; 15: 266-74.
crossref pmid
47. Chao JY, Tam M, Ferrera A, Ivenitsky D, Gizzo L, Schwartz R, et al. Epileptiform discharges, electrographic seizures, and electroclinical seizures during paediatric sevoflurane anaesthesia: a systematic review and proposal for standard definitions. Br J Anaesth 2023; 130: e18-21.
crossref pmid pmc
48. Miao M, Han Y, Zhang Y, Xu Y, Zhang L, Yang Y, et al. Epileptiform EEG discharges during sevoflurane anesthesia in children: a meta-analysis. Clin Neurophysiol 2022; 143: 48-55.
crossref pmid
49. Whitaker EE, Chao JY, Holmes GL, Legatt AD, Yozawitz EG, Purdon PL, et al. Electroencephalographic assessment of infant spinal anesthesia: a pilot prospective observational study. Paediatr Anaesth 2021; 31: 1179-86.
crossref pmid pmc pdf
50. Jones LJ, Craven PD, Lakkundi A, Foster JP, Badawi N. Regional (spinal, epidural, caudal) versus general anaesthesia in preterm infants undergoing inguinal herniorrhaphy in early infancy. Cochrane Database Syst Rev 2015; 2015: CD003669.
crossref pmid pmc
51. McCann ME, Withington DE, Arnup SJ, Davidson AJ, Disma N, Frawley G, et al. Differences in blood pressure in infants after general anesthesia compared to awake regional anesthesia (GAS study-a prospective randomized trial). Anesth Analg 2017; 125: 837-45.
crossref pmid pmc
52. Britton JW, Frey LC, Hopp JL, Korb P, Koubeissi MZ, Lievens WE, et al. Electroencephalography (EEG): an introductory text and atlas of normal and abnormal findings in adults, children, and infants [Internet]. Chicago, American Epilepsy Society. 2016, pp 25-6. https://www.ncbi.nlm.nih.gov/books/NBK390354/pdf/Bookshelf_NBK390354.pdf

53. Santa Cruz Mercado LA, Lee JM, Liu R, Deng H, Johnson JJ, Chen AL, et al. Age-dependent electroencephalogram features in infants under spinal anesthesia appear to mirror physiologic sleep in the developing brain: a prospective observational study. Anesth Analg 2023; 137: 1241-9.
crossref pmid
54. Seltzer L, Swartz MF, Kwon J, Burchfiel J, Cholette JM, Wang H, et al. Neurodevelopmental outcomes after neonatal cardiac surgery: role of cortical isoelectric activity. J Thorac Cardiovasc Surg 2016; 151: 1137-42.
crossref pmid
55. Fritz BA, Kalarickal PL, Maybrier HR, Muench MR, Dearth D, Chen Y, et al. Intraoperative electroencephalogram suppression predicts postoperative delirium. Anesth Analg 2016; 122: 234-42.
crossref pmid pmc
56. Cornelissen L, Bergin AM, Lobo K, Donado C, Soul JS, Berde CB. Electroencephalographic discontinuity during sevoflurane anesthesia in infants and children. Paediatr Anaesth 2017; 27: 251-62.
crossref pmid pdf
57. Yuan I, Landis WP, Topjian AA, Abend NS, Lang SS, Huh JW, et al. Prevalence of isoelectric electroencephalography events in infants and young children undergoing general anesthesia. Anesth Analg 2020; 130: 462-71.
crossref pmid
58. Yuan I, Xu T, Skowno J, Zhang B, Davidson A, von Ungern-Sternberg BS, et al. Isoelectric electroencephalography in infants and toddlers during anesthesia for surgery: an international observational study. Anesthesiology 2022; 137: 187-200.
crossref pmid pdf
59. He L, Wang X, Zheng S. Determination of the minimal alveolar concentration of sevoflurane associated with isoelectric electroencephalogram in children: a prospective, randomized, double-blind study. Paediatr Anaesth 2018; 28: 1043-9.
crossref pmid pdf
60. Ching S, Cimenser A, Purdon PL, Brown EN, Kopell NJ. Thalamocortical model for a propofol-induced alpha-rhythm associated with loss of consciousness. Proc Natl Acad Sci U S A 2010; 107: 22665-70.
crossref pmid pmc
61. Purdon PL, Pierce ET, Mukamel EA, Prerau MJ, Walsh JL, Wong KF, et al. Electroencephalogram signatures of loss and recovery of consciousness from propofol. Proc Natl Acad Sci U S A 2013; 110: E1142-51.
crossref pmid pmc
62. Flores FJ, Hartnack KE, Fath AB, Kim SE, Wilson MA, Brown EN, et al. Thalamocortical synchronization during induction and emergence from propofol-induced unconsciousness. Proc Natl Acad Sci U S A 2017; 114: E6660-8.
crossref pmid pmc
63. Giattino CM, Gardner JE, Sbahi FM, Roberts KC, Cooter M, Moretti E, et al. Intraoperative frontal alpha-band power correlates with preoperative neurocognitive function in older adults. Front Syst Neurosci 2017; 11: 24.
crossref pmid pmc
64. Gutierrez R, Egaña JI, Saez I, Reyes F, Briceño C, Venegas M, et al. Intraoperative low alpha power in the electroencephalogram is associated with postoperative subsyndromal delirium. Front Syst Neurosci 2019; 13: 56.
crossref pmid pmc
65. Shao YR, Kahali P, Houle TT, Deng H, Colvin C, Dickerson BC, et al. Low frontal alpha power is associated with the propensity for burst suppression: an electroencephalogram phenotype for a "Vulnerable Brain". Anesth Analg 2020; 131: 1529-39.
crossref pmid pmc
66. Chao JY, Gutiérrez R, Legatt AD, Yozawitz EG, Lo Y, Adams DC, et al. Decreased electroencephalographic alpha power during anesthesia induction is associated with EEG discontinuity in human infants. Anesth Analg 2022; 135: 1207-16.
crossref pmid pmc
67. Beekoo D, Yuan K, Dai S, Chen L, Di M, Wang S, et al. Analyzing electroencephalography (EEG) waves provides a reliable tool to assess the depth of sevoflurane anesthesia in pediatric patients. Med Sci Monit 2019; 25: 4035-40.
crossref pmid pmc
68. Tokuwaka J, Satsumae T, Mizutani T, Yamada K, Inomata S, Tanaka M. The relationship between age and minimum alveolar concentration of sevoflurane for maintaining bispectral index below 50 in children. Anaesthesia 2015; 70: 318-22.
crossref pmid pdf
69. Alkhatip AA, Kamel MG, Farag EM, Elayashy M, Farag A, Yassin HM, et al. Deep hypothermic circulatory arrest in the pediatric population undergoing cardiac surgery with electroencephalography monitoring: a systematic review and meta-analysis. J Cardiothorac Vasc Anesth 2021; 35: 2875-88.
crossref pmid
70. Klamt JG, Garcia WN, Carvalho M, Garcia LV, Menardi AC. Multimodal neuromonitoring during pediatric cardiac surgery. Braz J Cardiovasc Surg 2022; 37: 251-8.
crossref pmid pmc
71. Long MH, Lim EH, Balanza GA, Allen JC Jr, Purdon PL, Bong CL. Sevoflurane requirements during electroencephalogram (EEG)-guided vs standard anesthesia care in children: a randomized controlled trial. J Clin Anesth 2022; 81: 110913.
crossref pmid
72. Han Y, Miao M, Li P, Yang Y, Zhang H, Zhang B, et al. EEG-parameter-guided anesthesia for prevention of emergence delirium in children. Brain Sci 2022; 12: 1195.
crossref pmid pmc
73. Weber F, Walhout LC, Escher JC. The impact of Narcotrend™ EEG-guided propofol administration on the speed of recovery from pediatric procedural sedation-a randomized controlled trial. Paediatr Anaesth 2018; 28: 443-9.
crossref pmid
74. Chen SC, Chen CY, Shen SJ, Tsai YF, Ko YC, Chuang LC, et al. Application of Bispectral Index System (BIS) monitor to ambulatory pediatric dental patients under intravenous deep sedation. Diagnostics (Basel) 2023; 13: 1789.
crossref pmid pmc
75. Mason KP. Paediatric emergence delirium: a comprehensive review and interpretation of the literature. Br J Anaesth 2017; 118: 335-43.
crossref pmid
76. Koch S, Rupp L, Prager C, Wernecke KD, Kramer S, Fahlenkamp A, et al. Emergence delirium in children is related to epileptiform discharges during anaesthesia induction: an observational study. Eur J Anaesthesiol 2018; 35: 929-36.
crossref pmid
77. Koch S, Stegherr AM, Rupp L, Kruppa J, Prager C, Kramer S, et al. Emergence delirium in children is not related to intraoperative burst suppression - prospective, observational electrography study. BMC Anesthesiol 2019; 19: 146.
crossref pmid pmc pdf
78. Martin JC, Liley DT, Harvey AS, Kuhlmann L, Sleigh JW, Davidson AJ. Alterations in the functional connectivity of frontal lobe networks preceding emergence delirium in children. Anesthesiology 2014; 121: 740-52.
crossref pmid pdf
79. Kim J, Lee HC, Byun SH, Lim H, Lee M, Choung Y, et al. Frontal electroencephalogram activity during emergence from general anaesthesia in children with and without emergence delirium. Br J Anaesth 2021; 126: 293-303.
crossref pmid
80. Köditz H, Drouche A, Dennhardt N, Schmidt M, Schultz M, Schultz B. Depth of anesthesia, temperature, and postoperative delirium in children and adolescents undergoing cardiac surgery. BMC Anesthesiol 2023; 23: 148.
crossref pmid pmc pdf
81. Zhang W, Cheng Y, Zhang L, Wei Y, Xie H, Huang J. Association between emergence delirium and brain status parameters in children undergoing general anesthesia: a prospective observational study. Paediatr Anaesth 2024; 34: 130-7.
crossref pmid pmc
82. Pedemonte JC, Plummer GS, Chamadia S, Locascio JJ, Hahm E, Ethridge B, et al. Electroencephalogram Burst-suppression during Cardiopulmonary Bypass in Elderly Patients Mediates Postoperative Delirium. Anesthesiology 2020; 133: 280-92.
crossref pmid pmc pdf


ABOUT
ARTICLE CATEGORY

Browse all articles >

BROWSE ARTICLES
AUTHOR INFORMATION
Editorial Office
101-3503, Lotte Castle President, 109 Mapo-daero, Mapo-gu, Seoul 04146, Korea
Tel: +82-2-792-5128    Fax: +82-2-792-4089    E-mail: journal@anesthesia.or.kr                

Copyright © 2024 by Korean Society of Anesthesiologists.

Developed in M2PI

Close layer
prev next