Introduction
Patients with end-stage liver disease frequently have cardiovascular dysfunction, termed cirrhotic cardiomyopathy [1] that is characterized by an impaired contractile response to stress. The cause of cirrhotic cardiomyopathy is unclear; however, this syndrome is considered to be related to both portal hypertension and cirrhosis [2]. Advanced liver disease is associated with a hyperdynamic circulatory state characterized by high cardiac output and low systemic vascular resistance [3]. Furthermore, arterial compliance is directly related to cirrhosis severity and hyperdynamic circulatory derangement. Although liver transplantation (LT) is known to reverse cardiovascular dysfunction within 6–12 months [4], progression of pre-existing or new-onset cardiac events has been reported [5], possibly due to acute changes in loading conditions in the immediate postoperative period.
The left ventricular (LV) pressure–volume relationship, estimated from echocardiographic measurements, has been proposed to assess the interaction between the arterial and ventricular systems [6]. Ventriculoarterial coupling (VAC) is defined as the ratio of arterial elastance (Ea) to LV end-systolic elastance (Ees). Suga [6] first proposed the use of VAC to evaluate interactions between cardiac performance and vascular function. Although the interaction of the left ventricle (LV) with the arterial system, or VAC, is a key determinant of cardiovascular performance [7], little is known about the changes in Ea, Ees (stiffness), and VAC (Ea/Ees) after LT. Therefore, we evaluated the Ea, Ees, and Ea/Ees ratios in patients undergoing LT, as well as alterations in these parameters immediately after LT. Furthermore, we examined whether decoupling the ventriculoarterial relationship was associated with postoperative complications and length of hospital stay.
Materials and Methods
Patients
This study was a retrospective analysis of prospectively collected data and was approved by Asan Medical Center Institutional Review Board (2015-0060). The electronic medical records of 344 patients who underwent living- or deceased-donor LT between January and December 2012 were reviewed. Data from 104 patients were excluded because two patients had valvular heart disease, four patients had chronic renal disease, 80 patients did not undergo preoperative or postoperative transthoracic echocardiography (TTE), and 18 patients underwent postoperative echocardiography for more than 30 days after LT. Finally, 240 patients were enrolled in the analyses. The use of diuretics or beta-blockers was continued if they were used at the time of admission.
Pre- and post-transplant echocardiographic measurements
TTE was routinely performed twice, preoperatively and postoperatively within 30 days before discharge, in LT recipients. Patients who had undergone TTE at the time of deterioration were excluded. We only included results from routine TTE performed in the echocardiography laboratory. The ventricular dimensions, wall thickness, and chamber volume were determined using two-dimensional echocardiography. Blood pressure (BP) was measured using sphygmomanometry simultaneously during TTE or as the average of the same day. End-systolic pressure (ESP) was estimated from the product of 0.9 × systolic blood pressure (SBP) [7]. The apical four-chamber LV end-diastolic volume (EDV), end-systolic volume (ESV), and stroke volume (SV) were determined using the Teichholz method or modified Simpson’s method. The E/A ratio was measured using pulsed-wave Doppler examination of the mitral inflow. E' is the mitral septal annulus early diastolic velocity, and systolic velocity (S') is the index of contractility obtained by tissue Doppler imaging. The ratio of early mitral peak velocity to tissue Doppler early mitral annular velocity (E/E') was used to estimate LV end-diastolic pressure (LVEDP), as previously validated (= 11.96 + 0.596 × E/E') [8].
LV pressure–volume relationships
To evaluate the ESP–volume relationships non-invasively, we used a modified single-beat method [6]. LV end-diastolic chamber stiffness (end-diastolic elastance, Eed) was estimated from the ratio of the LVEDP to the EDV [9]. The effective Ea that is a measure of the total arterial load was estimated using the ESP/SV ratio [7]. Although Ees is a useful load-independent index of LV contractility, it may be influenced by cardiac chamber remodeling and geometry [7]. Ees can be calculated by ESP/(ESV - V0), assuming that V0 is negligible compared to ESV. The Ea/Ees ratio is an interaction between the LV and the arterial system and is used to assess VAC. The SV/pulse pressure (PP) ratio was measured and used to estimate the total arterial compliance (TAC) [10].
Postoperative outcomes
Postoperative outcomes included the development of major adverse cardiovascular events (MACE) and length of stay in the intensive care unit (ICU) and hospital. MACE included cardiovascular complications, such as non-fatal myocardial infarction (indicated in the medical records, by electrocardiographic findings, and elevated troponin I levels > 0.2 ng/ml), serious arrhythmia (atrial fibrillation with rapid ventricular response, ventricular tachycardia, or ventricular fibrillation), new-onset or aggravated heart failure, or cardiac death during the postoperative period [11]. New-onset or aggravated heart failure was clinically defined as the presence of at least two symptoms of heart failure (paroxysmal nocturnal dyspnea, orthopnea, lower extremity edema, and shortness of breath) in addition to one clinical feature (jugular venous distension and pulmonary rales) and either an elevated brain natriuretic peptide level > 100 pg/ml or chest X-ray findings of pulmonary edema [5].
Statistical analyses
Data are expressed as means and standard deviations or medians and ranges, as appropriate. Categorical data are expressed as counts and percentages. Differences between the preoperative and postoperative TTE examinations were assessed using paired t-tests. Pearson’s correlation analysis was performed between Ea and other vascular parameters, Ees and other parameters of LV contractility.
Univariate linear regression analysis was performed to determine the factors associated with the development of MACE and prolonged postoperative hospital stay. The development of MACE was divided into two groups, and the length of postoperative hospital stay was categorized into two groups according to their 90th percentile value. The two groups were then compared using paired t-tests. Covariates with a value of P < 0.1 by univariate analysis, were included in multivariate linear regression analyses (forward step). Statistical significance set at P < 0.05 was considered significant. Analyses were performed using SPSS version 21.0 (IBM Corp.) and SigmaPlot (version 12.0; Systat)
Results
None of the patients received inotropic agents or vasopressors preoperatively. The baseline characteristics of the 240 patients are summarized in Table 1.
All patients underwent echocardiography within 30 postoperative days (16 [14, 19]) before discharge from the hospital. After LT, the ESP was elevated from 98 ± 12 to 107 ± 14 (P < 0.001) and was associated with an increase in LV mass index. Cardiac volume decreased, as evidenced by left atrial volume (P < 0.001), LV ESV (P = 0.010), LV EDV (P = 0.001), and SV (P = 0.001) (Table 2).
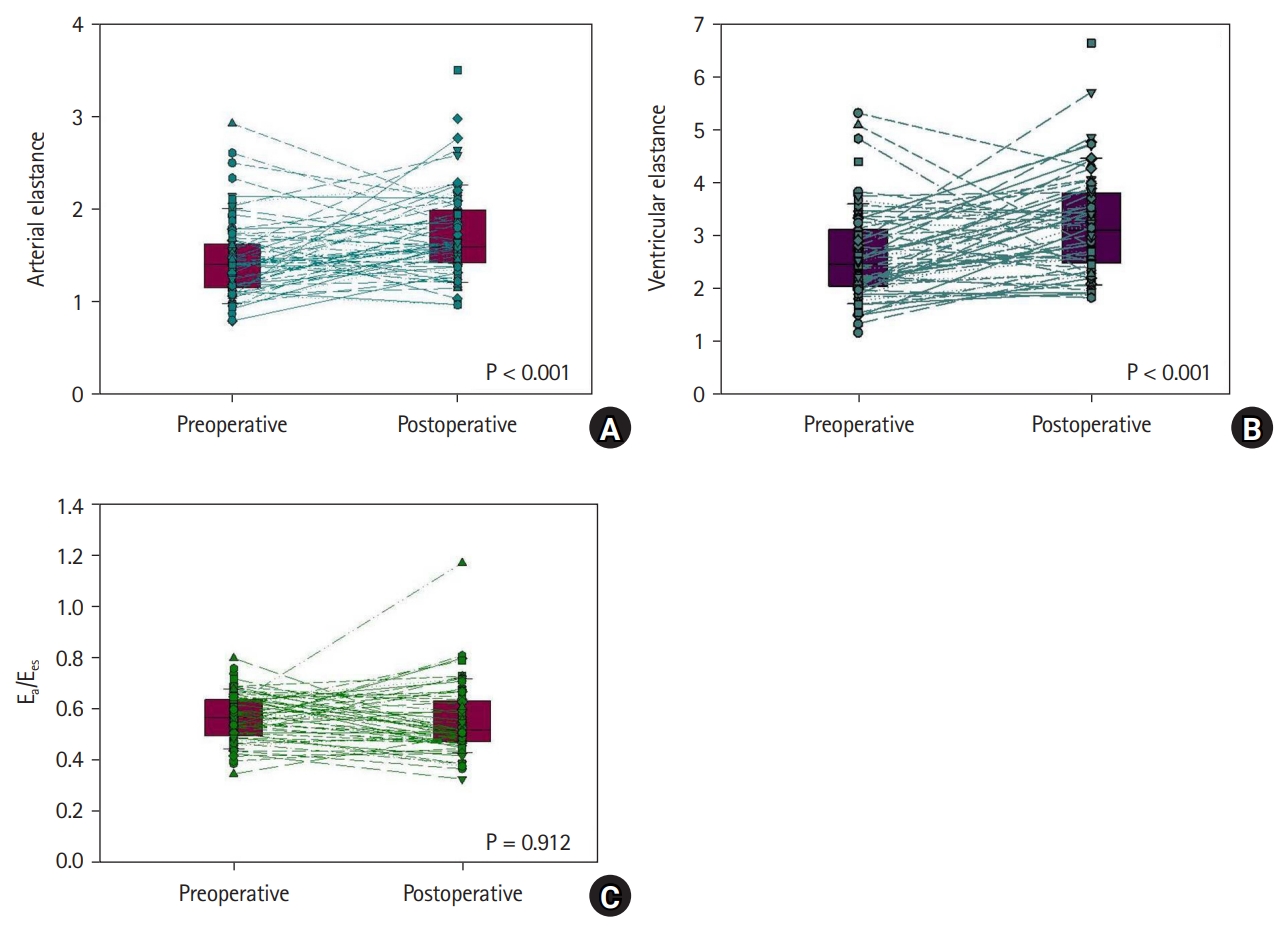
Ea was highly correlated with the SV/PP ratio (preoperative and postoperative, r = −0.799 and −0.738, respectively). Thirty days following LT, Ea increased by 16% (P < 0.001) and TAC decreased by 14% (P < 0.001). Additionally, Ees was correlated with the LV ejection fraction (EF) and S' preoperatively (P = 0.032 and P < 0.001, respectively) and postoperatively (P = 0.048 and P < 0.001, respectively). Ees and the contractility index of S' increased by 18% (P < 0.001) and 7% (P < 0.001), respectively; however, LV EF was unaltered (P = 0.427). Given the increase in Ea and Ees, the Ea/Ees ratio remained unchanged (0.56 to 0.56, P = 0.912) (Fig. 1). LV diastolic function changed immediately after LT within one month and the E/A ratio decreased by 16% (P < 0.001), whereas E/E' and Eed increased by 5% (P = 0.017) and 6% (P < 0.001), respectively, in association with an increase in LVEDP (P = 0.017).
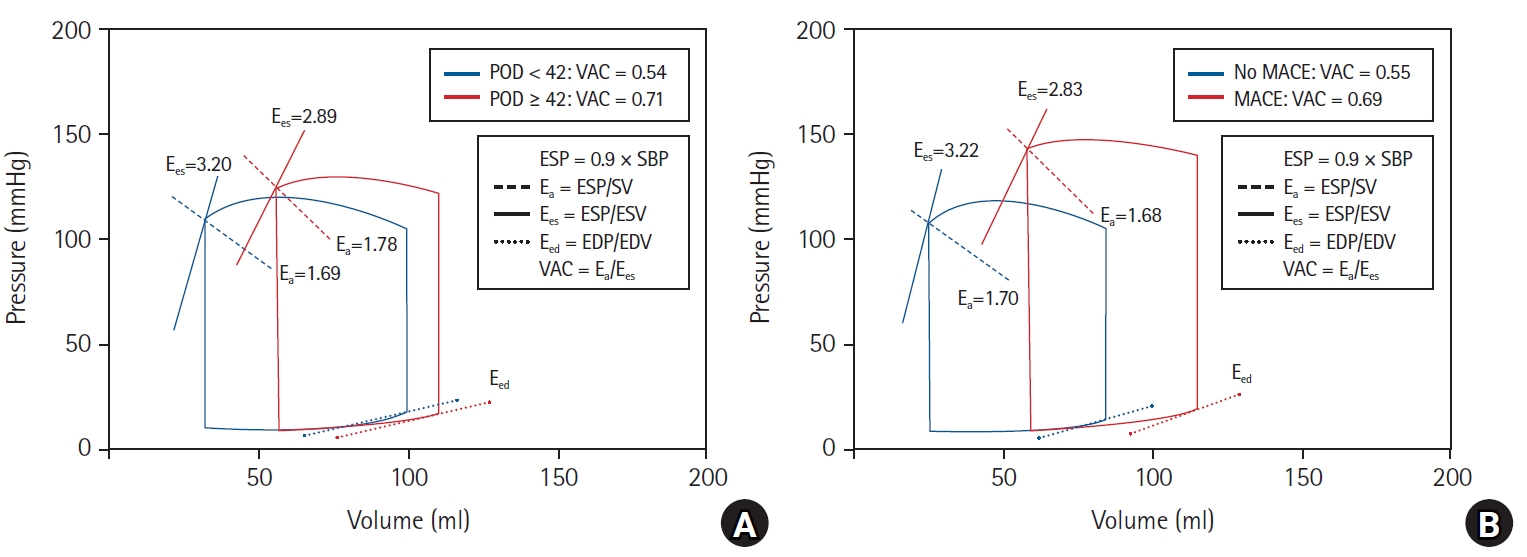
The median lengths of postoperative ICU and hospital stays were 2 days (1, 3) and 22 days (20, 29), respectively (Table 3). In the univariate linear regression analysis, the postoperative hospital stay length was significantly associated with the Model for End-Stage Liver Disease (MELD) score (r = 0.283, P < 0.001), postoperative Ea (r = 0.157, P = 0.016), Ees (r = -0.157, P = 0.019), and Ea/Ees ratio (r = 0.695, P < 0.001). However, the postoperative E/A ratio (P = 0.967), E/E' (P = 0.939), and S' (P = 0.536) were not significantly correlated with the postoperative length of stay (Table 4). Patients with prolonged postoperative hospital stays (≥ 42 days; 90th percentile) had a higher postoperative Ea/Ees ratio (0.54 ± 0.10 vs. 0.71 ± 0.47, P = 0.005), E/E' (9.7 ± 2.6 vs. 11.5 ± 4.4, P = 0.006), and LVEDP (17.7 ± 1.5 vs. 18.8 ± 2.6, P = 0.006), and lower LV EF (65.0 ± 4.6 vs. 61.3 ± 8.5, P = 0.003) and S' (9.2 ± 1.7 vs. 8.4 ±2.1, P = 0.032) (Table 5). On multivariate regression analysis, high MELD score (odds ratio [OR]: 1.126, 95% CI [1.073, 1.182], P < 0.001) and higher postoperative Ea/Ees ratio (OR: 1.467; 95% CI [1.010, 2.049], P = 0.038) were identified as independent risk factors for longer postoperative hospital stays (Table 6). In patients with a prolonged hospital stay after LT, an increase in Ea without an increase in Ees led to a higher VAC; however, this was not observed in patients who were discharged within 42 days postoperatively (Fig. 2A).
Of these patients, 29 (12.1%) had MACE before hospital discharge (Table 3). MACE was significantly associated with the MELD score (P = 0.005), postoperative ESV (P = 0.002), EDV (P = 0.017), LV EF (P = 0.018), E/E' (P = 0.009), LVEDP (P = 0.009), and Ea/Ees ratio (P = 0.008). Compared with patients without postoperative MACE, patients with MACE had decreased Ees, whereas Ea was similar; therefore, Ea/Ees ratio increased, and the pressure–volume loop shifted to the right side (Fig. 2B). Patients with MACE had longer postoperative hospital stays (25.77 ± 14.32 days vs. 67.14 ± 97.11 days, P = 0.030). Multivariate regression analysis identified high MELD score (OR: 1.064, 95% CI [1.017, 1.113], P = 0.008), lower LV EF (OR: 1.514; 95% CI [1.079, 2.123], P = 0.016), and higher postoperative Ea/Ees ratio (OR: 6.347, 95% CI [1.672, 24.091], P = 0.007) as independent risk factors for postoperative MACE (Table 6).
Discussion
This study investigated the characteristics of the pressure–volume relationship in patients undergoing LT and alterations in these parameters immediately after LT. We found that despite elevations in the arterial load in the 30 days following LT, VAC remained unaltered in normally discharged patients without MACE. However, patients with postoperative MACE had a significantly higher Ea/Ees ratio than those without MACE (Fig. 2). Additionally, the development of MACE was associated with prolonged postoperative hospital stay that was significantly correlated with a higher postoperative Ea/Ees ratio. Our findings suggest that in patients discharged within one month after LT, LV contractility increases and the resulting increase in arterial load leads to the maintenance of VAC. However, if Ees did not increase more than the changes in Ea, the ratio of Ea to Ees increased and ventriculoarterial decoupling developed.
We analyzed the LV pressure–volume curve to assess the net interaction of the ventriculoarterial system. Ees is a load-independent index of myocardial contractility and LV inotropic efficiency [12]. Similarly, in our study, preoperative and postoperative Ees correlated with other measures of LV contractility, such as EF and S'. Although LV systolic performance can be significantly influenced by the structural and geometric characteristics of the LV, it is mainly derived from myocardial contractility [13]. Collectively, these results suggest that Ees is reflective of LV systolic function. On the ESP–volume line, Ea is quantified by the SV ejected from the ventricle against the arterial load that should be overcome by the LV. Compliance is elevated in patients with end-stage liver disease, and the SV/PP ratio reflects abnormalities in arterial compliance in these patients [10]. In addition, Ea is inversely correlated with TAC [14]. Our results showed that the SV/PP ratio was highly inversely correlated with Ea, a measure of net arterial load, and may represent TAC in patients undergoing LT. Torregrosa et al. [4] found that cardiac alterations in cirrhosis were reversed within 6–12 months after LT by normalization of the systolic response. In addition, some studies have reported that TAC increased within 2–6 months after transplantation [15,16]. To our knowledge, this reversibility is generally observed within 30 days after transplantation, and LV systolic function increases concordantly with arterial stiffness, thereby maintaining VAC. This study is the first to analyze changes in arterial and ventricular elastance within one month of LT.
In the present study, the pressure–volume characteristics of patients with poor postoperative outcomes were fairly different from those of normally discharged patients without complications. Although studies have reported conflicting results, increases in the ventricular chamber size and volume have also been reported in patients with liver cirrhosis [17,18]. Our study found that the left ventricular ESV, EDV, and SV in patients with poor postoperative outcomes were higher than those in patients without complications. Alterations in LV volume and pressure are expected to contribute to the pressure–volume curve [19,20]. Consequently, a decrease in Ees and an increase in ESP, ESV, and EDV induced a pressure–volume curve shift to the right in patients who developed MACE and had longer postoperative hospital stays (Fig. 2). We also observed that VAC increased in patients with poor outcomes. This suggests that within one month after LT, the LV systolic function increased and matched the arterial load in normally discharged patients without complications; however, a relative increase in VAC adversely affected the clinical outcome. The Ea/Ees ratio is an important determinant of the net cardiac performance [21]. Contractility or arterial tone that is too high or too low decouples these processes and can lead to cardiac failure independent of myocardial ischemia or toxic effects. Both cardiac and arterial decoupling can lead to acute hemodynamic decompensation that is classified according to the underlying pathophysiological mechanisms. Because acute hemodynamic impairment should be treated based on the etiological mechanism of cardiovascular dysfunction, it is very important to evaluate the VAC. Although alterations in the VAC and its components, Ea and Ees, have been reported in aging, hypertension, and heart failure [22], data on patients with end-stage liver disease are lacking. This was the first study to examine changes in arterial and LV elastance after LT. According to our results, MACE within one month of LT seemed to develop due to ventriculoarterial decoupling because LV contractility did not increase in accordance with the arterial load. Additionally, these patients had longer postoperative hospital stays. In patients with cirrhotic cardiomyopathy, decoupling of the ventriculoarterial interaction after surgery can occur because of a reduction in the cardiac reserve. Collectively, these results suggest that perioperative assessment of the estimated VAC derived from echocardiography may be a valuable indicator of postoperative cardiovascular dysfunction and may help guide therapeutic strategies.
This study had some limitations. First, this was a retrospective study conducted at a single medical center. Therefore, the timing of the BP measurements and echocardiography was not controlled. Second, we did not measure Ea and Ees from the pressure–volume loops acquired during cardiac catheterization. However, this technique is invasive and its use in humans is limited; therefore, non-invasive assessments of Ea and Ees have been developed in previous studies [23,24]. Non-invasively obtained Ea/Ees ratios have been shown to closely approximate those obtained invasively [25]. Further prospective studies are needed to validate the gold-standard invasive methods. Third, Ees estimated by non-invasive single-beat determination using echocardiography when V0 was designated as a volume axis intercept was considered reliable [6]. However, we simply regarded the ratio of ESP to ESV as Ees, assuming that V0 was negligible compared with ESV [7]. If V0 had been used in the calculations, the results would have differed. Further studies are needed to examine the pressure–volume relationship using V0.
In conclusion, despite an elevated arterial load within 30 days after LT, VAC remained unaltered in patients discharged without MACE. Myocardial stiffness and contractility were increased to match the arterial load in patients without MACE. However, patients with postoperative MACE had significantly higher Ea/Ees ratios than those without MACE. Our results suggest that MACE within one month postoperatively seemed to develop due to ventriculoarterial decoupling because the LV contractility did not increase and match the arterial load. Therefore, perioperative assessment of the Ea/Ees ratio derived from echocardiography may be valuable for predicting postoperative cardiovascular dysfunction and guiding therapeutic strategies.