Introduction
A well-established sample size is very important for presenting, analyzing, and drawing conclusions. However, determining the sample size is one of the challenges in research design [1]. If the calculated sample size is inadequate or not described properly, it is difficult to avoid a negative review and the findings of the study would not be accepted. In this paper, along with some explanation to help understand sample size, several examples of incorrectly described and well-described cases of sample size calculation are presented. The subjects of this study were randomized controlled studies published in the Korean Journal of Anesthesiology(KJA) 2018–2019 and Anesthesia and Pain Medicine(APM) 2019. All explanations were described for the t-test to distinguish the difference between the means of the continuous variables in two independent groups, based on two-tailed test, significance level of 0.05, and power of 80%. For a detailed explanation, refer to the papers by Kim and Park [1], Kwak and Kim [2], and Kim [3].
The following factors are needed to calculate the sample size of a randomized controlled study.
Effect size, significance level, and power
The effect size or treatment effect is the difference between groups that investigators try to observe. It is the minimal difference determined to be meaningful. However, the size and unit of the effect size vary depending on the observation variable. For example, a study comparing the hypotensive effects of two antihypertensive drugs could set the effect size to be an average difference of 20 mmHg. As another example, if you compare the heights of men between two regions, the effect size could be set to an average difference of 5 cm. Standardization1) is necessary to use these various effect sizes (treatment effects) in calculating sample size [4–6]. One of the typical standardized effect size is Cohen's d, which divides the difference in mean by the pooled standard deviation (Equation 1) [4–6]. Through standardization, the sample size can be calculated regardless of the nature of the observed variables. In the hypertensive drug study described above, the standardized effect size can be obtained by dividing the mean difference of 20 mmHg by the standard deviation of blood pressure. Also, in the study of male height by region, the standardized effect size is calculated by dividing the average difference of 5 cm by the standard deviation of the height.
The second important factor is the significance level. When comparing the two groups, it is well known that analysis by random sampling is often performed because full surveys are frequently impossible. Even though there is no difference between the two groups, Type I error can be found due to the limitation of the analysis by sampling, rejecting the null hypothesis of “no difference.” For statistical analysis, it is necessary to set the probability to allow Type I error, which is called a significance level (α). In clinical studies, the significance level is usually 5% [4, 7]. In the statistical analysis, if the P value is lower than the significance level, the zero hypothesis of “no difference” is rejected and the alternative hypothesis, “there is difference” is adopted. Power is important here. Power is the probability that the alternative hypothesis is true in the statistical analysis when the alternative hypothesis is really true2). If the power is set low, it means that the alternative hypothesis is less likely to be true even if the alternative hypothesis is adopted, so it is difficult to trust the result that the alternative hypothesis is true. This is because the Type I error may have occurred. In order to avoid this risk, power should also be adequate. Clinical studies usually specify power at 90% or 80% [7].
Finally, what happens if we adopt a larger sample size than is calculated by specifying a typical effect size, significance level, and power? Or what if we recruit more subjects during the study than the sample size established in the study design? Under the same conditions3), as the sample size increases, the power increases as well as the probability of statistical significance. This is because increasing the sample size reduces the standard error (Equation 2).
For this reason, the researcher may be tempted to include an unnecessarily large number of subjects at the design stage, or to add subjects if significant results have not been obtained despite the recruitment of the proposed number of subjects. However, a breach of the study design initially established causes a number of biases and lowers confidence in the results of the study. To avoid this risk, the journal requires the approval number of the Institutional Review Board (also known as an independent ethics committee, ethical review board, or research ethics board) and the registration number given on the official website4).
To illustrate the importance of a carefully determined sample size, let's take an extreme example. Compared to the existing surgery method (500,000 won, control), the new surgery method (5 million won, experimental group) is expensive, but hypothesized to significantly shorten the hospital stay. The study recruited 10,000 participants each to the control and experimental groups. The average length of hospital stay, which was 7 days, was shortened by 10 minutes in the experimental group and was statistically significant. Although a 10-minute reduction in length of stay is statistically significant, it may not be clinically meaningful. Rather, if the sample size was only determined to get a significant statistical result, it will be difficult to avoid accusations of incurring unnecessary physical and economic losses to patients in the study. In addition, waste of research resources such as research expenses and input of research personnel cannot be ignored. Therefore, the sample size should be carefully determined from the design stage, taking into account not only statistical significance but also cost-effectiveness, ethical concerns regarding the patient, and clinical significance.
Dropout rate
Participants are dropped from studies for a variety of reasons. Therefore, an adjusted sample size with a dropout rate is required to better understand the characteristics of each study and to ensure power even after some subjects drop out [4]. A common error in the dropout rate calculation is that the additional recruits are simply calculated by multiplying the sample size by the dropout rate (Equation 3). When the adjusted sample size including the dropout rate is multiplied by the dropout rate, the sample size we want to obtain should be arrived at (Equation 4).
For example, suppose we need 500 subjects for the targeted power and expect a 10% dropout rate during the study. It is a miscalculation to determine that 550 are needed participants by simply adding 50, which is 10% of 500. As there should be 500 remaining individuals after 10% dropout,
Initial recruitment × (1 – 0.1) = 500
(1 – 0.1) to the right-hand side,
Initial recruitment = 500 / (1 – 0.1) = 555.56
Rounding up 555.56 would result in 556 subjects.
Status of sample size description in published papers
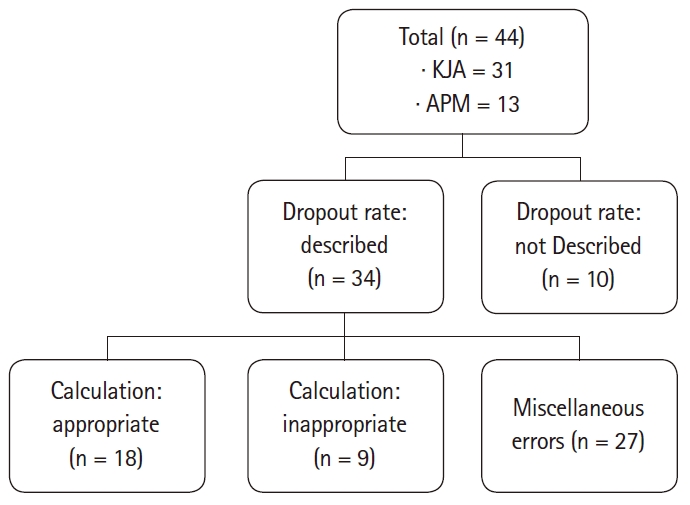
In the KJA from vol. 71, no. 1, 2018 to vol. 72, no. 5, 2019, 31 randomized controlled clinical studies were included. APM included 13 of the papers published in vol. 14, no. 1 to 3 in 2019. A total of 44 papers were divided and reviewed by members of the Statistical Round in KJA. Afterwards, the plenary session finally decided whether the reviews were appropriate5). The following items were examined to confirm the calculation and description of the sample size:
Is the primary endpoint clearly defined?
Are the primary endpoint and the statistics used to calculate the sample size consistent with each other?
Is the rationale or reference of the effect size adequately described?
What level of significance and power is selected?
Is the dropout rate appropriate, and is the final sample size properly calculated?
Is the entire calculation process appropriate and without error?
In looking for the primary endpoint, the statistics applied to it were also reviewed. Table 1 shows the types of statistics used in 44 papers. The table shows different frequencies between the statistics used in the primary endpoint and those used in the sample size calculation. The t-statistic was used more than the F-statistic in the calculation of sample size compared to the analysis of primary outcome. This is probably because the t-statistic between any two groups was obtained without using the F-statistic in order to avoid complex calculations in comparative studies for three or more groups. In addition, in the sample size calculation, there was one case where the technique is not clear but is estimated to use z-statistics, and there were two cases classified as “Others” because it was impossible to figure out the statistics used.
In most cases, the primary outcome was suggested, but in some papers it was difficult to determine it because multiple outcome variables were listed without explicit description. In such cases, the variable used to calculate the sample size was determined as the primary outcome. Even if non-parametric statistical methods were applied because the primary outcome data did not satisfy the normality assumptions, they were classified as parametric (e.g., t-test for Mann-Whitney). Even if several variables are analyzed in the study, the calculation of the sample size should be done on the primary outcome.
Table 2 summarizes the effect size description. Table 2-A shows the basis for determining the effect size. Table 2-B shows whether the statistics of the effect size needed to calculate the sample size are presented properly. For example, in an experimental-control study comparing mean between two groups, the mean of each group (or the difference between the mean of the two groups), the standard deviation, or the incidence of events in each group should be described. If only some of these values are described and it is not possible to determine whether the sample size calculation is appropriate, they are classified as incomplete. Eight cases had no mention of the effect size (Table 2-A), and 11 cases did not describe the actual value, even though the effect size was mentioned. Thirteen cases were unable to calculate the sample size because they were not detailed enough.
Except for a case of missing description, 0.05 was chosen as the significance level (Table 3). The majority of the studies (77%) had 80% for power, but few (18%) had 90%. In one case, 99% power was chosen. As described above, power increases as the sample size increases at the same significance level. This is hard to see in clinical studies. It is possible that an overly large sample size was set in the study design or additional individuals were recruited during the study to obtain significant results.
Fig. 1 summarizes the dropout rates presented in the papers, ranging from 5–20%. Eighteen of the 44 cases were appropriate and the sample size calculation process was clearly described. Miscellaneous errors included the cases where the primary endpoint is unclear, there is no value of dropout rate even though it is described to be reflected in the calculation process, there is no data of the primary endpoint regarding sample size calculation, or there are calculation errors other than the dropout rate.
Finally, it was checked whether all of the steps mentioned above were executed properly to yield the correct sample size. Of the 44 cases, 9 had all the techniques and calculations properly carried out. There were 15 cases where it was impossible to determine whether the calculation was adequate due to insufficient records, and 20 cases where all parts were recorded but the calculation was incorrect.
Inappropriate and appropriate examples of sample size calculations6)
In this section, excerpts of sample size calculations from published papers are presented, giving examples that are inappropriately described and examples that are appropriately described. Some of the contents are modified for better understanding.
1. Undefined primary outcome
1) The primary outcome was the NRS at six hours postoperatively.
2) For detection of a 50% reduction of rescue analgesia for each group at 6 hours postoperatively.
The above two sentences describe the primary outcome in each study design.
In the first study, the pain described by the Numeral Rating Scale at 6 hours after surgery as the primary outcome is not clear. There is no specific description such as postoperative pain or sore throat after tracheal tube extubation. In addition, the baseline time point for the 6-hour passage is not clear.
The second study was designed to detect 50% differences in group anal analgesia. However, the criteria for a 50% reduction are not described—whether the dose of analgesic is decreased or the frequency of administration is reduced—and again, the baseline for 6 hours is not clear.
2. Missing standard deviation
To detect a difference in mean time to first bowel movement of 24 hours, a sample size of 28 in each group was calculated, with power of 80% and 5% level of significance (two-tailed). Based on a report, the reduction in mean time was 15.1 hours.
To determine the effect size, the difference between the means of the two groups and the standard deviation of each group are needed. In this case, it was not possible to confirm whether the described sample size was calculated because the standard deviation was not presented (Equation 5).
3. Missing mean difference and standard deviation
Based on a previous study, a sample size for two groups was 40 patients to demonstrate 40% mean difference with 80% power and 5% level of significance. To allow for study error and attrition, 60 patients were included in this study.
In this case, the mean difference and the group standard deviation are not described in the text. It is not possible to calculate the sample size only by the ratio of the differences between the groups (Equation 6).
Although the cited reference includes the value, it is difficult for the reader to determine which value, so the value used should be described in detail.
4. Missing specific values in comparison of incidence rates
Assuming that drug A would reduce the incidence of nausea by 50%, we would need 30 patients in each group (80% power, 5% level of significance).
Only 50% reduction is described without baseline incidence of control group. If the incidence of the control group is 50%, the incidence of the treatment group with a 50% reduction is 25% and 74 participants are required. If the incidence of the control group is 40%, the incidence of the treatment group is reduced by 50% to 20%, and 105 individuals are required (Equation 7, 8). Inferring in 30 patients would result in a 77% incidence of controls (Equation 9), but no source for 77% was given in the text.
5. Calculation error
Based on a previous study, the incidence of pain in the control group was assumed to be 70%; we considered a 40% reduction in pain to be clinically significant. The minimum sample size for each group was 29 patients assuming 5% significance level and 90% power using the two-tailed Z test for proportions.
First, the subject of the 40% reduction is not clear. If there is a 40% reduction in the incidence of the 70% of the control group (0.7 × 0.4 = 0.28), the incidence of the treatment group is 42% (0.7 – 0.28 = 0.42). Substituting this incidence, the sample size is 61 instead of 29 (Equation 10). Alternatively, if 40% means the difference between the incidence of 70% of the control group and 30% of the incidence of the treatment group, 28 are calculated (Equation 11).
Even when all the values necessary for calculation are described, there can be errors in calculation. Therefore, in order to secure the reliability of the results, a careful examination of the calculation process is required.
6. Dropout rate
The sample size of 39 patients in each group was calculated with 90% power and 5% significance level. The final sample size consisted of 43 patients to allow for a 10% dropout
Forty-three participants were presented, adding 10% to 39. However, the sample size remaining after dropout rate should be 39.
The result is 43.33, but the value after the decimal point should be rounded up to one person (Equation 12).
That is, 44 subjects, not 43, should be recruited.
7. Proper description
“The primary outcome of this study was the time required to inset the device successfully on the first attempt, which was defined as the time interval from picking up the device to the appearance of the first square waveform on capnography.”
“The insertion times of both devices were measured in a preliminary study (n = 12 for each), and average insertion times of the i-gel™ and LMA Supreme™ were 22.5 s (SD 8.1 s) and 32.7 s (SD 11.3 s), respectively. Sample size was calculated with an effect size of 1.032, power of 0.8, and α-value of 0.05 (two-sided) and 16 patients were required per group. Taking into consideration a potential dropout rate of 15%, 19 patients were enrolled.”
The above sentences cite the case where the sample size calculation is appropriate in the published paper [8]. The primary outcome is clearly defined. Previous study data needed to calculate the effect size are presented, and the level of significance, power, and dropout rate are appropriately calculated.
Conclusion
For the sample size calculation, the following steps must be implemented consistently: 1) matching the primary outcome with the variable used to calculate the sample size; 2) presentation of appropriate significance, power, and effect size; and 3) application of the correct dropout rate. It is also necessary to resist the temptation to prove statistical significance by unnecessarily increasing the sample size. In addition to statistical significance, the clinical significance, cost-effectiveness, and ethical concerns regarding patients should be considered. When calculating the sample size, the appropriate dropout rate should be applied according to the characteristics of each study, and the sample size we want to obtain should be arrived at when the dropout rate is multiplied by the recruitment.
In reviewing the randomized controlled trials included in this study, only 20% (9/44) of the sample sizes were calculated. Many of the existing studies, including this paper, focused on the hypotheses and results of the study, but were relatively generous in power and sample size calculations. However, more and more journals require submissions based on the Consolidated Standards of Reporting Trials (CONSORT) checklist for systematic and transparent randomized control clinical studies, including the description of effect sizes. In order to properly conduct research, it is essential to understand the processes necessary to calculate the sample size, beyond the significance of the P value. Reviewers and editors should also carefully assess the appropriateness of the sample size calculation process while evaluating the paper for publication in a journal.
Strict criteria for sample size are not a burden on the researcher. On the contrary, from the perspective of the researcher, strict criteria can save time and effort. It can help avoid the unfortunate situation where a paper produced after long and laborious work is not accepted due to issues related to sample size. In addition, from the journal's point of view, it can help bring about a positive change. It can help change a culture in which only statistically significant results are published, and bring attention to interesting and useful studies having clinical significance, rather than exclusively statistical significance. Therefore, setting up a clear and strict system for sample size calculation, will make it possible to cultivate an environment in which studies with various results can be published without publication bias.