Introduction
Combined spinal and epidural anesthesia (CSEA) is a regional anesthetic technique that combines the benefits of both spinal and epidural anesthesia. The spinal component provides the rapid onset of a predictable block. The indwelling epidural catheter allows the dose to be titrated to the desired neuroaxial block effect and provide long lasting analgesia [1]. Because of these potential advantages, CSEA is a useful anesthetic technique for Caesarean sections.
However, during CSEA, confirmation of the correct position of the indwelling epidural catheter before the administration of a large quantity of local anesthetic is very important for avoiding life-threatening complications due to intrathecal or intravascular injection of a large quantity of a local anesthetic. To confirm the correct position of the indwelling epidural catheter, a small quantity of a local anesthetic and epinephrine mixture, 'epidural test dose' is administered through an indwelling epidural catheter. The position of the indwelling epidural catheter is then evaluated by observing the patient's response [2]. In 1981, Moore and Batra [3] first demonstrated the clinical value of a mixture of lidocaine 45 mg and epinephrine 15 µg as the epidural test dose, which is currently used widely as an epidural test dose.
Recently it was reported that the intravascular injection of simulated epidural test doses containing epinephrine results in a change in the T-wave on an electrocardiogram (ECG) [4-8]. In addition, Tanaka et al. [7] reported that the change in T-wave on ECG was induced by a lower dose of epinephrine than the traditional test dose (15 µg). The results of these studies suggest that the incidental intravascular injection of an epinephrine-containing test dose can be detected by observing the change in the T-wave on ECG. Although the results of these studies were obtained on non-anesthetic patients or general anesthetic patients, it may be inappropriate to apply these to spinal anesthetic patients.
Therefore, this study evaluated the change in T-wave on ECG after the intravascular administration of a lower dose epinephrine-containing epidural test dose during spinal anesthesia.
Materials and Methods
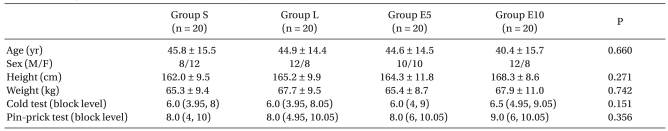
This study was approved by the Hospital Ethics Committee and informed consent from all participating patients was obtained. The subjects were 80 ASA PS I patients, aged 18-65 years. The patients were scheduled to undergo spinal anesthesia for elective surgery. None of the patients were taking cardiovascular drugs. The patients were divided into four groups in a randomized and double-blind manner. Group S (n = 20) received 3 ml of normal saline. Group L (n = 20) received 3 ml of 1.0% lidocaine. Group E5 (n = 20) received 3 ml of 1.0% lidocaine with epinephrine 5 µg. Group E10 (n = 20) received 3 ml of 1.0% lidocaine with epinephrine 10 µg. Table 1 lists the demographic data and sensory block levels.
All patients arrived at the operating room without premedication. The patients were monitored with ECG using five electrodes, noninvasive blood pressure, and the peripheral saturation of pulse oxymetry. The administration route of the test dose was limited to the forearm veins in all patients. In the case of patients with the IV line in another part of the body, the IV route was secured on the forearm vein. All patients underwent spinal anesthesia with hyperbaric bupivacaine 10-15 mg via a 25-gauge Quincke needle inserted at the L3-4 or L4-5 interspace. The SBP and HR were monitored every 1 minute for the first 10 minutes and every 5 minute until the experiment was started. While monitoring the SBP and HR, the patients received 8 ml/kg of Ringer's lactate solution. None of the patients required a vasopressor agent because the SBP was reduced to <80 mmHg before starting the experiment of the simulating IV test dose. The level of block was confirmed by a cold test and pinprick test at 5 and 30 minutes after the intrathecal administration of local anesthetics.
After confirming the block level in the first 30 minutes, the baseline of the SBP was measured and the baseline of the ECG (standard lead II) was printed over 5 seconds. The print was set up as 1.0 mV/cm and 25 mm/s. There was no delay in the monitoring waveform and printing waveform on the monitor. A simulated IV test dose was administered for 5 seconds and the ECG was printed over 5 seconds every 20 seconds for the first 2 minutes and at 5 minutes after administering the IV test dose. The size of the T-wave amplitude was measured from the average of three consecutive values based on the amplitudes shown in each printed ECG. In addition, the heart rate was measured from the average of two R-R intervals collected from three consecutive values. The heart rate measured at 3 and 4 minutes were the values on the monitor. The SBP was measured every minute for 5 minutes. In addition, the subjective symptoms of the patients were divided into the symptoms of the central nervous system, such as dizziness, nervousness, and light-headedness and the symptoms of the cardiovascular system including palpitations, chest discomfort, and hot flushes. A positive response to the IV test dose was defined as a ≥20 bpm increase in heart rate or a ≥15 mmHg increase in SBP or a ≥25% decrease in T-wave amplitude. The sensitivity, specificity, positive predictive value (PPV) and negative predictive value (NPV) were calculated from results of the response.
The data is reported as the mean ± SD, but cold test and pinprick test were indicated as the median (5th percentile, 95th percentile). Statistical analysis was performed using software SigmaStat (version 3.0, Jandel Scientific Software). The data was compared using one way ANOVA between the groups and one way repeated measured ANOVA for within a group. If there were any differences, the data was compared using the Holm-Sidak method for multiple comparisons. A P value < 0.05 was considered significant.
Results
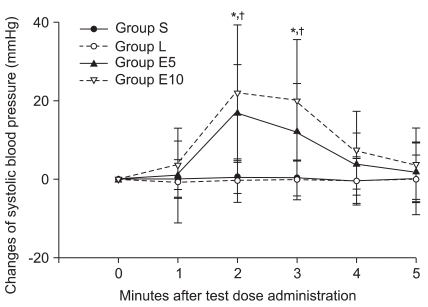
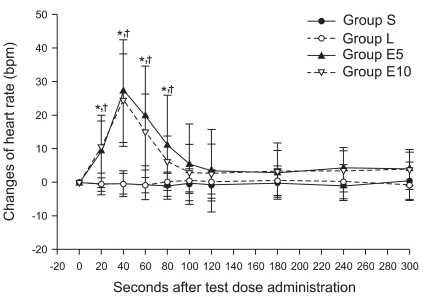
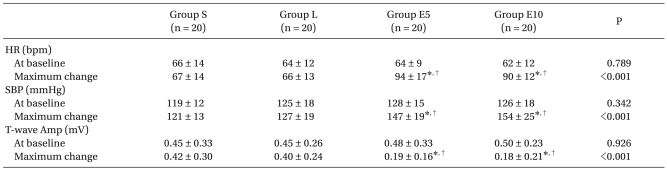
There were no differences in the baseline HR, SBP, and T-wave amplitude before administering the IV test dose between the groups (Table 2). In groups S and L, there was no change in the HR, SBP, and T-wave amplitude before and after administering the IV test dose. There was no significant difference between the two groups (Fig. 1, 2 and 3).
The IV test dose caused an increase in HR at 20-80 seconds intervals in groups E5 and E10. The maximum increases in groups E5 and E10 were 30 ± 15 bpm and 28 ± 10 bpm, respectively. There was no significant difference in the changes in HR between groups E5 and E10 (P = 0.077, Fig. 1). In addition, the SBP were increased at 2-3 min intervals after the IV test dose in groups E5 and E10. The maximum increases in groups E5 and E10 were 19 ± 12 mmHg and 28 ± 16 mmHg, respectively. There was no significant difference in the changes in SBP between groups E5 and E10 (P = 0.313, Fig. 2). The T-wave amplitude was decreased at 20-80 seconds intervals in groups E5 and E10. The maximum decreases were 0.29 ± 0.20 mV and 0.32 ± 0.24 mV respectively. The rate of the decrease was 66 ± 24% and 64 ± 34% respectively. There was no significant difference between groups E5 and E10 (Fig. 3).
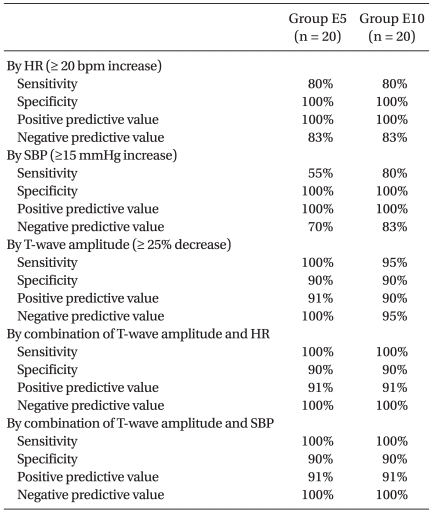
Sixteen patients each in groups E5 and E10 showed a ≥20 bpm increase in HR to the IV test doses. None of the patients in groups S and L showed a ≥20 bpm increase in HR. Eleven and 16 patients in groups E5 and E10, respectively, showed a ≥15 mmHg increase in SBP. None of the patients in groups S and L showed a ≥15 mmHg increase in SBP. Twenty, 19, 1 and 2 patients in groups E5, E10, S and L respectively, showed a ≥25% decrease in baseline T-wave amplitude. Table 3 lists the sensitivity, specificity, PPV, and NPV for the changes in the HR, SBP, and T-wave amplitude.
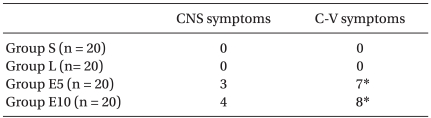
Three and 4 patients in groups E5 and E10, respectively, complained of central nervous symptoms. Eight and 7 patients in groups E5 and E10, respectively, complained cardiovascular symptoms. The most common symptom was chest discomfort followed by palpitations, dizziness, and nerve uneasiness (Table 4).
Discussion
These results showed that the index of the T-wave amplitude on ECG can be used to detect the incidental IV injection of a simulated test dose containing low dose epinephrine in spinal anesthesia.
The hemodynamic response of the epinephrine-containing test dose can be affected by several factors. The factors that may inhibit the increase in heart rate were aging [9], β-blockers [10], general anesthesia with using sevoflurane [11], and sedation using midazolam and fentanyl [12]. However, the increase in systolic blood pressure may be not suppressed. In the case of general anesthesia with isoflurane, the increase in heart rate and blood pressure can be suppressed [13, 14].
Based on these results, an index of a ≥25% decrease in T-wave amplitude was more useful and superior to the hemodynamic index. Although the sensitivity, specificity and positive and negative predictive values of the hemodynamic index were 55-100%, the index of the T-wave amplitude in groups E5 and E10 was 90-100%. Only one patient in group E10 among epinephrine-injected groups showed a ≤25% decrease in the T-wave amplitude. This patient had a positive hemodynamic index. Therefore, it is believed that we can evaluate the IV injection of the test dose more accurately if the index of a T-wave decrease is used together with the hemodynamic index.
The mechanism of the decrease in T-wave amplitude by epinephrine is unclear. However, it appears to occur by hypokalemia or the activation of β-adrenaline receptors [15-17]. Stimulation of the sympathetic nervous system causes an increase in the secretion of endogenous catecholamine, which causes a change in the T-wave amplitude [18-20].
Hypokalemia can be caused by the influx of plasma potassium into a cell after stimulation of the β-adrenaline receptors by epinephrine. However, the period of administering epinephrine in this experiment was shortened to 5 seconds and the T-wave amplitude was changed temporarily. Therefore, the change of T-wave amplitude may not be due to hypokalemia but to the stimulation of β-adrenaline receptors within the heart.
There was one patient in the saline group and 2 patients in the lidocaine group who showed a ≥25% decrease of T-wave amplitude, which has not been reported. Normally, the T-wave amplitude is decreased by epinephrine and recovered along with a regular pattern. However, there were irregular patterns of the T-wave showed in 3 patients in each measuring moments. In the case when the amplitude of the T-wave is <0.3 mV, it appears to decrease more than 25% even though it is only decreased slightly. Therefore, it is believed that the regular pattern of change will be more important than the size of the T-wave amplitude.
There were some limitations in the index of the T-wave amplitude. It is difficult to measure the change in the T-wave size in the case of showing an abnormal T-wave or small T-wave. In addition, it can be difficult to evaluate visually because most of the normal T-waves are <0.5 mV and the ECG can be altered by movement due to breathing [7]. Therefore, the T-wave needs to be observed by increasing the scale of ECG, and by printing and calculating the changes in ECG in order to apply the T-wave index. More study on the change in T-wave with monitoring instead of the printed ECG will be needed. In addition, unlike anesthesia in adults, the change in the T-wave of children is not useful as a marker for accidental intravascular injection [5].
Three and 4 patients in groups E5 and E10, respectively, complained of dizziness, nervousness, and light-headedness caused by the administration of epinephrine. Seven and 8 patients in groups E5 and E10, respectively, complained of palpitations, chest discomfort, and hot flush. In addition, 6 and 5 patients in groups E5 and E10, respectively, showed an increase in the maximum instantaneous heart rate by more than 100 bpm. In particular, there was one patient who had a >130 bpm increase. There were 3 patients in group E10 who showed an increase in systolic blood pressure to more than 180 mmHg. However, all of the changes in the index were recovered within 3 minutes. The symptoms of the central nerve system and cardiovascular system were also temporary.
There was no statistical difference in the index of decreasing T-wave amplitude between E5 and E10. Therefore, the T-wave amplitude can be changed with <5 µg of epinephrine used in the epidural test dose. However, it is believed that it will be difficult to apply in a clinical setting. It was assumed that the entire epidural test dose through the epidural catheter had been administered into blood vessels without any loss. However, it is unclear if the full epidural test dose is administered into blood vessel through an epidural catheter in a real situation. Like in this case, only epinephrine 5 µg as the epidural test dose cannot be sufficient to cause a change in the T-wave after the unintentional IV administration of epinephrine. Therefore, further studies will be needed to prove the efficacy of the T-wave amplitude in cases of <5 µg of epinephrine because the decrease in T-wave size in this study was not proportional to the dose of epinephrine.
In conclusion, the change in T-wave in spinal anesthesia may be clinically useful to detect an unintentional intravascular injection of low dose epinephrine containing an epidural test dose in CSEA. However, further studies will be needed to determine the suitable test dose of epinephrine.