Survival analysis: Part II — applied clinical data analysis
Article information
Korean J Anesthesiol 2019 October 72(5): 441-457
DOI: https://doi.org/10.4097/kja.19183
This corrects the article “Survival analysis: Part II — applied clinical data analysis” on pages 453-456.
The article by In and Lee entitled, “Survival analysis: Part II — applied clinical data analysis”, contained a wrong explanation in “R code for time-dependent coefficient Cox regression model: step function.” On page 453, the authors described the combined results from the time-dependent coefficient Cox regression model. The estimated coefficients corresponding to the segmented time periods cannot be combined; they should be interpreted as separated (Table 10). The R code described as “#Combined results” also is not a results-combining process. The function “survfit” computes estimates of a survival curve using the established survival function. That is, the following R code produces the estimates of the time-dependent coefficient Cox regression model, which is fitted before and defined in the object “fit.tdc”
R code (P454) ‒‒‒‒‒‒‒‒‒‒‒‒‒‒‒‒‒‒‒‒‒‒‒‒‒‒‒‒‒‒‒‒‒‒‒‒‒‒
cfit.tdc <- survfit(fit.tdc, newdata = combine.tdc, id = parameter)
‒‒‒‒‒‒‒‒‒‒‒‒‒‒‒‒‒‒‒‒‒‒‒‒‒‒‒‒‒‒‒‒‒‒‒‒‒‒‒‒‒‒‒‒‒‒‒‒‒‒
This R code can calculate the estimates of specific populations by providing a user-defined data frame using the argument “newdata = ”. For example, we can get the estimates of the fitted Cox regression model for Antiemetic = 0 and Inopioid = 0, and so on. The final example model of the time-dependent coefficient Cox regression has two categorical independent variables, each having two levels, and four types of populations can be defined. The provided data frame on page 453 named “combine.tdc” has the wrong code in the argument “parameter.” We have to set the four types of population, “parameter = rep(0:3, each = 3)” is right instead of “parameter = rep(0:1, each = 6).” Consequently, the figures 10 and 11B are also wrong, we present the corrected graphs below, having four types of populations. These new graphs are created using the same R code provided in the original manuscript.
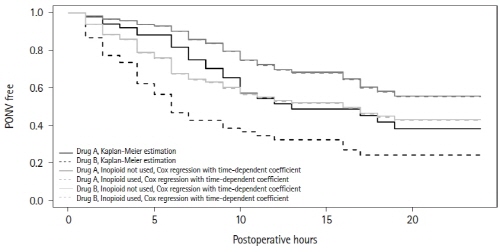
Figure 1. Corrected Figure 10. Time-dependent coefficient Cox regression curves are plotted for four types of populations.
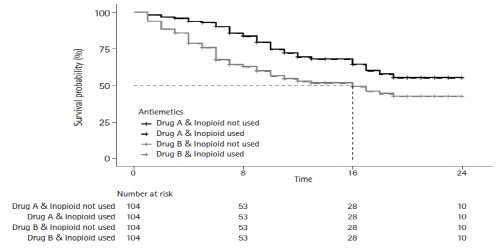
Figure 2. Corrected Figure 11B. Time-dependent coefficient Cox regression curves are plotted for four types of populations. Compared to the original figure 11B, the confidence intervals are removed to enhance the discriminability.
The authors apologize for any inconvenience these mistakes may have caused.