The optimal anesthetic depth for interventional neuroradiology: comparisons between light anesthesia and deep anesthesia
Article information
Abstract
Background
This study was designed to determine the optimal anesthetic depth for the maintenance and recovery in interventional neuroradiology.
Methods
Eighty-eight patients undergoing interventional neuroradiology were randomly allocated to light anesthesia (n = 44) or deep anesthesia (n = 44) groups based on the value of the bispectral index (BIS). Anesthesia was induced with propofol, alfentanil, and rocuronium and maintained with 1-3% sevoflurane. The concentration of sevoflurane was titrated to maintain BIS at 40-49 (deep anesthesia group) or 50-59 (light anesthesia group). Phenylephrine was used to maintain the mean arterial pressure within 20% of preinduction values. Recovery times were recorded.
Results
The light anesthesia group had a more rapid recovery to spontaneous ventilation, eye opening, extubation, and orientation (4.1 ± 2.3 vs. 5.3 ± 1.8 min, 6.9 ± 3.2 min vs. 9.1 ± 3.2 min, 8.2 ± 3.1 min vs. 10.7 ± 3.3 min, 10.0 ± 3.9 min vs. 12.9 ± 5.5 min, all P < 0.01) compared to the deep anesthesia group. The use of phenylephrine was significantly increased in the deep anesthesia group (768 ± 184 vs. 320 ± 82 µg, P < 0.01). More patients moved during the procedure in the light anesthesia group (6/44 [14%] vs. 0/44 [0%], P = 0.026).
Conclusions
BIS values between 50 and 59 for interventional neuroradiology were associated with a more rapid recovery and favorable hemodynamic response, but also with more patient movement. We suggest that maintaining BIS values between 40 and 49 is preferable for the prevention of patient movement during anesthesia for interventional neuroradiology.
Introduction
Interventional neuroradiology (INR) is a rapidly expanding field of medicine in the treatment of cerebrovascular diseases due to its efficacy and simplicity compared to neurosurgery [1,2]. Performing INR under general anesthesia keeps patient immobile and therefore can improve the quality of images. It also reduces patient mortality and morbidity [3]. Thus, many interventionists are performing INR under general anesthesia. Neuroradiologic procedures can result in serious complications, such as vascular perforation or vasospasm, so an anesthesiologist should not only monitor the patient's vital signs and prevent movement during the procedure, but also manage these possible complications instantly.
Most neuroradiological procedures are not accompanied by pain, except for the case of vessel distention or contrast injection. Thus, accurate management of anesthetic depth is of paramount importance because the excessive use of anesthetic drugs beyond what is needed for the procedure can cause hemodynamic instability and delay recovery from anesthesia, but the insufficient use of anesthetic agents can result in patient movement during the procedure.
The bispectral index (BIS) correlates well with the anesthetic concentration of sevoflurane [4], propofol, and midazolam [5]. Monitoring the BIS during surgery can reduce anesthetic drug usage during anesthesia and promote faster recovery from anesthesia [6]. It is generally recommended that anesthetic agents be titrated to maintain the BIS between 40 and 60 during general anesthesia. We considered this range of BIS values too wide for anesthesia for INR because the procedure provides a fairly uniform stimulus with less pain compared to other surgical procedures performed under general anesthesia.
This study was designed to determine the optimal anesthetic depth for INR. We divided the generally accepted BIS value range into light (BIS 50-59) and deep (BIS 40-49) ranges and investigated the differences in vital signs, recovery time, and incidence of patient movement between the two groups.
Materials and Methods
After receiving approval from the Institutional Review Board of our hospital and obtaining written informed consent, we prospectively studied 88 patients (American Society of Anesthesiologists physical status I-III, aged 18-65 years) scheduled for elective interventional neuroradiology for unruptured aneurysm coiling. Exclusion criteria included a history of neurologic disease, concurrent use of sedative medication, alcohol or substance abuse, and abnormal kidney or liver function. Patients were assigned to one of two groups using a block randomization technique. After randomization was determined using random number tables, the assignments were concealed in sealed envelopes until immediately before induction.
During the procedure, electrocardiography, noninvasive blood pressure, pulse oximetry, and capnography were monitored. We measured the heart rate, peripheral arterial hemoglobin oxygen saturation, and mean arterial pressure. BIS was monitored during the procedure. The BIS monitoring device used for this study was the BIS VISTA™ monitoring system (Aspect Medical Systems Inc., Norwood, MA, USA), and the smoothing rate was 15 seconds.
Midazolam, 0.03 mg/kg, was administered intravenously 15 minutes before induction. Normal saline, 7 ml/kg, was injected intravenously before the induction of anesthesia. Anesthesia was induced with propofol, 1.5 mg/kg, and alfentanil, 5 µg/kg. Rocuronium, 0.6 mg/kg, was administered to facilitate orotracheal intubation. Anesthesia was maintained with 1-3% sevoflurane. The concentration of sevoflurane was titrated to maintain BIS at 40-49 (deep anesthesia group) or 50-59 (light anesthesia group). End-tidal CO2 value was maintained between 30 and 35 mmHg. During the maintenance period, rocuronium, 0.2 mg/kg/hr, was used to maintain less than one twitch response to trainof-four stimuli. If there was more than one twitch response to train-of-four stimuli, 5 mg of rocuronium was administered intravenously. During maintenance, all patients were assessed for signs of inadequate anesthesia or profound anesthesia. Inadequate anesthesia was defined as hypertension, tachycardia, or patient movement. If the intraoperative mean arterial pressure was lower than 20% of the pre-induction value, continuous infusion of phenylephrine was started. If the patient moved, 5 mg of rocuronium was administered intravenously. Patient movement was defined as any sign of gross muscle movement or muscle twitching detectable by the interventionist or the anesthesiologist.
Rocuronium infusion was stopped at the completion of the main procedure. Any residual neuromuscular block was reversed with 1.5 mg neostigmine and 0.4 mg glycopyrrolate. After reversal of the neuromuscular block, the inhalation anesthetics were discontinued, and the lungs were ventilated with 100% O2. If the patient could maintain a firm handgrip or lift a limb with sufficient muscle power voluntarily or by verbal command, the endotracheal tube was removed. The following recovery times were evaluated at 1 minute intervals after discontinuation of muscle relaxants and volatile anesthetics by a nurse who was blind to the maintenance of anesthesia: time to return of spontaneous ventilation, time to eye opening, time to extubation, and time to orientation. The time to eye opening was measured when the patients could open their eyes voluntarily or by verbal command. The time to orientation was recorded when the patients could state one's name clearly when asked by the anesthesiologist. Phenylephrine dosage was recorded.
Statistical analysis
Statistical analysis was performed using SPSS 18.0 software for Windows (SPSS Inc., Chicago, IL, USA). The study was powered to detect a 2 minute difference in the awakening times between the groups. Using a group standard deviation of 3 minutes, which was derived from pilot data, with a 0.05 level of significance and a power of 0.8, we determined that 44 patients per group were required. Demographic data was compared using Student's t-test. Recovery times and dose of phenylephrine were analyzed using the Wilcoxon rank-sum test. Sex ratio and patient movements were compared using a chi-square analysis or Fisher's exact test. All statistical tests were two-tailed, and a P value < 0.05 was considered to indicate statistical significance.
Results
We found no difference of sex, age, height, weight, or duration of surgery or anesthesia between the groups (Table 1). The deep anesthesia group received more phenylephrine than the light anesthesia group (768 ± 184 vs. 320 ± 82 µg, P < 0.01). More patients of the light anesthesia group moved during the procedures (6/44 [14%] vs. 0/44 [0%], P = 0.026). All six patients that moved during the procedure showed visible gross muscle movement that was detected by the interventionist. The endtidal concentration of sevoflurane was maintained at 0.9-1.2% in the light anesthesia group and 0.9-2% in the deep anesthesia group. The end-tidal concentration of sevoflurane was continuously adjusted to achieve the targeted BIS value. No adverse events occurred among the patients who moved. The time of spontaneous ventilation, eye opening, extubation, and recovery of orientation were all shorter in the light anesthesia than in the deep anesthesia group (all P < 0.01, Table 2).
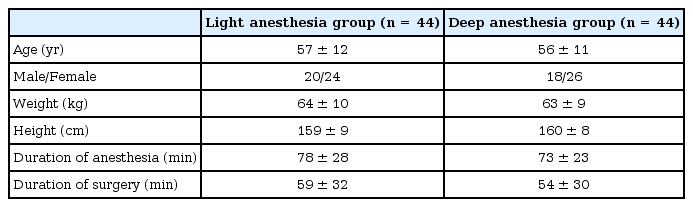
Patient Characteristics

Recovery Time (min)
Discussion
In this study, we found that patients allocated to the light anesthesia group were associated with a more rapid recovery than the patients of the deep anesthesia group. A smaller amount of vasopressor was used in the light anesthesia group. However, more patient in the light anesthesia group moved during the procedure. These results suggest that increasing the depth of anesthesia may effectively prevent movement during procedures. Performing INR under general anesthesia is carried out to improve image quality and shorten the procedure time, and also to prevent patient movement and serious complications. Therefore, despite many advantages, maintaining BIS value 50-59 during INR seems unsuitable due to the resultant patient movement.
The optimal depth of general anesthesia for INR should be enough to prevent patient movement, but should also be able to maintain a stable hemodynamic profile and achieve rapid recovery. It is particularly difficult for anesthesiologists to titrate the appropriate anesthetic depth during INR because the surgical stimulus and pain is rather minor compared to other surgical procedures. However, patient movement should be avoided throughout the procedure. Insufficient use of anesthetic agents may result in awareness or patient movement. On the other hand, the excessive use of anesthetic agents may be associated with other problems, such as increased cardiovascular complications, and postoperative morbidity and mortality. It is suggested that cumulative deep hypnotic time (BIS < 45) and intraoperative hypotension are associated with increased postoperative mortality during the first year after non-cardiac surgery [7].
Generally, BIS values 40-60 indicate an adequate consciousness level during general anesthesia, reflected by the absence of alertness, response to command, and recall. We believe this range is too wide for anesthesia during INR, and we assumed that maintaining BIS value 50-59 would be preferable to 40-49. However, our study results show that the light anesthesia group was associated with a higher incidence of movement during the procedures. Six patients of the light anesthesia group showed movement during the procedure, showing an even higher incidence of movement compared to our clinical experiences. Most of the patient movement was reported by the interventionist. As mentioned above, prevention of movement is of great importance during aneurysm coiling in order to prevent perforation. Large doses of muscle relaxants may prevent patient movement, but it also produces long lasting muscle paralysis and delayed patient recovery.
Several studies have found that BIS can be a useful predictor of patient movement in response to skin incisions during anesthesia with isoflurane [8] or propofol-nitrous oxide anesthesia [9,10]. But another study also suggested that EEG BIS, which is a form of cortical function monitoring, may not be reliable for predicting the responsiveness to noxious stimuli mediated by subcortical structures [11]. In our study, patient movement was associated with the depth of anesthesia, reflected by the BIS value. Inhalation anesthetics relax smooth muscle of the cerebral vasculature [12]. We assumed that in the patients of the deep anesthesia group, in which relatively higher doses of sevoflurane were used compared to the light anesthesia group, cerebrovascular smooth muscle would have been relaxed to a more profound degree.
In this study, we used BIS value as an index of anesthetic depth. Other parameters can also be used, but there are certain shortcomings. End-tidal concentrations of volatile anesthetics can be used as a predictor of patient response during surgery, but it is rarely used solely. Furthermore, the minimum alveolar concentration of volatile agents decreases with age, so predictions of responses using end-tidal concentrations of volatile agents can be complicated [13,14]. Other parameters such as hemodynamic variables, such as mean arterial pressure, can be used as an index of the depth of anesthesia [15]. However, many factors other than anesthetic depth contribute to mean arterial pressure [16], and it usually does not correlate well [16]. Therefore, BIS is thought to be a better predictor of patient response [17].
One limitation of our study is that the BIS value indicated on the monitor may not be the real-time indicator of the patient's alertness. A certain amount of time is needed to process the patient's EEG, calculate the BIS, and display it on the monitor. This time lag differs between manufacturers, but ranges from 14 to 155 seconds [18]. Therefore, in some cases, even after prompt actions are taken as soon as the BIS value increases, patient movement cannot be anticipated and prevented. Moreover, in many centers, the patient and the anesthesiologists are separated in different rooms during INR, so taking prompt action is difficult. So, from a clinical perspective, maintaining light anesthesia with BIS monitoring can make it difficult to prevent patient movement.
Previous studies have compared the speed of recovery from INR after the maintenance of anesthesia with inhalation anesthetics or propofol [19,20,21]. Sevoflurane was associated with a more rapid recovery than propofol, whereas isoflurane and propofol were associated with similar recovery times [20,21]. The differences in the distribution of recovery times are statistically significant, but the clinical significance is less clear. Recovery times of groups differed minimally, around 1-3 minutes. The recovery times from light anesthesia were similar to those in a previous study using sevoflurane and nitrous oxide for interventional neuroradiology [19].
In summary, maintaining BIS 50-59 was associated with some favorable outcomes, such as rapid recovery time and less hemodynamic changes, but was also with unfavorable consequences like patient movement during the procedure. We conclude that BIS 50-59 is associated with more patient movement compared to BIS 40-49, so more caution should be taken when maintaining BIS 50-59 in interventional neuroradiology. We suggest that maintaining BIS 40-49 is preferable for the prevention of patient movement during anesthesia for interventional neuroradiology.