Effect of ultrafiltration on whole blood coagulation profile during cardiopulmonary bypass in cardiac surgery: a retrospective analysis
Article information

Abstract
Background
Ultrafiltration (UF) would enhance coagulation profiles by concentrating coagulation elements during cardiopulmonary bypass (CPB) for cardiac surgery.
Methods
We retrospectively reviewed electronic medical records of 75 patients who had undergone cardiac surgery with rotational thromboelastometry-based coagulation management in a university hospital and analyzed the UF-induced changes in the maximum clot firmness (MCF) of extrinsically activated test with tissue factor (EXTEM) during CPB in 30 patients.
Results
The median volume of filtered-free water was 1,350 ml, and median hematocrit was significantly increased from 22.5% to 25.5%. As the primary measure, UF significantly increased the median MCF-EXTEM from 48.0 mm to 50.5 mm (P = 0.015, effect size r = 0.44). The area under the receiver operating characteristic curve pre-UF MCF-EXTEM for discrimination of any increase of MCF-EXTEM after applying UF was 0.89 (95% CI [0.77, 1.00], P < 0.001), and its cut-off value was 50.5 mm (specificity of 81.8% and sensitivity of 84.2% in Youden’s J statistic). In the secondary analyses using the cut-off value, UF significantly increased the median MCF-EXTEM from 40.5 mm to 42.5 mm in 18 patients with pre-UF MCF-EXTEM ≤ 50.5 mm. However, it did not increase MCF-EXTEM in 12 patients with pre-UF MCF-EXTEM > 50.5 mm. There was a significant interaction between pre-UF MCF-EXTEM values and applying UF (P < 0.001 for the subgroup, P = 0.046 for UF, P = 0.003 for interaction).
Conclusions
Applying UF improved clot firmness, and the improvement was more pronounced when pre-UF MCF-EXTEM had been reduced during CPB.
Introduction
In cardiac surgery, intravenous (IV) priming fluids to the cardiopulmonary bypass (CPB) circuit and reservoir dilute all blood components. CPB-induced hemodilution can affect the overall coagulation performance and increase post-CPB bleeding [1].
Near the end of the CPB, ultrafiltration (UF) removes excessive free water from the patients and attenuates CPB-induced hemodilution. Applying UF has been regarded as effective in increasing hematocrit (Hct) and reducing red blood cell (RBC) transfusion [2,3]. As in pediatric cardiac surgery [4], UF may concentrate procoagulants and improve overall coagulation performance in adult cardiac surgery. However, in previous studies in adults, UF’s impacts on coagulation performance were inconsistent [3–5]. As UF concentrates all blood components, including procoagulants and anticoagulants, UF’s overall impact would be determined by the net balance of their concentrations.
Rotational thromboelastometry (ROTEM), a point-of-care viscoelastic test, has been used to analyze the coagulation performance of whole blood in various clinical settings, even during CPB [6]. While multiple ROTEM assays could specify the lack of each procoagulant, such as clotting factors, fibrinogen, and platelets, the maximum clot firmness (MCF) of extrinsically-activated test with tissue factor (EXTEM) depicts clot strength with the combined contribution of platelets and fibrinogen [7].
We assumed that the possible changes of MCF-EXTEM after applying UF would indicate the overall impact of UF on the coagulation profile in patients undergoing cardiac surgery with CPB.
Therefore, we reviewed the electronic medical records (EMR) of cardiac surgery patients undergoing UF during CPB in a tertiary university hospital. We retrospectively analyzed the changes in MCF-EXTEM values before and after applying UF in these patients. The primary objective of our study was to determine whether applying UF affects MCF-EXTEM.
Materials and Methods
We retrospectively analyzed the EMR of 75 patients who underwent adult cardiac valve surgery in a tertiary university hospital (Konkuk University Medical Center) from 2019 to 2021. The Institutional Review Board approved the study (Institutional Review Board of Konkuk University Medical Center, IRB No: 2022-02-027). This study was registered on clinicaltrials.gov (NCT05252559). The following eligibility criteria were employed: patients older than 19 years, getting moderate hypothermic CPB, and getting UF at the end of CPB. Patients with the following criteria were excluded: Re-do or Tri-do surgery, infective endocarditis, aortic dissection, packed RBC transfusion of more than three units during CPB, lacking EXTEM and fibrin-based extrinsically activated test with tissue factor and the platelet inhibitor cytochalasin D (FIBTEM) assay data before and after applying UF, and the filtered-free water volume of < 250 ml.
Anesthesia induction, maintenance, and CPB
Electrocardiogram, bispectral index, and pulse oximetry were applied upon the patient’s arrival in the operation room. A 20-22 G catheter was placed in the radial or femoral artery for monitoring invasive blood pressure (BP). Anesthesia was maintained with sevoflurane or propofol-remifentanil-rocuronium infusions. Central venous pressure, pulmonary arterial pressure, cardiac index (CI), mixed venous O2 saturation (Vigilance IITM monitor, Edwards), and cerebral O2 saturation (INVOSTM 5100C Regional Oximeter, Medtronic) were monitored. Before and after applying CPB, O2 and medical air (FiO2 0.4‒0.6) were ventilated to maintain normocapnia. Intraoperative transesophageal echocardiogram (TEE) was performed according to the institutional protocol. Acetate-buffered balanced crystalloid solutions and phenylephrine were infused to maintain the mean BP of 80%‒120% of the pre-induction value. The main surgical procedure was performed under CPB with moderate hypothermia (28‒29°C). The CPB pump was primed with 1,500 to 1,700 ml of acetate-buffered balanced crystalloid, 100 ml of 20% mannitol, and 100 ml of 20% albumin. A single aortic and two venous cannulas were placed in the aorta and right atrium for CPB. Unfractionated heparin 300 IU/kg was administered for initiating anticoagulation during CPB, and additional dosages were issued under the monitoring of activated coagulation time (ACT). The ACT was maintained at above 400 s before the initiation and during the maintenance of CPB.
CPB was conducted with a non-pulsatile centrifugal pump, polyvinyl chloride tubing, and a membrane oxygenator with hollow polypropylene fibers. The pump flow rate was adjusted to 2.0 to 2.5 L/min/m2 to maintain a mean BP (MBP) of 55 to 70 mmHg. During CPB, continuous positive airway pressure of 5‒7 mmHg was applied to the patient’s lung, and the α-stat strategy managed PaCO2. After cross-clamping the aorta, the cold, bloodless crystalloid cardioplegic solution was administered through antegrade and/or retrograde coronary perfusion, repeated every 30 min.
UF was started during rewarming, with a flow rate of 200 ml/min/m2 through a hemoconcentration with tubing and adaptor set (Hemocor HPHTM, Medivatos Inc.), placed in the inlet connected to the arterial line and the outlet connected to the venous line, and continued until the almost end of CPB.
CPB was weaned with or without inotropic support when the core temperature reached 36°C. The same ventilation strategy applied during the pre-CPB period was restored during the post-CPB period. Intraoperative fluid management was performed upon TEE monitoring. Dobutamine, epinephrine, or milrinone was infused as a first-line inotropic agent for weaning from CPB, as needed. Its infusion rate was adjusted and supplemented with norepinephrine infusion to achieve a CI of > 2.0 L/min/m2 and MBP of > 65 mmHg.
Intraoperative bleeding from the surgical site was salvaged and returned to the patients using a sucker and a cell saver system during the entire surgical procedure. Especially after completing UF and weaning from CPB, the residual blood in the CPB circuit and reservoir underwent the cell saver process and was washed and reinfused to the patients.
The threshold for transfusion of packed RBCs was a Hct of < 18%‒21% or the decline of rSO2 > 20% during the CPB period and a Hct of < 24%–28% or rSO2 decline > 20% during the post-CPB period, respectively. Protamine 3 mg/kg was administered to neutralize the heparin effect after weaning from CPB.
Fresh frozen plasma, fibrinogen concentrate, cryoprecipitate, or platelets were administered upon ROTEM analyses, indicating coagulation dysfunction with ongoing bleeding. After surgery, patients were transferred to the intensive care unit and managed according to institutional protocols.
ROTEM analyses and data acquisition
In all patients, an arterial blood sample of 1 ml underwent routine ROTEM assays (ROTEM® sigma, TEM Innovations) consisting of EXTEM and FIBTEM at the following time points: immediately after anesthesia induction (pre-CPB), immediately before applying UF (pre-UF), immediately after completing UF (post-UF), and after CPB-weaning and protamine neutralization (post-CPB).
For the present study, the changes in the clotting time of EXTEM (CT-EXTEM), clot formation time of EXTEM (CFT-EXTEM), MCF-EXTEM, and clot amplitude at 5 min and maximum clot formation in FIBTEM (A5-FIBTEM and MCF-FIBTEM), and lysis index at 30 min of EXTEM (LI30-EXTEM) were analyzed. The changes of PLTEM, which is to estimate platelet count (calculated by EXTEM − FIBTEM), and MCF -PLTEM were also analyzed.
Study objectives
The primary objective of this study is to ascertain the impact of UF on MCF-EXTEM in patients undergoing cardiac surgery with CPB. The secondary objective of this study is to figure out the relationship between the positive MCF-EXTEM response and the application of UF in these patients. The positive response was defined as any elevation in MCF-EXTEM following the application of UF compared to pre-UF MCF-EXTEM values.
Statistical analysis
Results were expressed as mean ± standard deviation (SD), median (Q1, Q3), or number (%) according to the data type. Statistical analysis was performed using R version 4.2.1TM (R Development Core Team, 2022).
Before statistical analysis, normality was checked for the continuous variables with a visual check of Q-Q plots and histograms. Comparative analysis was done using nonparametric statistical methods, such as the Wilcoxon signed-rank test. Results included P values and effect size r. Kendall’s tau-b was applied to figure out the relationship between the amount of filtered-free water and the UF-induced changes in Hct and ROTEM parameter values. A two-sided P value below 0.05 was considered statistically significant.
We performed a Wilcoxon signed-rank test to compare the values of MCF-EXTEM before and after applying UF as the study’s primary objective. Additionally, we conducted a receiver-operator curve (ROC) analysis to evaluate the discrimination ability toward positive MCF-EXTEM response by applying UF as the secondary measure. The area under the receiver operating curve (AUROC) and a 95% CI were estimated with the DeLong algorithm and R package pROC [8]. The optimal cut-off value of pre-UF MCF-EXTEM to the positive response was estimated with Youden’s J statistic. To elucidate the relationship between pre-UF MCF-EXTEM and UF application, we divided all patients into two subgroups according to the estimated cut-off value of pre-UF MCF-EXTEM (more than and less than or equal to the cut-off value). We performed a comparative analysis to determine whether UF affected CFT-EXTEM and others, such as CT-EXTEM, A5-FIBTEM, MCF-FIBTEM, MCF-PLTEM, and LI30-EXTEM, in each subgroup. To investigate the interaction between the grouping by pre-UF MCF-EXTEM values and the UF effect simultaneously, non-parametric repeated measured Analysis of variance (ANOVA) with one repeated factor and one between factor analysis (F1-LD-F1 model) was applied (R package ‘nparLD’) [9]. ANOVA-type statistics were used for all tests. As a measure of relative effect, we used the relative treatment effect (RTE). The RTE means effect measurement that can be interpreted as follows: an RTE of 0.5 represents no effect; an RTE greater than 0.5 indicates a tendency for subjects in a subgroup to generally have higher scores compared to the average individual within the whole sample; an RTE value of 0.7 for a subgroup means that there is a 70% estimated probability that a randomly chosen individual from this subset will have a higher score than a randomly selected individual from the entire dataset; and conversely, an RTE of 0.2 for a subgroup means a 20% estimated probability that a randomly chosen individual from the whole dataset will have a lower score than a randomly selected individual from this subset. Additionally, in the two subgroups, the median difference and corresponding quartiles between pre-UF MCF-EXTEM and post-UF MCF-EXTEM were estimated by bootstrap with a resampling number of 3000.
Results
Out of the EMR data of 75 eligible patients, those of 45 patients were excluded due to the exclusion criteria. Finally, we included the EMR data of 30 patients for the statistical analysis (Fig. 1).
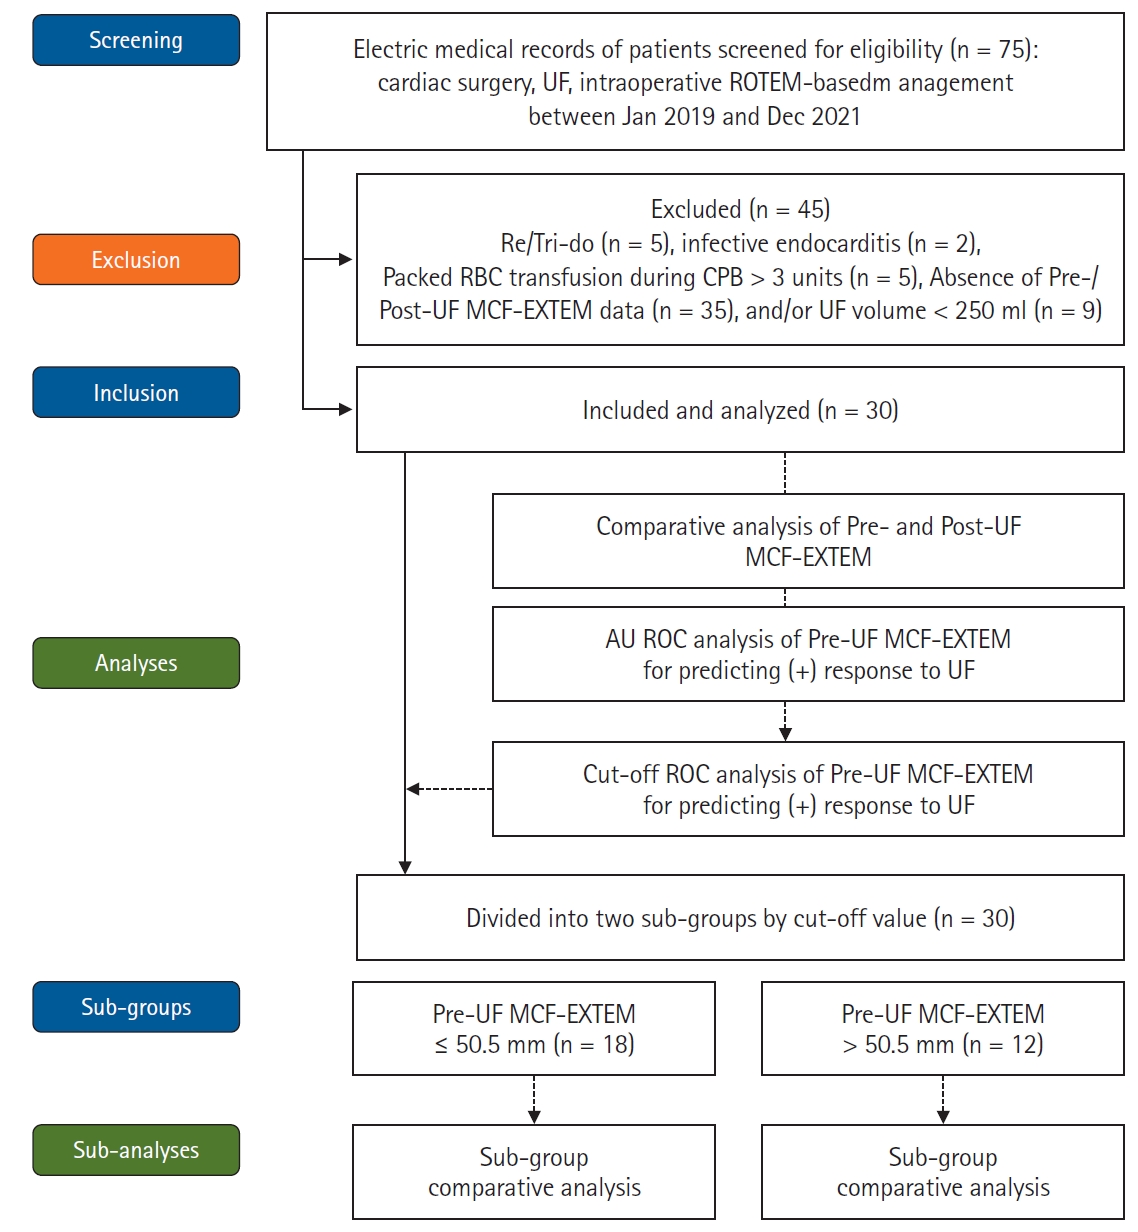
Schema of data collection and analyses. UF: ultrafiltration, ROTEM: rotational thromboelastometry, Packed RBC: packed red blood cell, CPB: cardiopulmonary bypass, Pre-UF: immediately before applying UF, Post-UF: immediately after applying UF, MCF-EXTEM: maximum clot firmness of EXTEM, AUROC: area under the receiver operating curve, EXTEM: extrinsically-activated test with tissue factor.
Detailed demographic data and information on transfusion are described in Table 1. The mean CPB duration was 206 min, and the median volume of filtered free water (Q1, Q3) was 1,350 (1,200‒1,925) ml. By applying UF, median Hct values were significantly increased from 22.5% to 25.5% (P < 0.001, Table 2).
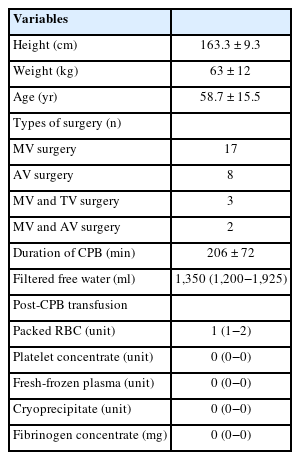
Demographic Data

The Changes of Hct and ROTEM Parameters after Anesthesia Induction, before and after Applying UF, and after Weaning from CPB and Protamine Neutralization (n = 30)
As the primary outcome of our study, UF significantly increased median MCF-EXTEM (Q1, Q3), and its change was moderately affected by UF (48.0 [38.8, 54.0] mm for pre-UF, 50.5 [40.0, 56.0] mm for post-UF, P = 0.015, effect size r = 0.44). UF did not significantly change CT-EXTEM, CFT-EXTEM, A5-FIBTEM, MCF-FIBTEM, MCF-PLTEM, and LI30-EXTEM (Table 2). However, no significant correlation existed between the amount of filtered-free water and the changes in ROTEM parameters, even MCF-EXTEM (Supplementary Table 1).
The estimated AUROC of discriminating the positive response of the pre-UF MCF-EXTEM by the application of UF was 0.89 (95% CI [0.77, 1.00], P < 0.001). In the ROC analysis, the estimated cut-off value of pre-UF MCF-EXTEM to discriminate the positive response to applying UF was 50.5 mm, with a sensitivity of 84.2% and a specificity of 81.8% (Fig. 2A).

The estimation of a positive response of MCF-EXTEM to applying UF and sub-group analyses of actual MCF-EXTEM changes employing the estimated cut-off values. A positive response was defined as any increase of MCF-EXTEM after applying UF. (A) The receiver operating characteristic analysis of the changes in MCF-EXTEM speculated that the estimated AUROC to discriminate a significant increase in MCF-EXTEM to applying UF was 0.89 (95% CI [0.77, 1.00], P < 0.001). The estimated cut-off value of pre-UF MCF-EXTEM to predict the positive response was 50.5 mm, with a sensitivity of 84.2% and a specificity of 81.8%. (B) Analyses employing the cut-off value, UF significantly increased MCF-EXTEM (40.5 [33.8, 45.8] mm vs. 42.5 [38.5, 53.0] mm) when pre-UF MCF-EXTEM was reduced (≤ 50.5 mm, n = 18/30), and UF did not affect MCF-EXTEM when pre-UF MCF-EXTEM was maintained (> 50.5 mm, n = 12 / 30; P < 0.001 for the between-groups, P = 0.046 for UF, P = 0.003 for interaction). EXTEM: extrinsically-activated test with tissue factor, MCF-EXTEM: maximum clot firmness of EXTEM, UF: ultrafiltration, Pre-UF: immediately before applying UF, Post-UF: immediately after applying UF, AUROC: area under the receiver operating curve.
As the secondary outcome of this study, pre- and post-UF MCF-EXTEM values in patients with pre-UF MCF-EXTEM ≤ 50.5 mm (n = 18) were 40.5 (33.8, 45.8) mm and 42.5 (38.5, 53.0) mm, respectively (estimated median difference and quartiles = 2.0 [0.0, 5.0] mm). For the patients of pre-UF MCF-EXTEM > 50.5 mm (n = 12), the pre- and post-UF MCF-EXTEM values were 57.5 (52.8, 60.3) mm and 56.0 (51.0, 48.8) mm, respectively (estimated median difference and quartiles = −1.0 [−2.5, 2.0] mm). UF had a significant effect on the changes of Hct and MCF-EXTEM, and its effect had an interaction with subgroups (Hct: P = 0.031 for the subgroup, P < 0.001 for UF, P = 0.032 for interaction; MCF-EXTEM: P < 0.001 for the subgroup, P = 0.046 for UF, P = 0.003 for interaction, Fig. 2B). CT-EXTEM was not changed by applying UF. CFT-EXTEM, A5-FIBTEM, MCF-FIBTEM, and MCF-PLTEM represented a significant difference between the subgroups, and it was not revealed in the interaction with applying UF statistically (Table 3).
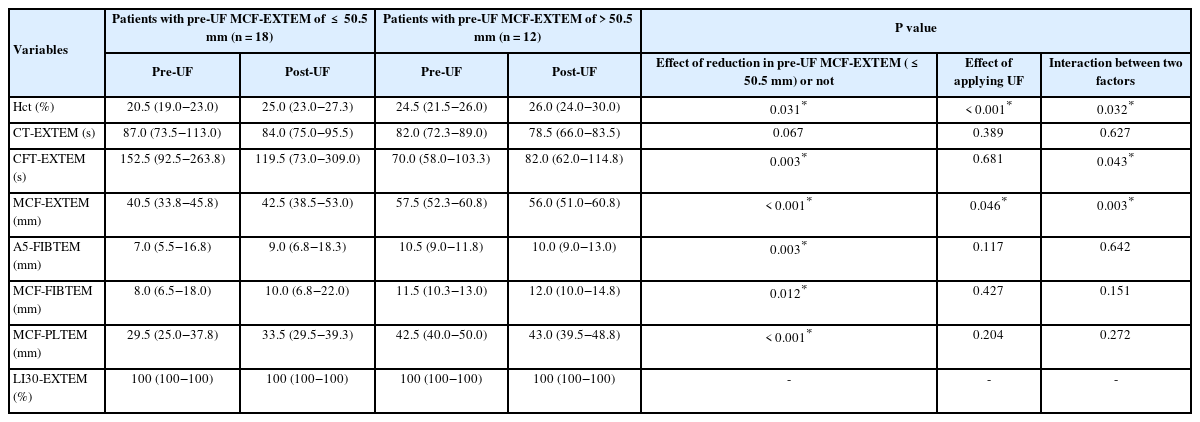
The Changes of ROTEM Values Following UF Application according to Pre-UF MCF-EXTEM Value Categories
The RTE of applying UF (pre- vs. post-UF) and the reduction of pre-UF MCF-EXTEM (≤ 50.5 mm vs. > 50.5 mm) on Hct and ROTEM parameter values are illustrated in Fig. 3 and presented in Supplementary Table 2. The RTE of pre-UF MCF-EXTEM ≤ 50.5 mm increased from 0.26 to 0.39 following the application of UF. Meanwhile, the RTE of pre-UF MCF-EXTEM > 50.5 mm remained unchanged, shifting only marginally from 0.77 to 0.75 after UF.
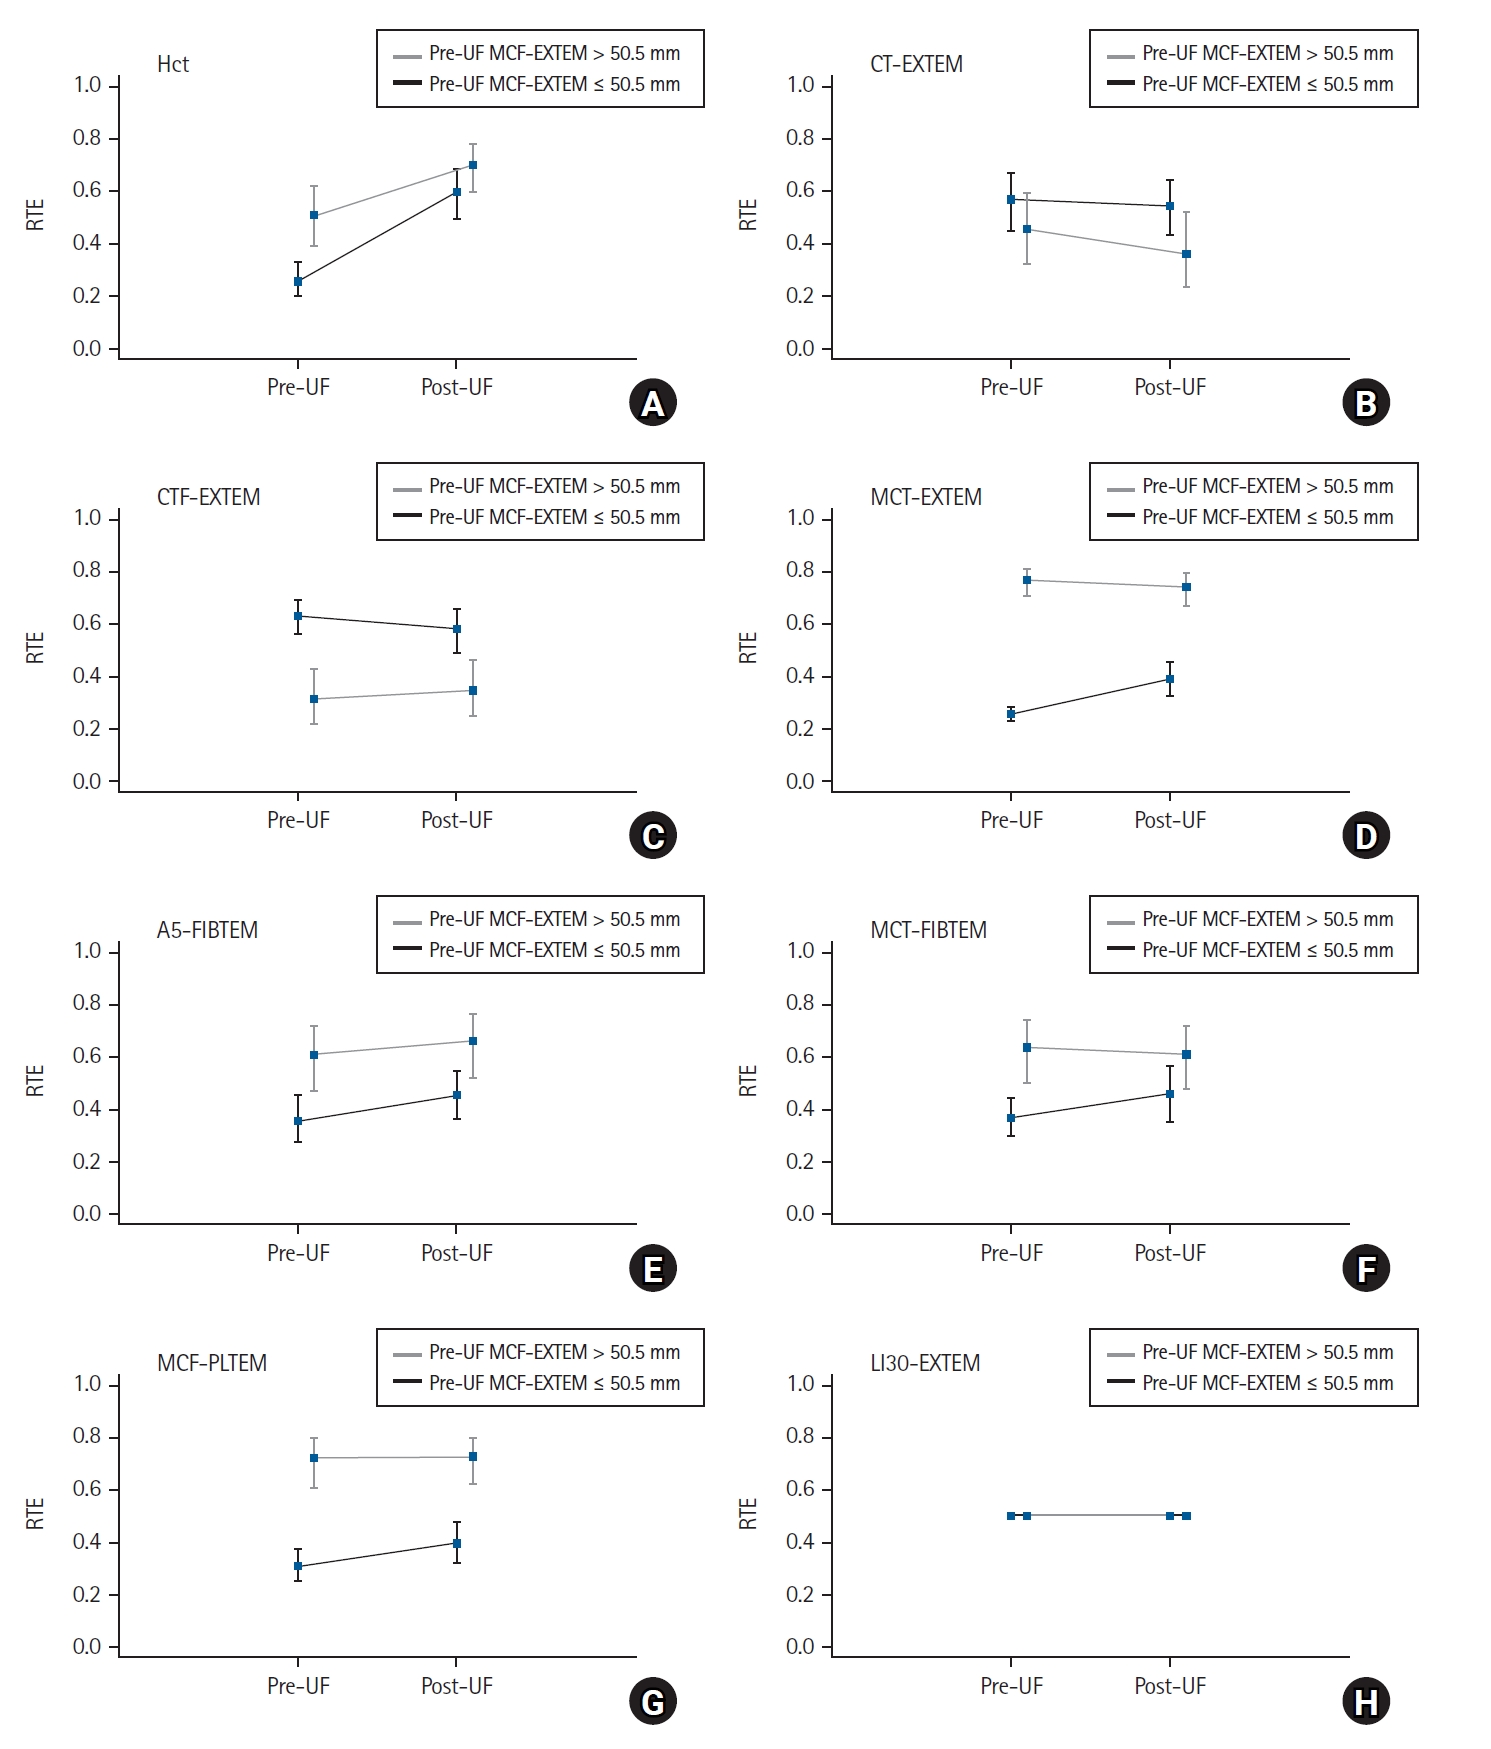
The RTE of non-parametric repeated measures ANOVA with one repeated and one between factors (F1-LD-F1 model) for analyses employing the cut-off value. The black line indicates the subgroup of pre-UF MCF-EXTEM ≤ 50.5 mm (n = 18), the grey line indicates the subgroup of pre-UF MCF-EXTEM > 50.5 mm (n = 12). The dots and bars indicate RTE values and their 95% CI. RTE: relative treatment effect, ANOVA: Analysis of variance, Hct: hematocrit, UF: ultrafiltration, Pre-UF: immediately before applying UF, Post-UF: immediately after applying UF, EXTEM: extrinsically-activated test with tissue factor, FIBTEM: fibrin-based extrinsically activated test with tissue factor and the platelet inhibitor cytochalasin D, PLTEM: calculated value for estimating platelet contribution (PLTEM = EXTEM – FIBTEM), MCF-EXTEM: maximum clot firmness of EXTEM, CT-EXTEM: clotting time of EXTEM, CFT-EXTEM: clot formation time of EXTEM, A5-FIBTEM and MCF-FIBTEM: clot amplitude at 5 min after clot initiation and MCF in FIBTEM, MCF-PLTEM: calculated value for estimating platelet contribution (= MCF-EXTEM – MCF-FIBTEM), and LI-30 EXTEM: lysis index at 30 min of EXTEM.
Discussion
As the primary objective, applying UF significantly increased MCF-EXTEM at the end of CPB for cardiac surgery. MCF-EXTEM depicts the degree of clot firmness that was the contribution of platelet and fibrinogen [7]. The observed change in MCF-EXTEM was approximately 2.5 mm, but it would be clinically relevant in affecting the decision-making for coagulation management. Furthermore, in the analyses employing the cut-off value of ROC, applying UF increased MCF-EXTEM in patients with reduced pre-UF MCF-EXTEM value, while it did not in patients with sustained pre-UF MCF-EXTEM value.
Without a doubt, UF would concentrate all blood components, including RBCs, fibrinogen, platelets, and clotting factors. However, our study showed that, despite the significant MCF-EXTEM increase, UF could not demonstrate substantial increases of CT-EXTEM, MCF-FIBTEM, and MCF-PLTEM, depicting the specific contributions of clotting factors, fibrinogen, and platelets, respectively.
As aforementioned, the apparent increase in MCF-EXTEM is due to the combined effect of increased platelet and fibrinogen levels. However, unless the degree of fibrinogen or platelet dilution reaches a certain level, even an intense degree of UF-induced fibrinogen or platelet concentration will not increase MCF-FIBTEM or MCF-PLTEM values. Our results with the increased MCF-PLTEM and MCF-EXTEM without changes in MCF-FIBTEM agreed with a previous study in which the impact of UF on platelet level might be more significant than that of fibrinogen or other pro-coagulations [1]. However, other studies showed that the impacts of UF on platelet function in cardiac surgery are variable [3,10]. Even modified UF, increasing Hct from 28% to 36%, could not increase platelet count and enhance aggregation in pediatric cardiac surgery [11].
Not only UF-induced hemoconcentration but also CPB-induced hemodilution affect fibrinogen and platelet levels, the key factors of optimal clot formation and polymerization [12–14] and post-CPB coagulation management [7,15]. Therefore, the direct effects of CPB-induced hemodilution on all blood elements may have to be considered for interpreting our results regarding UF-induced change. The degree of diluting each element or compromising the element’s activity seems proportional to the extent of hemodilution or infused IV fluid [16,17]. However, still, dilution thresholds for inducing an apparent change in each element’s activity were variable [18].
In our study, CPB induced 30%‒40% hemodilution, reducing Hct from 34.0% to 22.5%. The reduced pre-UF amplitudes of all EXTEM, PLTEM, and FIBTEM tracings confirmed that this CPB-induced hemodilution reduced fibrinogen and platelet levels [19]. The A5-FIBTEM value was reduced to 9.0 mm, comparable to the 100‒125 mg/dl fibrinogen level [13,14]. However, a previous study showed that, even in an intense CPB-hemodilution, platelet level was well maintained, presumably due to the sequestered platelets from the spleen and lungs [20].
Applying CPB itself also alters the fibrinogen/fibrin cascade, resulting in reduced fibrin synthesis, consumption, and degradation [21–23]. At the same time, it increases the level of fibrinogen degradation products, interfering with fibrin formation, till the post-CPB period [24]. Dilution of RBC also reduces fibrin’s activity [25].
In addition to hemodilution- and UF-induced changes in the levels of pro-coagulants, that of anti-coagulants could be a critical determinant of overall coagulation performance. CPB reduced antithrombin (AT) activity and other protease inhibitors [16,17] and paradoxically induced a prothrombotic state [26]. Systemic heparinization also directly affects AT activity, probably relieving CPB-induced prothrombotic status [27]. Applying UF also increases the heparin concentration [28].
The amount of filtered water exceeding a certain level would be an important factor for providing tangible UF-induced changes in MCF-EXTEM. However, in our study, there was no significant correlation between the volume of filtered free water and the degree of MCF-EXTEM changes. As in our study, even a massive filtration could not resolve the extreme hemodilution status in some patients. In this context, the degree of CPB-induced hemodilution before applying UF is also a critical factor in expecting a positive response to applying UF.
Meanwhile, pre-UF values of MCF-EXTEM could discriminate the positive response to UF with high sensitivity and specificity in ROC analysis, and its estimated cut-off value for predicting the positive response was 50.5 mm. The cut-off value was similar to the lower limit of the reference value of MCF-EXTEM for sufficient clot firmness (ranges of 50‒70 mm) in a ROTEM-guided bleeding management [7].
In the subgroup analyses employing the cut-off value (> or ≤ 50.5 mm), UF could provide tangible increases in EXTEM assays in the patients with the already reduced pre-UF MCF-EXTEM (≤ 50.5 mm). By contrast, in patients with sustained pre-UF MCF-EXTEM values (> 50.5 mm), UF could not affect MCF-EXTEM. These dichotomized results suggest that UF increases MCF-EXTEM only in patients with reduced pre-UF MCF-EXTEM (the RTE of pre-UF:post-UF with MCF-EXTEM ≤ 50.5 mm = 0.26:0.39, Fig. 3). These results may potentially explain why previous studies could not consistently demonstrate a response to UF-induced changes in coagulation performance [5,12].
The absence of MCF-FIBTEM change, even in patients with reduced pre-UF MCF-EXTEM, supports the idea that the UF-induced increase in fibrinogen level might be less than a certain level to produce enhanced MCF-FIBTEM.
As in our study, it would be beneficial to perform a viscoelastic test near the end of CPB in predicting the efficacy and volume of UF as part of coagulation management [6]. ROTEM analyses before the end of CPB could prompt the preparation and administration of blood products or factor concentrates.
Our study did not analyze the possible relationship between UF and post-CPB bleeding nor determine the changes in platelet count and function before and after applying UF, despite the subgroup results suggesting the UF-induced increase in platelet count. UF’s contribution by eliminating CPB-induced proinflammatory cytokines was not accounted for [29]. UF did not affect clot initiation, as indicated by the CT-EXTEM change in our study. Still, CT-EXTEM could be insensitive and not affected until the hemodilution of > 60%‒70% in a previous report [12].
Our study demonstrated that UF during CPB improved coagulation performance, especially in patients with CPB-induced dilutional coagulopathy. A prospective study is warranted to confirm whether the cut-off value during CPB can be used to expect the UF’s positive impact as a part of the ROTEM-guided algorithm for managing coagulation during cardiac surgery [7].
Notes
Funding
This study was supported by the Konkuk University Medical Centre Research Grant 2020.
Conflicts of Interest
Klaus Görlinger works as the Medical Director of TEM innovations GmbH/Werfen PBM, Munich, Germany since 2012.
Data Availability
The datasets generated during and/or analyzed during the current study are available from the corresponding author on reasonable request.
Author Contributions
Jaemoon Lee (Conceptualization; Data curation; Formal analysis; Writing – original draft)
Dong-Kyu Lee (Conceptualization; Data curation; Formal analysis)
Won-Kyoung Kwon (Conceptualization; Data curation; Formal analysis)
Sookyung Lee (Data curation; Formal analysis)
Chung-Sik Oh (Conceptualization; Data curation; Formal analysis)
Klaus Görlinger (Conceptualization; Data curation; Formal analysis)
Tae-Yop Kim (Conceptualization; Data curation; Formal analysis; Funding acquisition; Writing – review & editing)
Supplementary Materials
Correlation analysis between changes in ROTEM parameters and the amount of filtered-free water.
The RTE values of non-parametric repeated measures ANOVA with one repeated and one between factors (F1-LD-F1 model) for analyses employing the cut-off value.