Machine learning model of facial expression outperforms models using analgesia nociception index and vital signs to predict postoperative pain intensity: a pilot study
Article information

Abstract
Background
Few studies have evaluated the use of automated artificial intelligence (AI)-based pain recognition in postoperative settings or the correlation with pain intensity. In this study, various machine learning (ML)-based models using facial expressions, the analgesia nociception index (ANI), and vital signs were developed to predict postoperative pain intensity, and their performances for predicting severe postoperative pain were compared.
Methods
In total, 155 facial expressions from patients who underwent gastrectomy were recorded postoperatively; one blinded anesthesiologist simultaneously recorded the ANI score, vital signs, and patient self-assessed pain intensity based on the 11-point numerical rating scale (NRS). The ML models’ area under the receiver operating characteristic curves (AUROCs) were calculated and compared using DeLong’s test.
Results
ML models were constructed using facial expressions, ANI, vital signs, and different combinations of the three datasets. The ML model constructed using facial expressions best predicted an NRS ≥ 7 (AUROC 0.93) followed by the ML model combining facial expressions and vital signs (AUROC 0.84) in the test-set. ML models constructed using combined physiological signals (vital signs, ANI) performed better than models based on individual parameters for predicting NRS ≥ 7, although the AUROCs were inferior to those of the ML model based on facial expressions (all P < 0.05). Among these parameters, absolute and relative ANI had the worst AUROCs (0.69 and 0.68, respectively) for predicting NRS ≥ 7.
Conclusions
The ML model constructed using facial expressions best predicted severe postoperative pain (NRS ≥ 7) and outperformed models constructed from physiological signals.
Introduction
Postoperative pain remains a prevalent but underestimated issue, with a reported occurrence of 30%–71% depending on the surgery type [1,2]. An 11-point numerical rating scale (NRS) is a widely used self-reported measure of pain intensity, with validated significant correlations to other pain rating measures [3,4]. It is preferred over other measures such as the visual analog scale (VAS) across different patient populations and cultures [5,6]. Although the NRS is simple and easy to use, pain intensity can only be evaluated at the assessment time. Since the recent guidelines by the American Pain Society, American Society of Regional Anesthesia and Pain Medicine, and American Society of Anesthesiologists (ASA) [7] recommend postoperative pain assessment every 15 min initially and every 1–2 h as the intensity decreases, assessments must be physically performed multiple times by a health practitioner. Furthermore, accurate NRS assessment may be difficult if patients are heavily sedated or cannot communicate during the immediate postoperative period [8]. As an alternative, alterations in visual cues such as facial expressions [9], and physiological indicators such as vital signs and the analgesia nociception index (ANI) [10], have been suggested as more objective measures of pain intensity, wherein facial expressions, ANI, and vital signs may be used for automated continuous pain assessment without a health practitioner.
Machine learning (ML) is an advanced technology that enables computers to learn from data, create algorithms and models, and make predictions without explicit instructions. ML can model complex, multicollinear relationships between variables and outcomes, surpassing traditional statistical methods [11,12].
Recent technical advances have facilitated automated artificial intelligence (AI)-based pain recognition [13–17]; however, few studies attempted to correlate it with pain intensity assessment [14,15] and rarely in postoperative settings [16,17]. In two studies [16,17], facial expressions were decomposed into action units that are constituent movements defined by the Facial Action Coding System [18] to construct AI models to predict NRS scores. In these earlier studies, other essential facial features such as geometry and landmarks were not incorporated into the models, and consequently, the models showed lower specificity, despite higher sensitivity, than the nurses’ pain assessments [17].
Additionally, while studies have reported the usefulness of physiological signals such as the ANI [19,20], and vital signs [21] for predicting self-reported postoperative pain intensity, the usefulness of fused modalities, especially those using AI, has not been explored, although implementing combinations of physiological signals have been suggested to improve pain monitoring [22].
Thus, in this pilot study, we constructed ML models using various combinations of facial expressions, the ANI, and vital signs, and compared their performances for predicting severe postoperative pain, defined as NRS ≥ 7. For the facial expression ML model, we incorporated all possible facial features including those relevant to appearance, geometry, and landmarks in addition to action units. To the best of our knowledge, this study was the first to develop an AI model using the ANI and vital signs to predict patient postoperative pain. The purpose of this pilot study was to evaluate whether various combinations of objective measures such as facial expression and physiological signals can be used to predict patient postoperative pain intensity when assisted by AI.
Materials and Methods
Study patients
This prospective randomized controlled trial was approved by the Institutional Review Board of Seoul National University Bundang Hospital (IRB No. B-2205-757-304) and registered at ClinicalTrials.gov (NCT05477303). It was conducted in accordance with the principles of the Declaration of Helsinki, 2013. Patients with gastric cancer who underwent surgery from June 2022 to October 2022 were assessed for eligibility, and informed written consent was obtained from all participants.
The inclusion criteria were: age ≥ 18 years, scheduled to be admitted to the postanesthesia care unit (PACU) after surgery, and ASA physical status I–II. Patients with inability to communicate to report subjective pain, body mass index (BMI) > 35 kg/m2 or < 18.5 kg/m2, alcohol or drug dependency, severe or acute respiratory depression, and/or admission to the intensive care unit after surgery were excluded. Data on baseline characteristics of patients were extracted from electronic medical records. Before surgery, all patients were educated about the NRS pain assessment method. Fig. 1 presents the study flowchart.
Study flowchart.
General anesthesia
Noninvasive blood pressure, electrocardiography, pulse oximetry, and instantaneous ANI were measured upon arrival in the operating room. Anesthesia was induced with 1 mg/kg propofol and target-controlled remifentanil infusion at 3.0 ng/ml of effect site concentration and maintained with desflurane and remifentanil. Following recovery of consciousness and spontaneous breathing, extubation was performed, and patients were transferred to the PACU.
Data acquisition
One board-certified anesthesiologist captured the facial expressions of patients before surgery, immediately after entering the PACU, and before and after administering rescue analgesics (fentanyl) in the PACU using the camera of an iPhone XSTM (Apple Inc.) dedicated for this study, and saved the images as JPEG files. All facial expressions were captured from a front view at a consistent distance of approximately 45–50 cm from the camera, with uniform camera settings (such as camera mode, exposure/focus, lens correction) to mitigate potential bias arising from variations in camera settings and facial expression capture methods. No cues or signals were given when taking the facial expression. The facial expression captured immediately after operating room entry before surgery was considered a zero-NRS score by default. The number of facial expressions captured per patient varied depending on the number of rescue analgesics required for each patient. Facial expressions were recorded both before and 10 min after administering rescue analgesics. Simultaneously, the patient was asked to state pain intensity using an 11-point NRS while the facial expression was noted. At each assessment, vital signs including systolic blood pressure (SBP), diastolic blood pressure (DBP), and heart rate (HR) were also recorded. Differences from the initial SBP, DBP, and HR before surgery were calculated and annotated as ∆SBP, ∆DBP, and ∆HR, respectively. In addition, using the ANI electrodes in V1 and V5 ECG positions, instantaneous ANI values were displayed on a stand-alone ANI monitor (MDoloris Medical System); the values were recorded at the time of assessment. Absolute ANI values and differences between the ANI values and the initial ANI value before anesthesia and operation (hereafter, ‘relative ANI value’) were used in the analysis.
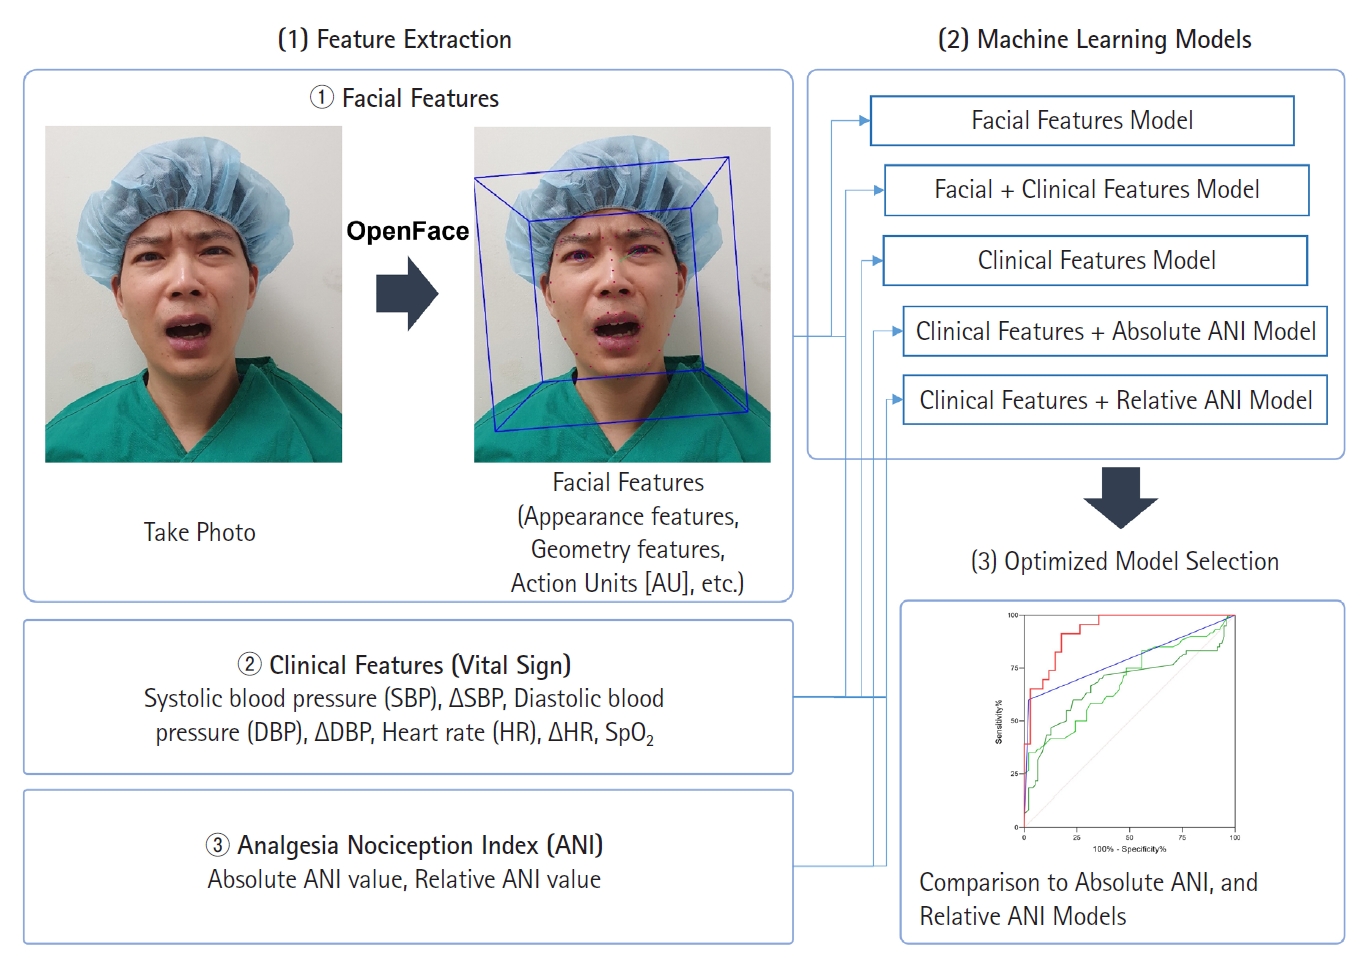
Feature extraction from facial expressions
To construct ML models, various quantitative features such as appearance features, geometry features, and facial landmarks were extracted from each facial expression in addition to the action units using the OpenFace 2.0 toolkit, a popular open-source facial detection and analysis tool known for its robustness and performance. A total of 709 features (hereafter, ‘facial features’) were extracted from each facial expression, with a mean confidence level of 0.942 (0.118).
ML model construction
The NRS scores were first divided into two groups: NRS ≥ 7 and NRS < 7. The cut-off score for severe postoperative pain was defined as NRS ≥ 7 in accordance to previous guidelines for pain managements [23,24], and because patients with NRS ≥ 7 are administered fentanyl 50 μg in contrast to patients with 3 < NRS < 7 who are administered fentanyl 25 μg, according to the institutional protocol. Additionally, as a pilot study, facial expressions, ANI, and vital signs in patients with severe pain were speculated to show greater differences than those obtained in patients with mild-to-moderate pain that would allow for a better evaluation of which AI-model would perform best at predicting the self-reported pain intensity.
Out of the total 155 facial expressions, 95 and 60 were in the NRS ≥ 7 and NRS < 7 groups, respectively. Since imbalanced data-sets can introduce bias and impede the binary classifier model from learning the decision boundary, the synthetic minority oversampling technique (SMOTE) algorithm [25] that generates synthetic data from the existing five neighboring data was used to generate synthetic facial features in the NRS < 7 group to match the number of facial features in the NRS ≥ 7 group (Fig. 2). The training and test sets were randomly split in a 7:3 ratio. Using forward feature selection (FFS) (hyperparameters: estimator = LinearRegression(); k features = 32 or 4 [32 for facial features and four for vital signs]; forward = true; floating = false; and scoring = r2) [25], 32 facial features were selected from 709 initial facial features, and four features were selected from six vital signs (SBP, DBP, HR, ∆SBP, ∆DBP, and ∆HR). A support vector machine (SVM) with a linear kernel was used to construct the ‘facial features model’ from 32 facial features and the ‘vital signs model’ from four vital signs features (hyperparameters: kernel = linear; probability = true). Similarly, FFS was used to select 32 features from 709 facial and six vital sign features to construct a ‘facial features + vital signs’ model. In addition, FFS was used to select four out of the six vital signs features and absolute ANI or relative ANI to construct ‘vital signs + absolute ANI’ and ‘vital signs + relative ANI’ models. Hyperparameter tuning for the SVM model was conducted using Scikit-learn’s GridSearchCV module, exploring variations in hyperparameters such as C, kernel, degree, gamma, shrinking, probability, tol, class_weight, verbose, decision_function_shape, and break_ties.
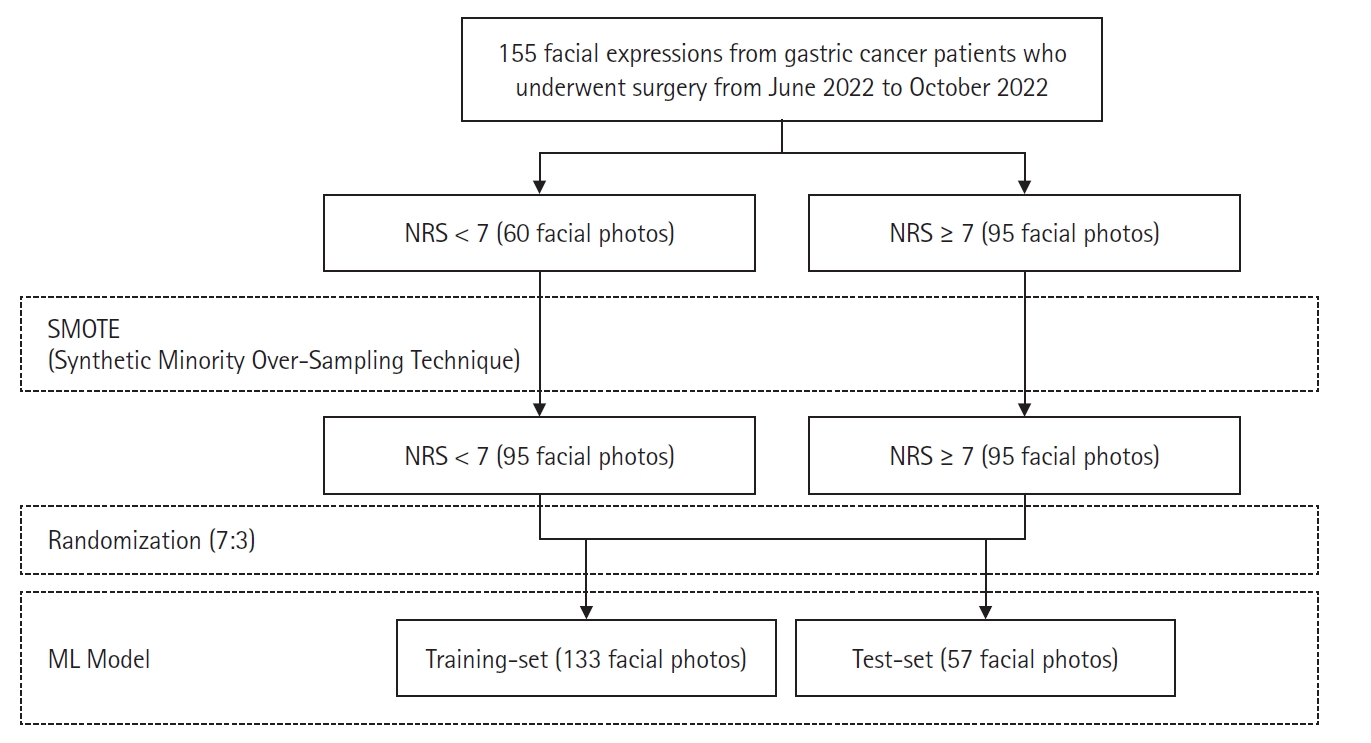
Construction of ML model using facial expressions. NRS: numerical rating scale, ML: machine learning.
After constructing the five ML models, the best one was selected based on performance and compared to the absolute ANI and relative ANI models. For the absolute and relative ANI models, the threshold value was calculated based on the maximum Youden index. The performance of these three models was compared by applying them to all 155 datasets.
Study outcomes
The primary outcome was the performances of various ML models constructed using one or combinations of facial expression, vital signs, and ANI for predicting NRS ≥ 7. The secondary outcomes were correlation between absolute or relative ANI and NRS, as well as performances of absolute and relative ANI for predicting NRS ≥ 7.
Implementation
All codes were written and run in Google Colab (https://colab.research.google.com) that had 12 GB RAM and an NVIDIA Tesla K80 GPU. Python 3.10.4 was used along with the following Python libraries: NumPy and Pandas that were used for data processing; Pillow was used for image processing; Imblearn was used to conduct SMOTE via minority sampling strategy; Scikit-learn was used to perform FFS and construct the SVM model; and Matplotlib and Seaborn were used for data visualization.
Sample size calculation
The required sample size for comparison under the area under the receiver operating characteristic curve (AUROC) was calculated as this metric was primarily used to compare the ML models. For the sample size calculation, a type 1 error (α) of 0.05 and type II error (β) of 0.20 (power of 80%) were used. The anticipated AUROC of our ML model was 0.65 and the AUROC of the null hypothesis was set to 0.50 because at this AUROC, there is no discriminative power to predict postoperative NRS, and a previous study reported AUROC of 0.53 at best for ML model based on facial expression action units [17]. We assumed an equal number of negative (NRS < 7) and positive (NRS ≥ 7) cases. Based on these parameters, the number of samples (facial expressions, the ANI, and vital signs) needed for the NRS < 7 and NRS ≥ 7 groups were 57 in each group, totaling 114 samples that is less than the number included in this study.
Statistical analyses
The Shapiro–Wilk test was used to evaluate normality. Non-normally distributed continuous variables are presented as median (Q1, Q3), and normally distributed continuous variables are presented as mean (standard deviation). Correlations between absolute or relative ANI and NRS was evaluated via the Spearman’s rank correlation analysis. Spearman’s ρ of 0–0.19, 0.20–0.39, 0.40–0.59, 0.60–0.79, and 0.80–1.0 represented very weak, weak, moderate, strong, and very strong correlations, respectively.
The performance and evaluation metrics of the proposed ML models were evaluated by calculating sensitivity, specificity, positive predictive value, negative predictive value, and accuracy. AUROC was calculated and compared using DeLong’s test. Additionally, models’ sensitivities and specificities were compared via McNemar’s test. All statistical analyses were performed using Google Colab or SAS software (version 9.4; SAS Institute, Inc.). Two-sided P values < 0.05 were considered statistically significant.
Results
Study participant characteristics
A total of 155 captured facial expressions, along with measurements of vital signs and ANI, were used for the final analysis. Among these, 95 were categorized to reflect postoperative pain intensities of NRS ≥ 7, while 60 were categorized as NRS < 7. Baseline characteristics of the study patients are listed in Table 1. The median age of the patients who participated in this study was 64.5 (60.0, 69.0) years with twice as many men than women. Most patients (87%) underwent subtotal gastrectomy; the rest received total gastrectomy. The median length of stay in the PACU for patients was 36.5 (28.5, 45.5) min.
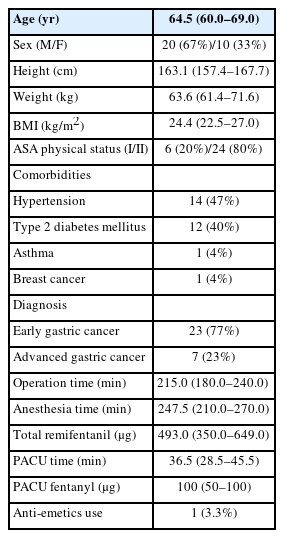
Patients’ Baseline Characteristics
Performances of ML models
Five ML models were constructed, wherein two models were constructed using either facial features or vital signs only and three models were constructed using different combinations of ‘facial features + vital signs,’ ‘vital signs + absolute ANI,’ and ‘vital signs + relative ANI.’ The performances of these models are presented in Table 2. In the training set, the ‘facial features + vital signs’ model showed the highest AUROC (0.97), followed by the ‘facial features’ model (0.96) for predicting NRS ≥ 7, and the accuracies of both models were ≥ 0.90. Models built without facial features, including ‘vital signs,’ ‘absolute ANI + vital signs,’ and ‘relative ANI + vital signs’ showed AUROCs < 0.8, and were inferior to the above-mentioned models (P < 0.001, all). In the test set, the ‘facial features + vital signs’ and ‘facial features’ models again showed better accuracies and AUROCs than the other models for predicting NRS ≥ 7; but between the two models, the ‘facial features’ model showed non-significantly higher AUROC than the ‘facial features + vital signs’ model (0.93 vs. 0.84, P = 0.054). The receiver operating curves (ROCs) of the training and test sets are presented in Fig. 3, and the precision-recall curves of the training and test sets are shown in Supplementary Fig. 1. The Shapley Additive exPLanations summary plots showing the importance of features of the ML models are shown in Supplementary Fig. 2.
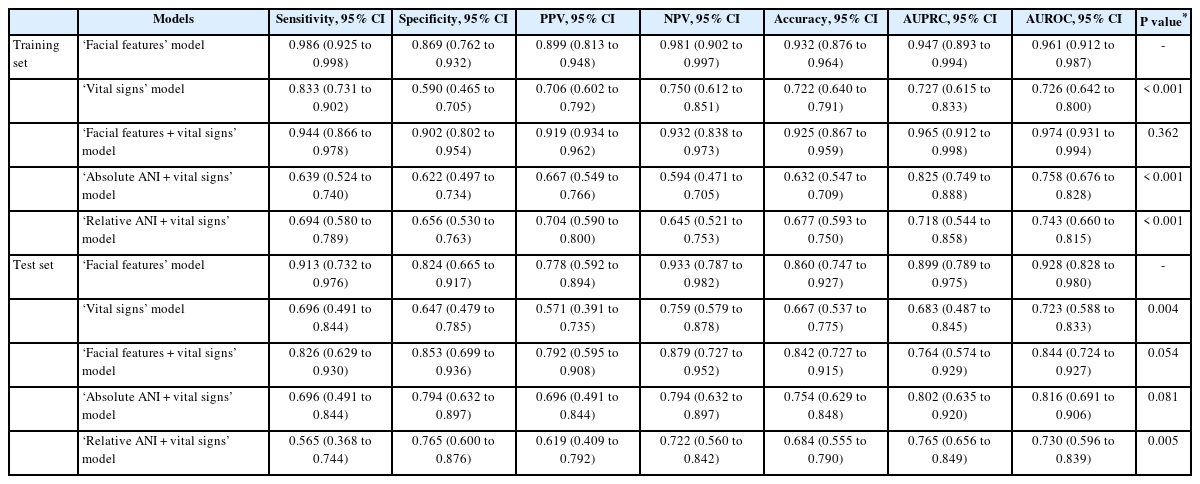
Comparison of Sensitivity, Specificity, PPV, NPV, and Accuracy of Various ML Models for Predicting NRS ≥ 7 Using the Training-and Test-Sets

ROC curves of various ML models for the (A) training set, (B) test set, as well as (C) ROC curves comparing the ‘facial features’ ML model, Absolute ANI (≤ 42), and Relative ANI (≤ −14). AUROC: area under the receiver operating characteristic curve, ROC: receiver operating characteristic curve, ML: machine learning, ANI: analgesia nociception index.
Performances of the best ML model vs. the ANI
Among the various ML models, the ‘facial features’ model was considered the best based on the highest accuracy and AUROC for predicting NRS ≥ 7 in the test set. Since the absolute and relative ANI alone may possibly be a better predictor of NRS ≥ 7 without combination to vital signs or facial features by ML, their performance in predicting NRS ≥ 7 was additionally explored.
The Spearman’s rank correlation analysis revealed significant but weak inverse correlations between the absolute ANI and NRS (ρ = −0.34, P < 0.001), and also between the relative ANI and NRS (ρ = −0.33, P < 0.001). The absolute and relative ANI showed a maximum AUROC of 0.69 and 0.68 at cutoff values of 42 and −14, respectively (Table 3). The calculated AUROCs of absolute and relative ANI were both significantly inferior to that of the ‘facial features’ ML model (P < 0.001). Their inferior AUROCs were due to significantly lower sensitivities: the sensitivities of absolute and relative ANI were 0.35 and 0.60, respectively, and less than the 0.91 of the ‘facial features’ ML model. Between the absolute and relative ANI, there was no difference in AUROCs for predicting NRS ≥ 7 (P = 0.824).
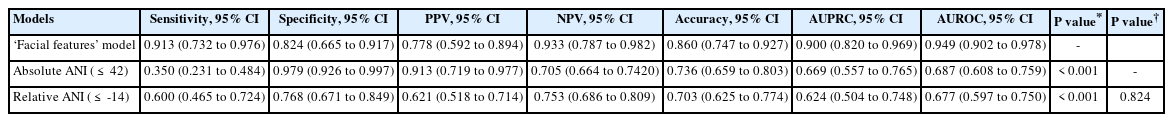
Comparison of Sensitivity, Specificity, PPV, NPV, and Accuracy between the Best ML Model (‘Facial Features’ Model) and Absolute ANI and Relative ANI
Discussion
Herein, we developed a number of ML models with various combinations of ‘facial features’ from facial expressions, vital signs, and either the absolute or relative ANI. In contrast to previous studies [16,17], all possible facial features including features relevant to appearance, geometry, and landmarks, in addition to the action units, were used to construct the ML model; consequently, the ‘facial features’ model had higher accuracy in predicting postoperative pain than those reported by previous studies [16,17]. In addition, among the several ML models developed in this study, the ‘facial features’ model was best at predicting NRS ≥ 7. Herein, we even developed ML models that combined vital signs and the absolute/relative ANI, but their performances were inferior to that of the ‘facial features’ model. Furthermore, while absolute and relative ANI were significantly inversely correlated to the NRS, their individual ability to predict NRS ≥ 7 was inferior to the ‘facial features’ ML models.
To the best of our knowledge, this is the first study to use ML on the ANI to construct AI models for predicting postoperative pain. ANI is a 0–100 index derived from HR variability, and it measures parasympathetic tone as a surrogate for analgesia/nociception balance [26]. Studies have suggested that ANI is an objective and reliable indicator for predicting intraoperative pain [10,20,27]. Although its correlation has been weak when applied to conscious patients, a previous meta-analysis has reported the ANI to be more helpful when applied immediately after sedation or surgery [28]. To date, there is insufficient evidence to assess nociception or pain solely using ANI, especially in the awake state. However, the use of ANI as a non-invasive indirect measure of pain has received more attention in recent years [29]. Similar to our study, Boselli et al. [20] also evaluated ANI performance in predicting immediate postoperative pain in patients who were initially induced using propofol. However, in our study, ANI performance was suboptimal compared to that of Boselli et al.’s study [20]. Specifically, ANI specificity was better (absolute ANI, 0.98 in our study vs. Boselli et al. [20], 0.87), but the sensitivity was lower (absolute ANI, 0.35 vs. Boselli et al. [20], 0.89). Although this discrepancy may be attributed to the use of different pain thresholds (NRS ≥ 7 in our study vs. NRS ≥ 3 in the other study [20]), our results indicated that ANI may not effectively discriminate severe pain when applied to patients during the immediate postoperative period.
To overcome ANI shortcomings, the ML models that combined vital signs and absolute or relative ANI were constructed and explored. The performance of combined models was better than that of absolute or relative ANI alone, proving that combinations of physiological signals were more accurate than individual parameters for pain assessment. Still, our results indicated that the ML model based on facial expressions was more accurate than the ML model based on physiological signals for predicting severe postoperative pain.
Our ML model that utilized a diverse set of facial expression features had higher performance for predicting severe pain compared to models that primarily relied on action units [16,17]. Fontaine et al. [17] also used the OpenFace toolkit to extract action units, similar to our study. However, OpenFace extracts a maximum of 18 distinct action units, implying that models exclusively based only on it are inherently limited to employing a maximum of 18 variables. In addition, in another study by Sikka et al. [16], the model was constructed using 10 different action units and four additional facial features, including smile, yaw, pitch, and roll. In contrast, our approach involved the extraction of 709 distinct facial features, covering various aspects related to facial appearance, geometry, landmarks, and action units. From this extensive feature set, FFS was used to identify the 32 most relevant features for modeling. Upon closer examination, the majority of the 32 selected features were associated with facial appearance, geometry, and landmarks, while only a minority were related to action units. This finding demonstrated that while action units represent objective, anatomically based movements as defined by the Facial Action Coding System [18], they may not have captured the full spectrum of subtle changes in facial expression attributable to pain [17].
Interestingly, the ML model based on facial expressions performed better than the ML models that combined facial expressions and physiological signals (either vital signs or ANI). A possible explanation may be that acute postoperative pain is quickly manifested as drastic changes in the facial expression before being manifested as perturbations in the physiological signals. In addition, changes in the features of a facial expression had sufficient information for the ML model to identify patients with severe postoperative pain without the need for physiological signals. Based on these results, there is potential for an automated AI system to continuously monitor postoperative pain intensity through the facial expressions in the PACU. Whether the actual clinical application of AI can lead to an improved patient quality of recovery, and decrease the mundane task of repetitive pain assessments for anesthesiologists and nurses needs to be confirmed in future studies.
This study had several limitations. First, it was a single institutional prospective pilot study, and there may have been a selection bias. Second, facial features were extracted using OpenFace, one of several available facial detection and analysis tools, and the performance of the AI model may vary depending on the tool used for feature extraction. Third, the most commonly used self-reporting pain assessment tool, NRS, was used over other assessment tools, including the verbal rating scale and VAS; however, there is insufficient evidence to recommend a specific assessment over another in the postoperative period [7]. Finally, although we utilized a sufficient number of facial expressions, ANI, and vital signs to construct the ML model for comparing performances in predicting severe pain, a limited data-set was still used for training and test purposes in this pilot study.
In conclusion, the ML model based on facial expressions successfully predicted significant postoperative pain intensity (NRS ≥ 7) with high accuracy and outperformed the ML models based on physiological signals including the vital signs and ANI. The results of this study open up potential for future studies to investigate whether patient quality of recovery can be improved with the use of an AI model for faster pain recognition and management in the PACU.
Acknowledgements
We would like to thank Ingyeong Park for contributing to the development of the ML models.
Notes
Funding
None.
Conflicts of Interest
Jung-Hee Ryu has been an editor for the Korean Journal of Anesthesiology (KJA) since 2018 and Bon-Wook Koo has also been an editor for the KJA since 2023. However, they were not involved in any process of review for this article, including peer reviewer selection, evaluation, or decision-making. There were no other potential conflicts of interest relevant to this article.
Data Availability
The datasets generated during and/or analyzed during the current study are available from the corresponding author on reasonable request.
Author Contributions
Insun Park (Conceptualization; Data curation; Formal analysis; Writing – original draft; Writing – review & editing)
Jae Hyon Park (Conceptualization; Data curation; Formal analysis; Methodology; Writing – original draft; Writing – review & editing)
Jongjin Yoon (Formal analysis; Methodology; Visualization; Writing – review & editing)
Hyo-Seok Na (Writing – review & editing)
Ah-Young Oh (Writing – review & editing)
Jung-Hee Ryu (Writing – review & editing)
Bon-Wook Koo (Conceptualization; Formal analysis; Methodology; Project administration; Supervision; Writing – original draft; Writing – review & editing)
Supplementary Materials
Precision-recall curves of various ML models for the (A) training set and (B) validation set as well as (C) precision-recall curves comparing the “facial features” ML model, Absolute ANI (≤42), and Relative ANI (≤ −14). ANI: analgesia nociception index, ML: machine learning.
SHAP summary plots showing importance of features for various ML models: (A) “Facial features” model, (B) “Vital signs” model, (C) “Facial features + vital signs” model, (D) “Absolute ANI + vital signs” model, and (E) “Relative ANI + vital signs” model. ML: machine learning, SHAP: Shapley Additive ex-Planations.