Change of QT variability index during general anesthesia
Article information

Abstract
Background
The QT variability index (QTVI)–a non-invasive measure of beat-to-beat QT interval (QTI) fluctuations–is related to myocardial repolarization lability. The QTVI represents the relationship between QTI and the RR interval. Elevated QTVI is associated with an increased risk of malignant ventricular arrhythmias and sudden death. We investigated the influence of general anesthesia and tourniquets on the QTVI.
Methods
We studied fifty patients who received total knee replacement arthroplasty under sevoflurane anesthesia. We measured QTI, corrected QTI (QTc), T-wave peak-to-end interval (TPE), QTVI, and heart rate variability. All variables were calculated at baseline (B), 30 min after general anesthesia (A), 30 min (TQ1) and 60 min (TQ2) after tourniquet inflation, and at tourniquet deflation (TQR).
Results
Prolongation of QTI was detected at all times, and QTc was significantly prolonged TQR. TPE was unchanged during general anesthesia. The QTVI was significantly decreased and more negative during anesthesia and tourniquet inflation. After deflation of the tourniquet, the QTVI was restored to preanesthetic values. Low frequency (LF) was significantly decreased during general anesthesia, but high frequency (HF) was somewhat maintained, except at TQ2. The LF/HF ratio was significantly decreased at A and TQ2.
Conclusions
Sevoflurane based general anesthesia induced repolarization stability and, more negativity of the QTVI, in patients undergoing total knee replacement arthroplasty.
Introduction
QT interval (QTI) prolongation is a well-known cause of malignant tachyarrhythmias, and can induce sudden cardiac death [1]. QTI prolongation is caused by electrolyte disturbance or by medications, such as antiarrhythmics, and droperidol, among others [2]. Surgical patients undergoing general anesthesia are simultaneously exposed to multiple drugs that are known to induce QTI prolongation [1].
The QT variability index (QTVI) is a non-invasive measure of beat-to-beat QTI fluctuations that easily assesses temporal myocardial repolarization lability [34]. The QTVI is represented as a proportion between beat-to-beat QTI variability and RR interval (RRI) variability. The index is a well-established global assessment tool for the risk of sudden cardiac death, not only in high-risk groups but also in patients with mild-to-moderate arrhythmia risk [456]. Decreased QTVI negativity or a return to positive values denotes a tendency for malignant arrhythmias [34]. The QTVI is influenced by alterations in the RRI, according to changes in the autonomic nervous system (ANS) or its direct effect on the QTI itself [7]. To some extent, the QTVI is a measure of cardiac sympathetic activity, and it increases in healthy subjects with head-up tilt [8].
Pneumatic tourniquets provide a bloodless surgical field for the extremities, but tourniquet inflation induces a hyperdynamic state that may be characterized by increased heart rate and blood pressure during general anesthesia [9]. These changes are somewhat associated with responses of the ANS, such as high sympathetic activity and low parasymphathetic activity [10]. Tourniquet deflation also triggers acute hypotension, and rapid changes in blood pressure induce baroreflex activity via the sympathetic nervous system [11].
We also assumed that general anesthesia, tourniquets, and surgical stimuli exert influences on the ANS, RRI, and QTI. Therefore, it is possible for the QTVI to be altered by general anesthesia and tourniquets. We assessed the changes in QT variables including the QTVI and the relation of heart rate variability (HRV) during the use of general anesthesia and tourniquets.
Materials and Methods
After approval from the Institutional Ethics Committee of our Hospital, and written informed consent were obtained, fifty patients scheduled to undergo total knee replacement arthroplasty under general anesthesia were enrolled (M/F: 5/45, age: 68.5 ± 4.9 year, body mass index [BMI]: 26.8 ± 4.0 kg/m2) (Table 1). No patients received oral premedication, but they did continue their medication for any underlying diseases (Table 1). We excluded patients with underlying heart disease, such as ischemic heart disease, valvular heart disease or conduction abnormalities, as well as patients taking beta-blocking medications or other drugs known to cause QT prolongation.
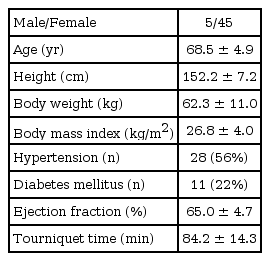
Demographic Data
Patients were allowed to acclimatize for at least 10 min in the supine position in a quiet operating room with an ambient temperature. Baseline beat-to-beat electrocardiography (ECG) was recorded for 5 min before the administration of any sedatives. Induction and maintenance of anesthesia were performed in a standardized manner in all patients. Anesthesia was induced with etomidate 2 mg/kg administered intravenously as a bolus and maintained with sevoflurane inhalation. Remifentanil was infused continuously starting at 0.15 µg/kg/min until the trachea was intubated, and then at a dose of 0.05–0.15 µg/kg/min. Tracheal intubation was facilitated with 0.8 mg/kg rocuronium. The depth of anesthesia was controlled using a bispectral index (BIS) monitor (BIS XP, Aspect Medical Systems, Inc., Norwood, MA, USA) aiming for a BIS level below 60. If the BIS value exceeded 60, sevoflurane was increased stepwise by 0.2 vol%.
Beat-to-beat ECG signals were digitized and collected at 500 Hz using an on-line personal computer that was interfaced with an analog-to-digital converter (DI-720U, DATAQ Instruments, Inc., Akron, OH, USA). We selected 5 min of ECG data, and all ECG data were reviewed by visual inspection, and segments containing signal loss, noise, or extrasystoles were discarded. RRIs were derived from the time difference between marks placed on the peaks of the R waves. The time and frequency domains of HRV were calculated: the square root of the meansquared differences of successive RRI (RMSSD), the areas under power spectra in the low frequency (LF) and high frequency (HF) regions (defined as 0.04–0.15 Hz and 0.15–0.40 Hz, respectively). QTI was measured in lead II from the automatic method via Labchart® 6 Pro (version 6.1.3, ADInstruments, Colorado Springs, CO, USA) and the accuracy was checked via manually measurement. The values of QTI and TPE (time between Twave peak and T-wave end) of each four beats were averaged. Heart rate adjusted QTI (corrected QTI, QTc) was calculated using Bazett's formula (QTc = QTI/√RRI1/2). QTVI and QTVN were calculated according to the following formulae;
QTIv: variance of QTI, QTIm: mean of QTI, RRIv: variance of RRI, RRIm: mean of RRI QTVN: normalized QT variance, QTcVN: normalized QTc variance.
QT variables and HRV were measured before induction (baseline: B); 30 min after anesthesia induction (anesthesia: A); 30 min (TQ1) and 60 min (TQ2) after tourniquet inflation; and 5 min after tourniquet release (TQR).
Normal distribution was examined using the Shapiro-Wilk test. Normally distributed continuous data are expressed as mean and standard deviation, and where skewed, as median with interquartile range. The differences within groups were analyzed using a one way analysis of variance. A P value of < 0.05 was considered significant.
Results
Prolongation of QTI was detected all times, and QTc at TQR was significantly prolonged compared with the values at B and A (Table 2). The QTVN was significantly decreased at A, TQ1, and TQ2, and restored at TQR. The QTcVN showed similar change to those of QTVN. The TPE remained unchanged during general anesthesia as well as tourniquet inflation and deflation. The QTVI was significantly decreased and more negative during anesthesia and tourniquet inflation (Fig. 1). After deflation of the tourniquet, all QT variables were restored to their preanesthetic value (B).
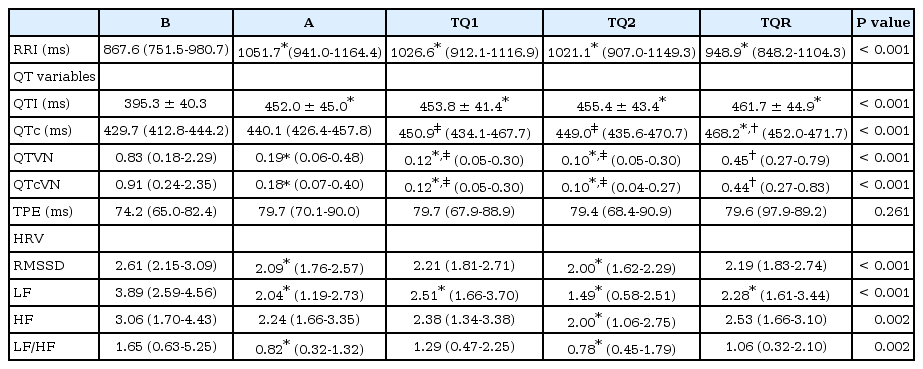
Change of RRI and QT Variables during General Anesthesia
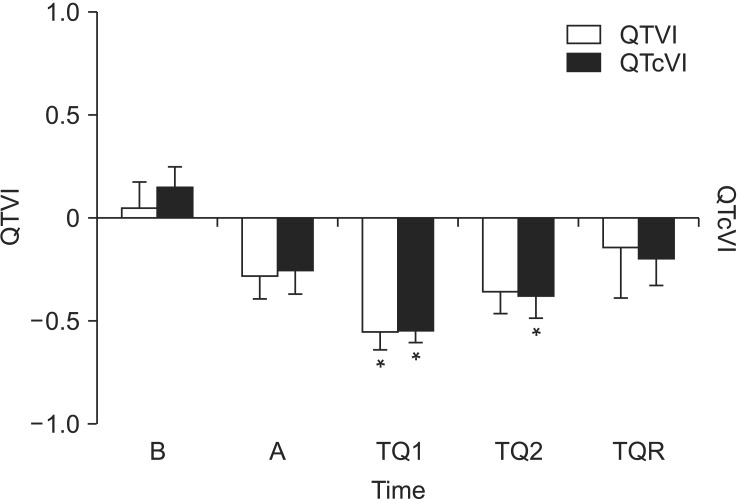
The change of QT/QTc variability index. QTVI and QTcVI were decreased after anesthesia and tourniquet inflation, and restored after release of tourniquet. At TQ1, QTVI and QTcVI showed the lowest values. QTVI: QT variability index, QTcVI: corrected QT variability index, B: baseline, A: after general anesthesia, TQ1 and TQ2: at 30 min and 60 min after tourniquet inflation, TQR: at 5 min after tourniquet deflation. *P < 0.05 compared to B.
The LF was significantly decreased during general anesthesia, but HF was somewhat maintained, except at TQ2. The LF/HF ratio was significantly decreased at A and TQ2. The tourniquet did not bring about any alterations in HRV during general anesthesia.
Discussion
The QTVI is more negative during sevoflurane-based general anesthesia and significantly decreased at tourniquet inflation. QTVN is also decreased during anesthesia and at tourniquet inflation, and is restored after tourniquet deflation. However, QTI and QTc are prolonged under general anesthesia. Thus, QT variables, with the exception of QTI and QTc, range lower than their preanesthetic values during sevoflurane and remifentanil anesthesia in patients undergoing total knee replacement.
The QTVI was first documented by Berger et al. [3] for the risk stratification of dilated cardiomyopathy. The QTVI is a noninvasive measure of beat-to-beat QTI fluctuations that easily assesses temporal myocardial repolarization lability [312]. The value of the QTVI in healthy subjects is less than -1, because normalized heart rate variance is greater than normalized QT variance [3]. An elevated QTVI, with a value near zero, indicates an unfavorable electrophysiological state of myocardium that is relevant to malignant arrhythmia [456]. Elevated QTVI has been reported in myocardial ischemia, hypertrophic cardiomyopathy, and long-QT syndrome, because of marked elevation of normalized QT variance [1314]. In the current study, QTVI was greater than zero in the awake state. It is well known that HRV decreases in accordance with increasing age [15]. Aging and female gender have been reported to elevate QTVI [12]. Piccirillo et al. [12] reported that QTVI was -0.3 at rest in individuals over 65 years of age. We assumed that the high QTVI in this study was related to the older age of the participants (68.5 years), the predominant female gender (90%), and anxiety and high sympathetic tone, among other factors. High sympathetic tone was attested to by the increased LF and LF/HF ratio that represents sympathetic and sympathovagal balance in HRV [16]. The ANS plays a key role in the genesis of beat-to-beat QTVI, through changing of RRI or QTI depending on the equation [717]. The QTVI is a measure of cardiac sympathetic activity to some degree, and it increases in healthy subjects with postural changes and infusion of isoproterenol [8]. However, we found no correlation between QTVI and LF of HRV in the current study.
The QTVI decreased after general anesthesia and tourniquet inflation, and increased after tourniquet release. Therefore, myocardial repolarization was found to become stabilized under general anesthesia with sevoflurane and remifentanil in this study. However, this result is inconsistent with the findings of previous studies. In children, QTVI is increased after sevoflurane anesthesia, because of markedly depressed heart rate variance [18]. However, the change in QTVI is incompletely understood during general anesthesia. Sevoflurane is known to increase the myocardial action potential duration and repolarization lability, but not change the transmural heterogeneity [19]. Remifentanil has no effect on QTI and pretreatment with remifentanil prevents QTc prolongation after tracheal intubation [20]. It is possible that sevoflurane and remifentanil induce myocardial stabilization in elderly subjects with increased QTVI.
The two components of QTVI, QTVN and HRV, have independently predictive power of mortality [3]. Increased QTVN is also associated with a high risk of ventricular arrhythmia [14]. In the current study, QTVN ranged low under general anesthesia with sevoflurane and remifentanil, despite surgical stimuli and tourniquet inflation. After tourniquet deflation, QTVN and HRV were increased, and then, QTVI was near zero. Application of a tourniquet provides a bloodless surgical field in lower and upper extremity surgery, in addition to developing the pain and increasing sympathetic activity and blood pressure, even in patients who have received adequate anesthesia [910]. Although the mechanism of tourniquet hypertension is not clear, it is associated with the ANS and an increase in catecholamine has been found [1011]. Inflation of the tourniquet decreased QTVI, even though it increased sympathetic activity in the present study. The reduction of QTVN was bigger than that of HRV after tourniquet inflation, although we could not explain the exact mechanisms. We assumed that it was affected by a combination of the anesthetic agents, the tourniquet, and surgical stimuli, among others. Tourniquet release can trigger acute hypotension, and circulatory collapse may rarely develop [10]. Hypotension is associated with reduction of systemic vascular resistance, bleeding, and shifts of blood back to ischemic limbs [9]. Rapid decreases in blood pressure cause the baroreflex sensitivity to induce changes in sympathetic nervous system activity [1021]. Thus, elevation of QTVI, QTVN and LF were somewhat related to activation of sympathetic tone after the release of the tourniquet.
There is a difference in the configuration of the cardiac myocardial ion channel. Therefore repolarization of myocardial walls does not occur at the same time, and produces a physiological transmural dispersion of repolarization (TDR) [15]. TPE is defined as the time between the peak and the end of the T-wave and provides an easily assessment of the index of TDR from surface ECG leads. Prolongation of TPE represents increased TDR and an increased risk of malignant arrhythmia [15]. The effect of medications used during general anesthesia on TPE is not yet sufficient. In pediatric patients, sevoflurane has no significant effect on TPE, despite the fact that it prolongs the QTc interval [19]. In the current study, the QTI and QTc interval were prolonged, but TPE was not affected by sevoflurane, remifentanil, or tourniquets. It is possible to have a low risk of malignant arrhythmias such as shown by the findings of this study, in which QTI was prolonged without increased TPE.
There are several limitations to this study. The majority of enrolled patients were female and the elderly. Therefore, the present results may not extrapolate to other populations. Preoperative cardiovascular variables were obtained in the operating room before surgery. Thus, the withholding of sedatives may have contributed to hypertension and tachycardia and induced alterations in QT variables and HRV. Our study also included patients with underlying diseases that might be confounding factors. In addition, the appropriate lead for measuring TPE was not defined, but it has been suggested to use precordial leads. Whyte et al. [19] recommended that leads II and V5 were the best leads to measure TPE. We only examined lead II, which was easily assessed during general anesthesia. Although T-wave peak position may be different in each leads, the difference would not be significant. The study of more leads will be needed to obtain accurate results.
In conclusion, sevoflurane-based general anesthesia induces myocardial stabilization and, decreased the QTVI, in patients undertgoing total knee replacement arthroplasty. Physiologic transmural dispersion is not affected by sevoflurane anesthesia.