The influence of different mechanical ventilator settings of peak inspiratory pressure on stroke volume variation in pediatric cardiac surgery patients
Article information
Abstract
Background
The usefulness of dynamic parameters derived by heart-lung interaction for fluid responsiveness in pediatric patients has been revealed. However, the effects of peak inspiratory pressure (PIP) that could affect the absolute values and the accuracy in pediatric patients have not been well established.
Methods
Participants were 30 pediatric patients who underwent ventricular septal defect repair. After completion of surgical procedure and sternum closure, mean arterial blood pressure, heart rate, central venous pressure, cardiac output, cardiac index and stroke volume variation (SVV) were measured at PIP 10 cmH2O (PIP10), at PIP 15 cmH2O (PIP15), at PIP 20 cmH2O (PIP20) and at PIP 25 cmH2O (PIP25).
Results
SVV at PIP15 was larger than that at PIP10 (13.7 ± 2.9% at PIP10 vs 14.7 ± 2.5% at PIP15, P < 0.001) and SVV at PIP20 was larger than that at PIP10 and PIP15 (13.7 ± 2.9% at PIP10 vs 15.4 ± 2.5% at PIP20, P < 0.001; 14.7 ± 2.5% at PIP15 vs 15.4 ± 2.5% at PIP20, P < 0.001) and SVV at PIP25 was larger than that at PIP10 and PIP15 and PIP20 (13.7 ± 2.9% at PIP10 vs 17.4 ± 2.4% at PIP25, P < 0.001; 14.7 ± 2.5% at PIP15 vs 17.4 ± 2.4% at PIP25, P < 0.001; 15.4 ± 2.5% at PIP20 vs 17.4 ± 2.4% at PIP25, P < 0.001).
Conclusions
SVV is affected by different levels of PIP in same patient and under same volume status. This finding must be taken into consideration when SVV is used to predict fluid responsiveness in mechanically ventilated pediatric patients.
Introduction
The prediction of fluid responsiveness, that is, whether the cardiac output (CO) and organ perfusion will be increased by a fluid challenge or not, is important for optimal intra-operative and post-operative management. Recently, there have been several reports that the parameters induced by the respiratory cycle and heart-lung interaction, namely the dynamic parameters such as the expiratory decrease in arterial systolic pressure (Δdown), respiratory changes in pulse pressure (ΔPP) and in aortic blood velocity (ΔVpeak), pleth variability index and stroke volume variation (SVV) were more useful for predicting fluid responsiveness in various clinical situations than cardiac filling pressures such as right atrial pressure and pulmonary artery occlusion pressure, which have been used traditionally for the guidance of fluid management [1,2,3,4].
In pediatric patients, the accurate detection of the patients' volume status for fluid management is more important because of the large size of the fluid shifts versus the patient's small body surface area and body weight. Also, there are several reports that showed the usefulness of dynamic parameters for assessing fluid responsiveness in pediatric patients [5,6,7]. However, various factors such as mechanical ventilation or spontaneous ventilation, tidal volume, respiratory rate, pulmonary and abdominal compliance that affect the absolute values and the accuracy of dynamic parameters have already been revealed in adult patients [8,9,10,11,12], but the effects of these factors in pediatric patients have not been well established.
The aim of this study was to evaluate the effect of the different ventilator settings with different peak inspiratory pressures (PIP) on SVV in pediatric patients undergoing cardiac surgery due to congenital heart disease.
We hypothesized that the different PIP might alter the absolute value of SVV. Thus, the values of SVV measured by the bioreactance technique with a non-invasive cardiac output monitoring (NICOM) device which is noninvasive, easy to use and easy to interpret, and other hemodynamic parameters measured by invasive monitoring at each different PIP level were compared and analyzed.
Materials and Methods
Study population
This study was approved by the Institutional Review Board. After explanation of the study protocol, written and informed consent was obtained before the operation from the parents of all participants undergoing cardiac surgery due to ventricular septal defect (VSD), and the patients were studied prospectively in a university teaching hospital from November, 2011 to April, 2012. Patient exclusion criteria were as follows: 1) urgency or emergency case, 2) pre- or post-operative arrhythmia, 3) reduced left and right ventricular function (ejection fraction < 40%), 4) patients with a dermatologic disease or small body surface so that they interfered with NICOM patch attachment. Cardiac surgery procedures were performed by one pediatric cardiac surgery team and cardiopulmonary bypass was performed by one perfusionist in the cardiac surgery team. The cardiac surgeons, nurses and perfusionist were blinded to the study.
Anesthetic regimen
Anesthesic induction and maintenance were standardized. Anesthesia was induced with thiopental (5 mg/kg), fentanyl (5 µg/kg) and sevoflurane (2-3 vol%). After confirming adequate manual ventilation, rocuronium (0.6 mg/kg) was administered to facilitate tracheal intubation. Mechanical ventilation was performed through pressure-controlled ventilation (PCV) without positive end-expiratory pressure. Anesthesia was maintained with 2-3 vol% sevoflurane and intermittent bolus administration of fentanyl, midazolam and rocuronium depending on the clinical judgment of the trained cardiac anesthesiologist.
After anesthesia induction, an arterial catheter was placed in the radial or femoral artery for invasive arterial blood pressure monitoring. A central venous catheter was placed in the right internal jugular vein under ultrasound guidance. The pressure transducers (PX600F, Edwards Lifesciences, Irvine, CA, USA) for the mean arterial blood pressure (MAP) and central venous pressure (CVP) were positioned on the midaxillary line under guidance from a laser leveller (PhysioTrac™, Edwards Lifesciences, Irvine, CA, USA) and fixed to the operating table in order to keep the transducer at the atrial level during the entire study protocol. The depth and proper position of the tracheal tube and central venous catheter were confirmed by chest X-ray. A transesophageal echocardiography probe was inserted for perioperative cardiac function monitoring.
Bioreactance-based non-invasive monitoring
After anesthesia induction, NICOM device electrode strips were placed on the patient's chest and connected to the NICOM controller (NICOM, Cheetah Medical, Inc., Vancouver, WA, USA). Each electrode sensor strip consisted of two contact points. The upper thoracic electrode strips were placed at the mid-subclavian region and the lower electrode strips were placed at the middle region of the lower costal margin. After initial calibration of the NICOM system, continuous CO, cardiac index (CI), stroke volume (SV) and SVV were monitored until just before departure from the operating room.
The system's signal processing unit determines the relative phase shift (Ф) between the input and output signals. This phase shift between the input and output signals is due to changes in the blood volume in the aorta. SV determined by bioreactance with the NICOM device can be estimated by: SV = C · VET · dФ/dtmax, where C is a constant of proportionality, VET is the ventricular ejection time and dФ/dtmax is the peak rate of change of Ф [13]. The value of C has been optimized in prior studies and accounts for patient age, gender and body size [14].
Maximal and minimal values of SV were determined beat-to-beat over a single respiratory cycle. The SVV was calculated as follows:
The value of SVV displayed in the device was the average value for 1 minute and the time interval between each measurement was 1 minute.
Measurement
After completion of the surgical procedure and sternum closure, MAP (mmHg), heart rate (HR, beats/min), CVP (mmHg), CO (L/min), CI (L/min/m2) and SVV (%) were measured and recorded at PIP 10 cmH2O (PIP10), at PIP 15 cmH2O (PIP15), at PIP 20 cmH2O (PIP20) and at PIP 25 cmH2O (PIP25). The status of each different PIP was maintained for 5 minutes and the variables were measured at the time of the last 5 minutes. During the study protocol, to maintain similar minute ventilation at each measurement point, the respiratory rate of the mechanical ventilation was adjusted under guidance of the end-tidal carbon dioxide pressure, which ranged from 30 to 35 mmHg, through capnography (S/5 Compact Anaesthesia Monitor, Datex-Ohmeda, Finland) with an inspiratory/expiratory ratio = 1 : 2. The fraction of inspired oxygen (FiO2) was usually maintained at 0.35 or 0.6 in cases of suspicious pulmonary hypertension status. During the entire study protocol, there were no changes of medication and fluid administration. In cases of unstable hemodynamic status (MAP decreased more than 20% or oxygen saturation measured by pulse oximetry decreased more than 10% compared with the value just before measurement), the study was stopped and these patients were excluded from the analysis.
Statistics
Based on the preliminary data of 10 cases, the mean and standard deviation of SVV at PIP15 were 11.3 ± 2.6%. A minimum detected difference of 20 % between the values by the different PIP was considered clinically significant. A sample size of 30 was calculated to be appropriate to achieve a power of 0.8 and an α value of 0.05. Statistical analyses were conducted using the SigmaStat software (ver. 3.1; SYSTAT Software, San Jose, USA). Continuous variables were analysed using the One Way Repeated Measures Analysis of Variance or Friedman Repeated Measures Analysis of Variance on Ranks test between each different PIP. Data were expressed as the mean ± standard deviations or the median (25-75%) and numbers of patients. A P value less than 0.05 was considered to indicate significance.
Results
During the study, a total of eighty-three congenital cardiac surgeries were performed and 46 of these were VSD repairs. Sixteen of these patients were excluded: 6 patients for post-operative arrhythmia, 5 patients for parent's refusal, 3 patients for instrumental (NICOM device) error and 2 patients for suspicious residual severe pulmonary hypertension. Thus, 30 patients were included in the final analysis. The study was ended when the numbers of patients met the pre-determined sample size (30 patients), and further evaluation or follow-up was not performed after discharge from the operating room. There were no harmful results or unintended events occurring in the patients.
The clinical characteristics of patients are summarized in Table 1.
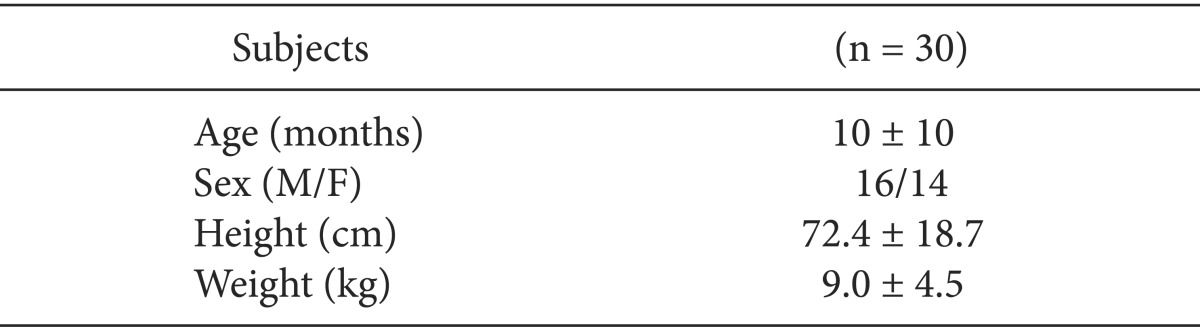
Patient Characteristics
The hemodynamic parameters including MAP, HR, CVP, CO and CI were not different between each different PIP (Table 2).
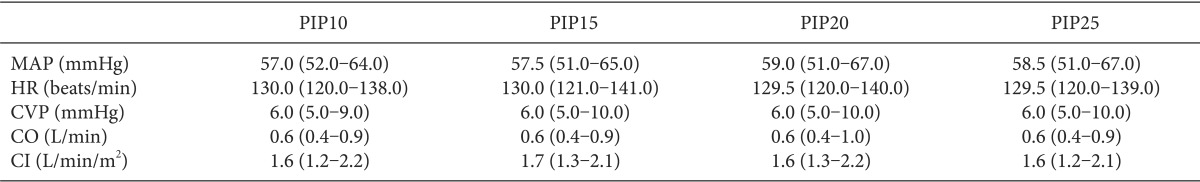
Comparisons of Hemodynamic Parameters
In the comparisons of SVV, the values measured at each different PIP were significantly different. SVV at PIP15 was larger than that at PIP10 (13.7 ± 2.9% at PIP10 vs 14.7 ± 2.5% at PIP15, P < 0.001) and SVV at PIP20 was larger than that at PIP10 and PIP15 (13.7 ± 2.9% at PIP10 vs 15.4 ± 2.5% at PIP20, P < 0.001; 14.7 ± 2.5% at PIP15 vs 15.4 ± 2.5% at PIP20, P < 0.001) and SVV at PIP25 was larger than that at PIP10 and PIP15 and PIP20 (13.7 ± 2.9% at PIP10 vs 17.4 ± 2.4% at PIP25, P < 0.001; 14.7 ± 2.5% at PIP15 vs 17.4 ± 2.4% at PIP25, P < 0.001; 15.4 ± 2.5% at PIP20 vs 17.4 ± 2.4% at PIP25, P < 0.001) (Table 3). And, the values showed a trend of increase according to increasing levels of PIP (Fig. 1).

Comparisons of Stroke Volume Variation
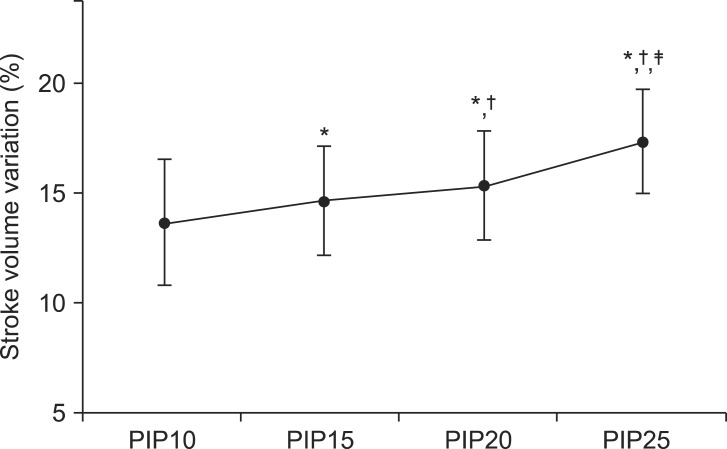
Stroke volume variation according to different peak inspiratory pressures. PIP10: peak inspiratory pressure 10 cmH2O, PIP15: peak inspiratory pressure 15 cmH2O, PIP20: peak inspiratory pressure 20 cmH2O, PIP25: peak inspiratory pressure 25 cmH2O. *P < 0.05, vs PIP10. †P < 0.05, vs PIP15. ‡P < 0.05, vs PIP20.
Discussion
In the present study, the main finding is that the SVVs at different PIPs, derived by the bioreactance technique after VSD repair in pediatric cardiac surgery patients, were significantly different to each other and tended to increase with increasing levels of PIP.
The exact determination of the patient's volume status and prediction of the fluid responsiveness in the management of critically ill patients, regardless of the patient's age, is an essential step in maintaining patients' hemodynamic stability. This process is very important because the prediction of whether a hemodynamically unstable patient will respond to fluid administration with an increase of SV and CO or not determines the initial treatment of the patient, that is, whether fluids or medications such as inotropics or vasopressors will be administered. However, as mentioned in the introduction previously, there are some factors to be considered in the assessment of the accuracy of the parameters for fluid responsiveness.
The tidal volume has been identified as an important factor that can affect the absolute values and accuracy of the parameters derived by heart-lung interaction with the respiratory cycle in adult patients for fluid responsiveness [10,15,16]. According to several articles, when the tidal volume of over at least 7-8 ml per ideal body weight (kg) is applied, the accuracy and predictability of these parameters may increase and the absolute values may increase with an increase in the level of the tidal volume [1,11,15,17].
In pediatric anesthesia, PCV is commonly used and has become the standard approach in many institutions because the use of volume-controlled ventilation is likely to result in hypoventilation due to the compliance of the breathing system which can reduce the delivered tidal volume significantly [18]. Modern anesthestic machines can measure small tidal volumes by flow sensors mounted on the ventilator circuit. However, the sensor for measuring the tidal volume is too heavy and large, so that it is difficult to apply to small pediatric patients because it can increase the anatomical dead space of a patient's airway. Therefore, the exact measurement of the tidal volume with the PCV mode in small pediatric patients might be difficult and this is the reason why we studied the effects of different PIPs rather than the effects of different tidal volumes. When the PCV mode is used for mechanical ventilation, the tidal volume is usually dependent on the patient's lung compliance. In small pediatric patients, chest/lung compliance might be relatively higher than that in adult patients [19]. Therefore, an increased PIP might result in an increase of the tidal volume, and the increased tidal volume may induce more fluctuations of the right and left ventricular SV compared to the actual volume status. In the present study, during the entire study protocol, the patients' volume status was constant because there were no changes of medication or fluid administration, and the hemodynamic parameters were not changed. Therefore, the increased SVV according to the increase of PIP in the same patients and with the same volume status might be associated with increased tidal volume. These results corresponded well with the studies previously conducted in animal models and adult patients [11,15,20].
The usefulness of parameters for fluid responsiveness in pediatric patients has already been demonstrated in previous reports [5,6,7,21,22,23]. However, there was some controversy about which parameter was the most appropriate to use. In some published articles, parameters based on pressure measurements were not suitable for pediatric patients because of the different arterial elastic properties of pediatric patients compared with adult patients [6,20,21]. Therefore, parameters related with the changes of aortic blood flow and velocity as measured by echocardiographic examination were shown to be adequate for pediatric patients. However, in various clinical situations, echocardiographic examination of all patients who need a decision to be made as to whether or not the patient will respond to a fluid challenge is difficult. In addition, the SV determined by the bioreactance technique is calculated with the phase shift which is induced by changes in the blood volume in the aorta rather than changes of the arterial pressure; furthermore, this is a non-invasive technique. Although CO and SV derived by the bioreactance technique tended to be lower than the normal range in small children [24], SVV as measured by the bioreactance technique was confirmed to be a proper parameter to predict the fluid responsiveness in pediatric patients [25] and our primary outcome was the effects of different PIP levels on the absolute SVV values rather than the evaluation of the validation of SVV by the bioreactance technique for fluid responsiveness. Therefore, we used the bioreactance technique in the present study and we focused on the differences in and the changes of the absolute values of SVV.
This study had limitation. In the present study, any other intervention to distinguish responders and non-responders according to fluid administration was not performed. If there were more responders, the changes of SVV resulted from increase of PIP would be more, and if there were more non-responders, the changes of SVV resulted from increase of PIP would be less. Further studies for the effects of PIP on SVV according to patient's exact volume status are needed.
In conclusion, SVV is affected by different levels of PIP in the same patient with the same volume status. This finding must be regarded when SVV is used to predict the fluid responsiveness in mechanically ventilated pediatric patients. Namely, in various clinical practice, when the value of SVV changed, the level of PIP should be confirmed whether the same state or not before any other treatment for volume management.
Acknowledgments
This work was supported by Konkuk University.