The effects of an insulin-glucose-potassium (IGK) pretreatment on the bupivacaine cardiotoxicity
Article information
Abstract
Background
The purpose of this study is to evaluate the effect of an IGK pretreatment on the cardiotoxicity of bupivacaine.
Methods
Twenty-one anesthetized mongrel dogs were randomly divided into the following three groups: the control group (CG, n = 7), the treatment group (TG, n = 7) and the pretreatment group (PTG, n = 7). For the 30 min of pretreatment period, CG and TG received normal saline, while PTG received an IV bolus of insulin 2 U/kg, followed by an IGK infusion (2 U/kg/hr of insulin, 0.5-1.5 g/kg/hr of glucose, 1-2 mEq/kg/hr of KCl). The bupivacaine infusion was started at the rate of 0.5 mg/kg/min in all groups after the pretreatment period. CG received normal saline only. In TG, insulin (2 U/kg) was injected simultaneously with bupivacaine infusion, followed by the IGK infusion as with PTG. The hemodynamic variables and the time duration to reach the mean arterial pressure (MAP) of 60 mmHg were compared.
Results
The bupivacaine infusion decreased the cardiac index, MAP, and heart rate in all three groups. Although insulin concentration was higher in TG than in PTG during bupivacaine infusion, the hemodynamic variables in PTG decreased at the slowest rate. The time taken to reach MAP of 60 mmHg in PTG, TG, and CG was 51.4 ± 8.5, 36.4 ± 9.6, and 27.1 ± 8.7 min, respectively (P < 0.05).
Conclusions
IGK delays the bupivacaine-induced cardiac depression. However, a pretreatment with IGK is more effective in delaying the bupivacaine-induced hypotension than simultaneous administration, regardless of insulin concentration.
Introduction
Bupivacaine is an amide-type local anesthetic that is widely used in regional anesthesia and pain management. When bupivacaine is accidentally injected into the blood vessel, serious cardiovascular complications can occur, including cardiac depression, ventricular tachycardia, asystole, and electromechanical dissociation, which are often refractory to conventional treatment [1]. Bupivacaine blocks the Na+ channels during the action potential and also inhibits the transient outward K+ current (Ito) [2,3]. Bupivacaine interferes with the effective utilization of Ca2+ [4-6]. It also impairs the energy metabolism in a cell [7-9] and causes cardiotoxicity by interfering with the mitochondrial energy transduction [10,11].
Insulin-glucose-potassium (IGK) has been reported to be effective in recovering the cardiac depression induced by a bupivacaine infusion [12,13]. Insulin was reported to have a positive inotropic effect in levobupivacaine-induced cardiac depression [14]. The effects of IGK can be explained by an increase in the transient outward K+ current (Ito) [15] and Ca2+ transport activity of the sarcoplasmic reticulum [16].
The metabolic effects of insulin has been reported to be another mechanism for the effects of IGK on bupivacaine-induced cardiotoxicity [17]. Insulin can increase the cytoplasmic glucose concentration and pyruvate availability to the mitochondria, thereby improving the myocardial energetics and performance [18]. In addition, a pretreatment with IGK has been reported to have a beneficial effect on ischemia by increasing the intracellular glycogen content and decreasing the cardiotoxic plasma free fatty acid [19,20]. However, the effects of an IGK pretreatment on the bupivacaine-induced cardiotoxicity have not been studied.
It was hypothesized that IGK administered before the bupivacaine infusion would be more effective in reducing the bupivacaine-induced cardiotoxicity than when administered simultaneously with the bupivacaine, as IGK requires time to take its metabolic effects. The aim of this study was to evaluate the effects of an IGK treatment and IGK pretreatment on bupivacaine-induced cardiotoxicity.
Materials and Methods
The Animal Care and Use Committee of Seoul National University Hospital approved this study. Twenty-one male mongrel dogs were randomly allocated into three groups: the control group (CG; 23.3 ± 3.7 kg, n = 7), the treatment group (TG; 22.2 ± 3.8 kg, n = 7), and the pretreatment group (PTG; 25.7 ± 4.3 kg, n = 7).
The dogs were fasted overnight but were given free access to water. Anesthesia was induced with sodium pentobarbital 25 mg/kg IV and maintained with a continuous infusion of 5 mg/kg/hr. After the trachea was intubated with an ID 8.0 mm cuffed endotracheal tube, the lungs were ventilated with 60% oxygen in air and adjusted to maintain PaCO2 35-45 mmHg. Vecuronium 0.2 mg/kg was then injected followed by 0.02 mg/kg at 30 min intervals, in order to prevent spontaneous ventilation or movement. A lactated Ringer's solution was infused at a rate of 5 ml/kg/hr throughout the experiment. The core temperature was maintained at between 36-38℃, using a warming blanket and heated fluids.
Both femoral arteries were cannulated with two 20-gauge catheters to continuously monitor the arterial pressure and allow blood sampling. Two intravenous catheters were placed in each antecubital vein for fluid and drug administration (one for phentobarbital and the other for the other drugs except bupivacaine). A fiberoptic pulmonary artery catheter (Opticath®, Model P7110-EH, Abbott, Chicago, IL) was inserted through the right external jugular vein to monitor the central venous pressure (CVP) and measure the cardiac index (CI), using the thermodilution method. The systemic vascular resistance index (SVRI) was calculated using a standard formula. The cardiac rhythm and heart rate (HR) were monitored continuously using the standard lead II of the electrocardiogram.
All the dogs had a 30 min of stabilization period before the start of the experiment. For the 30 min pretreatment period, the dogs in CG and TG received an IV bolus of 1 ml/kg of normal saline followed by an infusion of 4 ml/kg/hr. PTG received 2 U/kg of regular insulin (Novolin® R, Novo Nordisk, Denmark), followed by an infusion of insulin at a rate of 2 U/kg/hr. At the same time, 0.5-1.5 g/kg/hr of glucose and 1-2 mmol/kg/hr of KCl were infused to maintain euglycemia and normokalemia, respectively. The rate of the glucose infusion was adjusted to maintain euglycemia (70-150 mg/dl), according to the blood glucose level (Surestep, Lifescan Inc., USA).
After the pretreatment period, the 0.5% bupivacaine infusion (Bupivacaine HCL Inj., Myungmun Pharmacy, Korea) was initiated at a rate of 0.5 mg/kg/min through a central venous catheter. The infusion of normal saline was continued in CG. In TG, the normal saline infusion was stopped, and insulin 2 U/kg was injected, followed by an infusion of IGK using the same method as with PTG. In PTG, the IGK was infused continuously throughout the experiment. Sodium bicarbonate was infused at a rate of 2-4 mEq/kg/hr through a peripheral venous catheter to maintain an arterial pH of 7.35-7.45. Bupivacaine was infused until the mean arterial pressure (MAP) had decreased to 60 mmHg or less for at least 10 consecutive seconds (Fig. 1). All the dogs were sacrificed with KCl injection after the experiment.
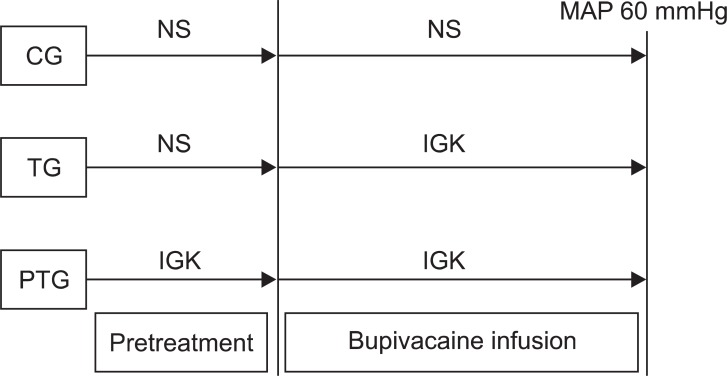
The experimental design. NS: normal saline, IGK: insulin-glucose potassium, CG: control group, TG: treatment group, PTG: pretreatment group, MAP: mean arterial pressure.
The hemodynamic variables and ECG intervals (PR interval, QRS duration, and QTc interval) were recorded at the baseline, at the start of the bupivacaine infusion, and every 5 min until a MAP of 60 mmHg had been reached. Arterial blood samples were obtained each time to analyze the blood gas, potassium, glucose, epinephrine, norepinephrine, insulin, and bupivacaine concentration. The blood samples for the catecholamine, insulin and bupivacaine concentration were centrifuged at 3,000 rpm for 20 min (Allegra™ 6R centrifuge, Beckman, USA) and stored at -50℃ until analyzed. The bupivacaine and catecholamine concentrations were measured by high-performance liquid chromatography. The plasma concentration of insulin was measured by a radioimmunoassay using the porcine insulin antibody.
The data is expressed as the mean ± standard deviation, and was analyzed using SPSS (SPSS Inc., Chicago, IL). One-way analysis of the variance and the Tukey test were used to determine the differences between the groups. The comparison between groups was omitted when the number of dogs in any group was less than 5. The number of dogs remaining in each group with time was compared using a Fisher's exact test. The change over time within each group was evaluated using repeated measures analysis of the variance. The plasma insulin concentration in TG and PTG was compared using a Student's t-test. P value < 0.05 was considered significant.
Results
There was no significant difference between the three groups with regard to weight and the hemodynamic variables at the baseline and at the start of bupivacaine infusion. The bupivacaine infusion decreased the CI, HR and MAP in all the dogs. However, the CI in PTG decreased at the slowest rate, compared with CG and TG. The MAP in CG was maintained at the baseline level for 5 min, then decreased abruptly and earlier than the other groups. Compared with CG and TG, the SVRI in PTG increased slowly during the bupivacaine infusion (Fig. 2). Fig. 3 shows the number of dogs remaining in each group.

Sequential change of hemodynamic parameters. CG: control group, TG: treatment group, PTG: pretreatment group, SVRI: systemic vascular resistance index. *P < 0.05 vs. CG, †P < 0.05 vs. TG, ‡P < 0.05 vs. value at BI.
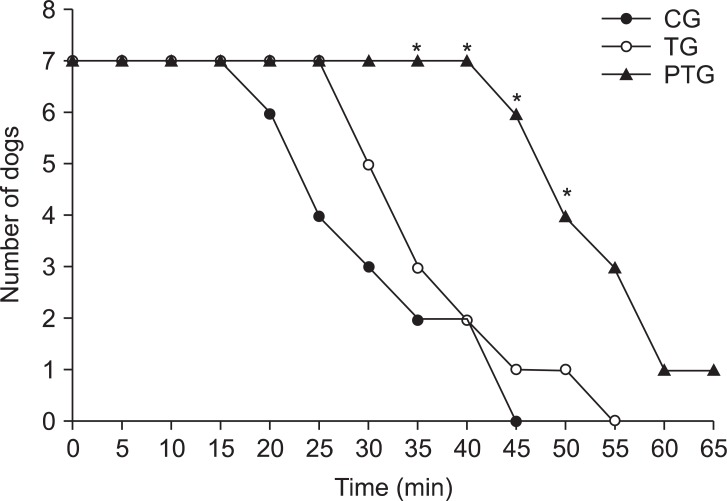
Number of dogs in the course of the bupivacaine-induced cardiovascular collapse. The dogs were excluded from each group when the mean arterial pressure was decreased by the bupivacaine infusion to 60 mmHg. CG: control group, TG: treatment group, PTG: pretreatment group. *P < 0.05 survival rate different from CG or TG.
The data at the end of the experiment (MAP 60 mmHg) were shown in Table 1. The time for the bupivacaine infusion was significantly longer in PTG than in TG, and longer in TG than in CG. The bupivacaine concentration in PTG was higher than that in CG. There was no difference in insulin concentration between PTG and TG, at the end of the experiment.

Mean Values of Parameters at the End of Experiment
Although the insulin concentration in TG was lower than in PTG at the start of the bupivacaine infusion, the insulin concentration in TG increased and was higher than that of PTG from 5 min to 20 min after the bupivacaine infusion (P < 0.05). After 25 min, the insulin concentrations in TG and PTG were similar. The serum potassium, blood glucose, and catecholamine levels were similar in the groups throughout the study (Table 2). The blood gas was maintained at the physiological level without any significant differences between the three groups (pH 7.31-7.49, PaO2 298-380 mmHg, PaCO2 33-43 mmHg).
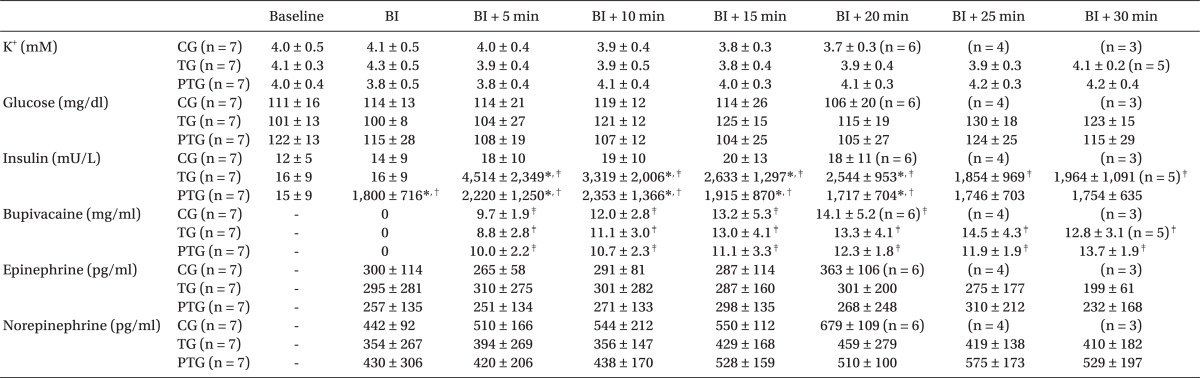
Sequential Changes of Laboratory Parameters
All the dogs had normal sinus rhythm before the bupivacaine infusion. Arrhythmias (A-V block, junctional rhythm, or ventricular ectopy) were detected between 15 min and 30 min in 2 dogs in CG and 1 dog in TG. However, arrhythmia appeared 35 min after the bupivacaine infusion in 2 dogs in PTG (Fig. 4). Bupivacaine increased the PR interval, QRS duration, and QTc intervals in all groups. The QRS duration in CG and TG were prolonged after 5 min, whereas it was prolonged after 10 min in PTG (Table 3).

Electrocardiographic changes occurring during the bupivacaine infusion. A-V block, ventricular ectopy, and large S-wave appeared 20 min after the bupivacaine infusion in the #5 dog of CG. Decrease in the MAP to 60 mmHg occurred 25 min after the bupivacaine infusion. In the #3 dog of TG, the first arrhythmia appeared 30 min after the bupivacaine infusion, and the MAP decreased to 60 mmHg 37 min after the bupivacaine infusion. In the #2 dog of PTG, the first arrhythmia occurred 35 min after the bupivacaine infusion, and the MAP decreased to 60 mmHg 50 min after the bupivacaine infusion. CG: control group, TG: treatment group, PTG: pretreatment group.
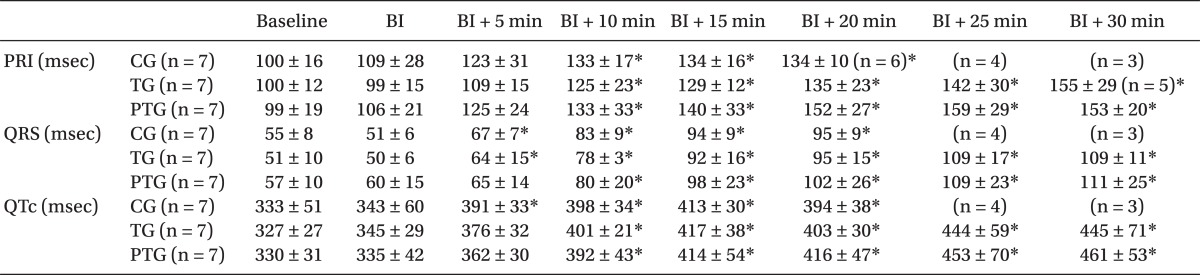
Sequential Changes of ECG Parameters
Discussion
This study shows that IGK can delay the bupivacaine-induced cardiac depression. Furthermore, the administration of IGK before the bupivacaine infusion is more effective in delaying the bupivacaine-induced cardiotoxicity than the simultaneous administration of bupivacaine with IGK.
IGK could delay the deterioration in the hemodynamics during bupivacaine-induced cardiotoxicity. However, the effects of the IGK pretreatment cannot be fully explained by these mechanisms. The hemodynamic onset time of insulin is approximately 2-5 min, and the insulin concentration was higher in TG than in PTG for 20 min after the bupivacaine infusion. However, the effect against bupivacaine-induced cardiac toxicity is greater in PTG than in TG. Therefore, it is possible that the additional effect of the IGK pretreatment originated from the 30 min pretreatment period. In addition to the direct hemodynamic effect, IGK has a beneficial effect on the energy metabolism in the cell influenced by bupivacaine. Insulin can supply the cardiomyocytes with an alternative energy substrate with more efficient utilization of oxygen. It was assumed that the additional IGK effects such as the metabolic effect would require time. There is a delay in the onset of insulin action. It takes approximately 30 min for insulin to significantly increase the cellular glycogen level and decrease the plasma free fatty acids [21-23]. In fact, the beneficial hemodynamic effect of IGK is reported to be associated with the increase of certain m RNA expression [24].
Under stress conditions, such as drug poisoning induced cardiovascular collapse, the cells are forced to become carbohydrate dependent. Theoretically, there would be increased tolerance to hypoxia if the glycogen content could be increased, and thereby increase the amount of substrate for the anaerobic metabolism. The administration of glucose prior to anoxia has been shown to increase the glycogen concentration and consequently the energy available [25]. The relationship between the beneficial effects of an IGK pretreatment and the glycogen content can be found in patients undergoing mitral valve replacement [26].
During the ischemic condition, high concentrations of plasma-free fatty acids increase the myocardial oxygen requirement, and depress the myocardial performance [27]. Some metabolites of free fatty acids also cause arrhythmia, possibly because they exert some toxicity to the cellular membrane [20]. An infusion of IGK reduces the free fatty acid levels by promoting their esterification into plasma triglycerides [28], which can have a protective effect [29]. Insulin requires time to reduce the free fatty acids.
The acute administration of insulin can stimulate the centrally-mediated sympathetic activity in both animals and humans [30]. However, in this study, the epinephrine and norepinephrine concentrations were similar in the three groups. Therefore, we believe that the positive inotropic effect of insulin is not associated with the release of catecholamine.
There was a difference in the insulin concentration levels of PTG and TG during the first 20 min of bupivacaine infusion. It is due to the pharmacokinetic characteristic of insulin. The bolus injection abruptly increased insulin concentration, and it steadily reached the equilibrium state with continuous insulin infusion. Therefore, insulin concentration in TG was higher than in PTG during bupivacaine infusion, even though the total administered dose was larger in PTG than in TG. The insulin concentration in PTG had already reached the equilibrium during the 30 min of pretreatment period.
There are some limitations in explaining the effects of the IGK pretreatment in this study. First, the intracellular glycogen and plasma-free fatty acid concentrations were not measured. Second, the amount of administered insulin was different between TG and PTG. However, it can be extrapolated that there are some pretreatment effects, because the insulin concentration was higher in TG than in PTG during bupivacaine infusion. Third, in this experiment setting, the dogs were anesthetized and bupivacaine was infused continuously. Therefore, caution needs to be taken when extrapolating this conclusion of the effects of IGK to humans.
In conclusion, although both the prior and simultaneous administration of IGK can delay the bupivacaine-induced cardiac depression, the prior administration of IGK has a superior effect in delaying the bupivacaine-induced cardiac toxicity over the concurrent treatment. This implicates that hyperinsulinemia before bupivacaine administration can mitigate the bupivacaine cardiotoxicity. Further work on the mechanism of insulin pretreatment is needed.
Acknowledgments
This study was supported by Seoul National University Hospital 04-2006-0900.