Effects of inspired oxygen fraction in discriminating venous from arterial blood in percutaneous central venous catheterization under general anesthesia
Article information
Abstract
Background
A low fraction of inspired oxygen (FiO2) increases venous deoxygenated hemoglobin concentrations, making the color of the blood darker. The present study was aimed to determine the effects of FiO2 on the ability to discriminate venous from arterial blood.
Methods
One-hundred and sixty surgical patients undergoing percutaneous central venous access of the internal jugular vein were randomly assigned to receive an FiO2 of 0.2, 0.4, 0.6, or 1.0 (n = 40 each) for at least 20 min prior to central line placement under general anesthesia. Vascular access was achieved with a 22-gauge needle; 2 ml of blood was withdrawn and shown to three physicians including the operator. Each of them was asked to identify the blood as 'arterial', 'venous' or 'not sure'. Simultaneous blood gas analysis of the samples was performed on blood taken from the puncture site and the artery after visual comparison to confirm blood's origin and hemodynamic measurements.
Results
Lowering FiO2 progressively increased venous deoxygenated hemoglobin concentrations (2.24 ± 1.12, 3.30 ± 1.08, 3.66 ± 1.15, and 3.71 ± 1.33 g/dl) in groups having an FiO2 of 1.0, 0.6, 0.4 and 0.2, respectively (P < 0.001), thereby facilitating the 'venous' blood identification (P < 0.001). Neither heart rate nor mean arterial pressure differed among the groups. None developed hypoxemia (percutaneous hemoglobin oxygen saturation < 90%) in any group during the study period.
Conclusions
A low FiO2 increases venous deoxygenated hemoglobin levels, thereby facilitating the recognition by clinicians of its venous origin in percutaneous central venous catheterization under general anesthesia.
Introduction
Central venous catheterization is widely used for extended intravenous (i.v.) drug administration, fluid resuscitation, parenteral nutrition, emergent cardiac pacing, dialysis and central cardiovascular monitoring. Unfortunately, it has been associated with many acute and long-term complications [1,2]. Among them are inadvertent arterial puncture with unplanned arterial dilations or cannulations [3], severe morbidity and mortality rates of which have been reported [4]. One may verify an arterial puncture during needle localization of the internal jugular vein (IJV) by blood color [5]. Blood assumes a darker color as the amount of deoxygenated hemoglobin increases: at 5 g/dl in the capillaries, cyanosis is apparent in a fair-skinned person [6].
Oxygen consumption, especially in brain, is decreased in the presence of anesthesia [7,8]. In addition, changes in respiratory function may require oxygen supplementation [fraction of inspired oxygen (FiO2) > 60%] in patients under general anesthesia [9]. Both of these factors in anesthetized patients may increase oxygen tension of central venous blood with less deoxygenated hemoglobins, and hence the blood would be less dark and less discriminating. Thus, the reduction of FiO2 under general anesthesia while placing central venous catheters would be helpful in discriminating venous from arterial blood. Although the examination of blood color is something all clinicians do as part of their routine, it has never been tested in relation to use of a lower FiO2 during needle localization of the IJV in a prospective fashion. The present study was aimed to evaluate the effects of different FiO2s on the ability to discriminate venous from arterial blood in patients undergoing central venous catheterization under general anesthesia.
Materials and Methods
The protocol was approved by the institutional review board and informed consent was obtained from each patient. One hundred and sixty American Society of Anesthesiologists physical status I-III adult surgical patients, undergoing percutaneous central venous access of the IJV, were studied. Exclusion criteria were all other central venous access techniques and all other vessels, atrial septal defects, emergency surgery, current treatment with cardio-active drugs and age < 18 or > 70 years. Percutaneous hemoglobin oxygen saturation (SpO2) was measured continuously using pulse oximetry. Patients who developed a pulse oximetry reading of SpO2 < 90% during the period of study were also excluded.
All patients were premedicated with midazolam (0.1 mg/kg) orally 60 min before the induction of anesthesia. Upon arrival in the operating room, Ringer's lactate solution was initiated at a rate of 10 ml/kg/h. A 20-gauge catheter was placed into a radial artery to continuously monitor blood pressure and to take blood samples for arterial blood gas analysis.
After preoxygenation, anesthesia was induced with i.v. administration of 5-7 mg/kg thiopental sodium, 2-3 µg/kg of fentanyl and 0.8 mg/kg of rocuronium, and maintained with 1.2% to 2.0% sevoflurane (inspired) following tracheal intubation. Patients were randomly assigned to receive an FiO2 of either 1.0, 0.6, 0.4 or 0.2 (n = 40 each) initiating immediately after intubation. Patients' lungs were mechanically ventilated to maintain an end-tidal carbon dioxide (CO2) tension between 35 and 40 mmHg with a fresh gas flow of 4 L/min. After induction of anesthesia, all patients were placed into the 15 to 30° Trendelenburg position and then we attempted to locate the vein with a searching needle after sterile skin preparation. We maintained the designated FiO2 at least 20 min prior to and throughout the procedure. The right IJV was typically selected for access; when attempts failed, the left IJV was selected.
All physicians followed the same basic procedure of using a 22-gauge searching needle to locate the IJV and 2 ml of blood was withdrawn. The blood samples within the syringe were displayed to three inspectors including the operator in random order under operating room light conditions immediately after collection. Each of them was asked to identify whether the blood was 'arterial', 'venous' or 'not sure' and their responses were recorded. Immediately thereafter, the color of blood sampled from the searching needle was directly compared with that taken from a previously inserted arterial catheter and then blood gas analysis of both samples were done using a blood gas/electrolyte analyzer (GEM® Premier 3000, Instrumentation Laboratory, Lexington, USA) to confirm the location of the searching needle, and to measure oxygen and carbon dioxide tensions, oxygen saturation and pH. Hemoglobin concentrations using the Hematology System (ADVIA 120, Bayer Healthcare LLC, NY, USA) to calculate reduced hemoglobin concentration by subtracting oxygenated from total hemoglobin concentrations, and arterial blood pressure and heart rate (HR) were also measured. In patients whose blood from the searching needle turned out to be arterial by comparing with in situ arterial blood and blood gas analyses, the procedure was continued until venous blood was obtained.
A central venous catheter was then inserted using the Seldinger technique by physicians who ranged in experience from resident physicians in their second year of anesthesia training to consultants with 30 year of anesthesia experience. Catheter-tip location was checked by X-ray with a final destination in the superior vena cava, outside the pericardium, to avoid the danger of complications such as cardiac tamponade. Monitoring included electrocardiogram, pulse oximetry, invasive blood pressure, end-tidal CO2 and central venous pressure.
The sample size was calculated based on our preliminary data of deoxygenated hemoglobin (n = 5 each) using G*Power 3.1.2 [10]. The observed main effect was F = 2.66, effect size f = 0.338 and power 0.95. Thus, a sample size of 39 patients was suggested in each group.
Data are expressed as number or means ± SD. They were analyzed using StatView software version 4.0 (Abacus Concepts, CA, USA) on a Macintosh computer. Categorical data were analyzed using a Fisher's exact-test. Other data were compared among the groups using one-way analysis of variance followed by Scheffè's post-hoc testing as required. A P value of < 0.05 was considered statistically significant.
Results
There were no significant differences among the groups with respect to sex ratio, age, height or weight (Table 1). One-hundred and seventy-five punctures were performed for 160 patients, in which 15 (8.6%) were repeated because of arterial puncture.
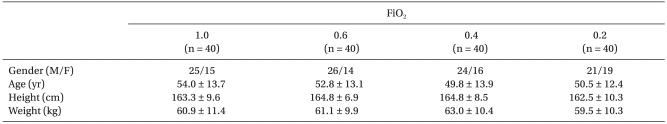
Demographic Characteristics
Decreasing FiO2 from 1.0 caused a progressive decrease in central venous oxygen saturation (SvO2): 82.4 ± 8.3, 75.2 ± 7.9, 71.2 ± 8.6 and 70.8 ± 10.1% in the groups breathing 100, 60, 40 and 20% oxygen, respectively (P < 0.001). The concentrations of deoxygenated hemoglobin were 2.24 ± 1.12, 3.30 ± 1.08, 3.66 ± 1.15 and 3.71 ± 1.33 g/dl, respectively. Eleven patients (27.5%) in group 1.0 and one each in the 0.6 and 0.4 groups had deoxygenated hemoglobin levels less than 1.5 g/dl (P < 0.001). Neither HR nor mean arterial blood pressure differed among the groups (Table 2). Decreasing FiO2 was associated with an increased incidence of venous blood identification (P < 0.001). Diagnostic accuracy (i.e., sensitivity) to identify the venous blood as venous by all three inspectors was 82.5% in group 0.2, 77.5% in group 0.4 and 72.5% in group 0.6 versus vs. 37.5% in group 1.0 (P < 0.001; Fig. 1).
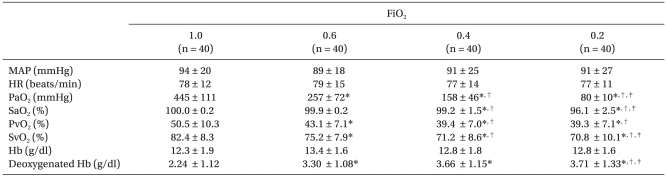
Hemodynamic Data and Arterial and Central Venous Blood Gas Values
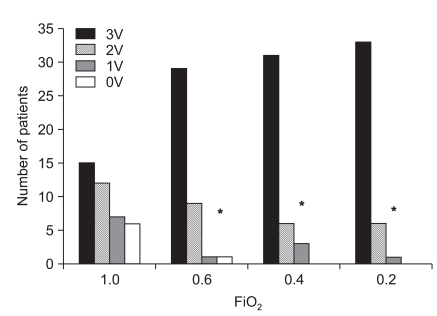
Distribution of the number of patients identified by three, two or one inspectors in patients receiving different inspired oxygen fractions (FiO2) during central line placement. 3V, 2V, 1V and 0V represent 3, 2, 1, and 0 physicians discriminated venous as venous blood, respectively. *P < 0.001 compared with 1.0.
Discussion
Although life-threatening events are rare in percutaneous central venous catheterization, the technical complication rates have ranged from 3-25% in patients [1,2], with inadvertent arterial puncture rates being as high as 8% [11]. Recommended measures to verify arterial puncture during needle localization of the central vein (i.e., venous verification technique) include observation of blood flow and color [5], manometry [12], blood gas analysis [3,13] and real-time ultrasound imaging [14-17]. However, pressure monitoring can be misleading because the Teflon catheter may kink as it is advanced over the needle into the artery and provide a dampened tracing that resembles a venous waveform. Introduction of air bubbles into the arterial circulation can also occur with this method. Blood gas analysis is time-consuming. In addition, in anesthetized patients whose lungs are being ventilated with FiO2 > 0.6 (and especially in those whom cardiac output is increased) central venous oxygen tension could be greater than 100 mmHg [7]. Recently, ultrasound imaging for central venous catheter placement has gained popularity because of its benefits, including rapid vein localization, a reduction in needle attempts, and fewer complications (i.e., carotid artery puncture) [14-17]. In particular, real-time ultrasound evaluation provides a comprehensive assessment of venous structures and aids practitioners with limited experience as well as catheterization of patients with difficult anatomy [14]. Indeed, recent data with the ultrasound-guided technique demonstrates that only a single-stick is required in 98.5% of IJV cannulations and that the risk of arterial puncture is 0.3% [18]. However, inadvertent arterial penetration and dilation still remains a problem despite ultrasound guidance and can result in significant morbidity and even mortality [19]. Moreover, this technique requires a sophisticated instrument and additional time.
A blood color test is simple, efficient and safe but subjective, especially if the patient is receiving supplemental oxygen during the insertion procedure. Although it has been traditionally assumed that 5 g of deoxygenated hemoglobin per dl of capillary blood is required for the detection of cyanosis, mild cyanosis can clearly be observed at lower values [6,20]. Likewise, the color of the venous blood becomes darker as deoxygenated hemoglobin concentrations increase. In the present study, a FiO2 below 0.6 significantly increased deoxygenated hemoglobin concentrations in the central venous blood (47% at FiO2 0.6, 63% at FiO2 0.4 and 66% at FiO2 0.2, as compared with a FiO2 value of 1.0 (P < 0.001) and thereby facilitated the discrimination of venous from arterial blood. We would recommend administering the lowest FiO2 (below 0.6) during central line placement under general anesthesia, if pulse oximeter readings are within an acceptable range (SpO2 > 90%). This approach should help reduce unplanned arterial dilations or cannulation, especially in a situation when ultrasound is not available.
In the present study, progressive lowering of FiO2 from 1.0 to 0.2 only modestly decreased SvO2 in the central vein, despite a marked decrease of PaO2. This finding may be explained by the sigmoid shape of the oxyhemoglobin dissociation curve: the arterial blood oxygen content will be on the flat part of the dissociation curve for a FiO2 greater than 0.21 (our lowest FiO2). Nevertheless, deoxygenated hemoglobin concentrations in the central vein increased by 63% and 66% at a FiO2 of 0.4 and 0.2, respectively, as compared with the value at 1.0 (P < 0.001). The greater the deoxygenated hemoglobin contents as FiO2 decreases, the more readily venous blood will be discriminated from the arterial blood (Fig. 1). This hypothesis is supported by a previous study which demonstrated an apparent central cyanosis at deoxygenated hemoglobin concentrations of 1.5 g/dl or more, with a threshold of 1.0-1.5 g/dl [19]. Indeed, none in the FiO2 0.2 group, whereas 11 patients (27.5%) in the FiO2 1.0 group, had deoxygenated hemoglobin concentrations less than 1.5 g/dl.
However, the blood color test may be affected by multiple factors including hemoglobin content, lighting and interobserver variation. Moreover, in patients with high cardiac output, both arterial and venous blood would be red in spite of a low FiO2. In contrast, in patients with profound hypotension or marked arterial oxyhemoglobin desaturation, arterial puncture is not easy to identify by the pulsatile flow into the syringe and the bright-red color of the blood. Therefore, assessing the blood sample by visual inspection may not be at all definitive in every patient. Since there is no single unequivocal best modality to locate the central vein, although ultrasound imaging and manometry are becoming standards of practice, familiarity with multiple techniques is advisable.
It is a standard practice to administer a FiO2 of 1.0 to maximize the oxygen reserve during induction of and emergence from anesthesia [8]. In the present study, we administered 100% oxygen until the time of endotracheal intubation. In addition, SpO2 was monitored throughout the study to avoid unacceptable desaturation (SpO2 < 90%), and no one developed hypoxemia in any group. Nevertheless, hypoxemia may occur in patients whose hemodynamics are unstable during the induction of anesthesia, especially in the low FiO2 group. A low FiO2 technique should therefore be recommended in clinically safe patients.
In conclusion, the administration of low oxygen fraction (FiO2 < 0.6) during catheterization increased deoxygenated hemoglobin concentrations and made the color of the central venous blood darker, facilitating the recognition by clinicians of its venous origin. This technique is easy to perform and may help to determine proper placement in percutaneous central venous catheterization, diminishing the risk of arterial injury from unplanned arterial dilations or cannulas. Nevertheless, discrimination using blood color is not at all definitive and there is no single unequivocal best modality to locate the central vein, and thus familiarity with multiple techniques is advisable.