A comparison of the breathing apparatus deadspace associated with a supraglottic airway and endotracheal tube using volumetric capnography in young children
Article information

Abstract
Background
Supraglottic airway (SGA) devices including the air-Q® are being used with increasing frequency for anesthesia in infants and younger pediatric patients. To date, there is minimal research documenting the potentially significant airway deadspace these devices may contribute to the ventilation circuit when compared to an endotracheal tube (ETT). The aim of this study was to evaluate the airway apparatus deadspace associated with an air-Q® versus an ETT in young children.
Methods
In a prospective cohort study, 59 patients between 3 months and 6 years of age, weighing between 5 and 20 kg, scheduled for outpatient urologic or general surgery procedures were recruited. An air-Q® or ETT was inserted at the discretion of the attending anesthesiologist, and tidal volume, positive end expiratory pressure, respiratory rate, and end-tidal CO2 were controlled according to protocol. Airway deadspace was recorded using volumetric capnography every 2 min for 10 min.
Results
Groups were similar in demographics. There was a significant difference in weight-adjusted deadspace volume between the air-Q® and ETT groups, 4.1 ± 0.8 ml/kg versus 3.0 ± 0.7 ml/kg, respectively (P < 0.001). Weight-adjusted deadspace volume (ml/kg) increased significantly with decreasing weight for both the air-Q® and ETT groups.
Conclusions
In healthy children undergoing positive pressure ventilation for elective surgery, the air-Q® SGA introduces significantly greater airway deadspace than an ETT. Additionally, airway deadspace, and minute ventilation required to maintain normocarbia, appear to increase with decreasing patient weight irrespective of whether a SGA or ETT is used.
Introduction
Supraglottic airway (SGA) devices including the air-Q® (Cookgas, USA) are being used with increasing frequency for elective anesthesia in infants and younger pediatric patients [1,2]. Although SGAs are presumed to contribute greater deadspace volume to the ventilation circuit when compared to endotracheal tubes (ETT), there has been minimal research that quantifies that difference. This information is relevant in very young patients breathing spontaneously through these devices, who may be unable to generate sufficient tidal volumes to compensate for this added deadspace over time, and in those undergoing positive pressure ventilation who may require increasing levels of support to maintain adequate levels of ventilation [3,4].
Volumetric capnography is a technique that can be used to accurately evaluate airway deadspace by monitoring the concentration of exhaled carbon dioxide (CO2) over the course of a respiratory cycle [5]. Exhaled CO2 is plotted against exhaled volume, and from the resulting waveforms, alveolar partial pressure of carbon dioxide (PaCO2) and mean exhaled partial pressure of carbon dioxide can be calculated and used to determine airway deadspace [6]. Compared to prior methods that require use of a Douglas bag or calorimetry, volumetric capnography is faster, less cumbersome, and more easily applied clinically [7]. With this technology, it is thus possible to measure the apparatus and airway deadspace noninvasively and in real time.
The primary aim of this study was to compare the magnitude of the airway and apparatus deadspace associated with the use of an ETT or air-Q® SGA using volumetric capnography in young children undergoing general anesthesia and surgery. Additionally, our primary hypothesis was that airway and apparatus deadspace, normalized by weight, is significantly higher in young infants and children when using an air-Q® SGA when compared to the airway and apparatus deadspace associated with an ETT. Our null hypothesis was that there is no difference in deadspace volume between devices.
Materials and Methods
Patient selection
This study was approved by the Institutional Review Board at the Wake Forest University Health Sciences (IRB00055260) and was registered on ClinicalTrials.gov prior to beginning recruitment (NCT03785977; 12/24/2018; PI-Templeton TW). Written informed consent from a parent/legal guardian was obtained for participation in this study. This manuscript adheres to the applicable Transparent Reporting of Evaluations with Nonrandomized Designs (TREND) guidelines. Further, this clinical study was performed in accordance with Ethical Principles for Medical Research involving Human Subjects, outlined in the Helsinki Declaration of 1975 (revised 2013).
Pediatric patients between the ages of 3 months and 6 years, weighing between 5 and 20 kg, and scheduled for outpatient urologic or general surgery procedures, were identified for participation in the preoperative holding area. All procedures were performed in the pediatric operating room at Brenner Children’s Hospital, Wake Forest Baptist Medical Center from March 2019 to August 2019. Exclusion criteria included: patients with a history of difficult airway/intubation (defined as greater than two attempts at intubation or having required any unanticipated or secondary intubating technique other than direct or elective video laryngoscopy in the past) or those suspected to have a difficult airway; morbid obesity (body mass index > 39 kg/m2); history of prematurity; asthma or second-hand smoke exposure; patients with upper respiratory infection symptoms such as nasal drainage, cough, or fever within 7 days of the date of surgery; American Society of Anesthesiologists physical status ≥ 3; and emergency case status. The attending anesthesiologist responsible for the care of the patient was consulted to ensure the patient met none of the aforementioned exclusion criteria, and that the chosen airway management strategy was consistent with deficits in the respective size groups to avoid over-recruiting for a given group. Neither the patient care team nor the research team was blinded to the study group.
Intraoperative management
Patients were taken to the operating room, where standard monitors were applied, including pulse oximetry, electrocardiogram, blood pressure, temperature, capnography, and end-tidal gas analysis. Induction of anesthesia was carried out with sevoflurane in oxygen or oxygen/nitrous oxide. Intravenous access was obtained. Each patient was administered a standardized relaxant dose of 0.7 mg/kg rocuronium. Airway management and selection of airway device were at the discretion of the patient’s clinical care team and had been determined prior to consent for participation.
In the case of patients who received an ETT, the airway was secured and the patient was subsequently placed on the anesthesia ventilator (Avance CS2®, GE Healthcare, USA) using pressure control ventilation to deliver a tidal volume of 10 ml/kg at a rate of 20 breaths/min. Positive end-expiratory pressure (PEEP) was set to 5 cmH2O. The ventilator rate was adjusted as necessary to maintain end-tidal carbon dioxide (ETCO2) in the range of 38 to 45 mmHg, and the inspiratory pressure was adjusted to maintain tidal volume of 10 ml/kg. Cuffed ETT size was determined using the Duracher formula (ETT internal diameter = Age in years / 4 + 3.5) [8]. Absence of leak around the ETT was confirmed with auscultation. ETT cuff pressure was not measured.
For the SGA device arm of the study, an air-Q® Masked Laryngeal Airway device was used, and a similar procedure was followed. Initial device size was determined according to the manufacturer’s recommendations based on weight. Following placement of the air-Q® the presence of an adequate airway seal, defined as a sealing pressure > 16 cmH2O, was checked by manually increasing the airway pressure and noting the pressure at which a leak was audible. The patient was then placed on the anesthesia ventilator in pressure control mode with initial settings of inspiratory pressure of 17 cmH2O with PEEP of 5 cmH2O and a rate of 20 breaths/min. As in the ETT group, the inspiratory pressure was then adjusted to maintain a tidal volume of 10 ml/kg, and the respiratory rate (RR) was adjusted to maintain ETCO2 in the range of 38 to 45 mmHg. Additionally, the leak fraction (defined as the ratio of exhaled tidal volume [Vte] to inspired tidal volume) was observed. A ratio of < 0.9 was considered to be excessive and the patient was either excluded or had the air-Q® exchanged for the next size up and these parameters were reassessed. The rate was then adjusted as necessary to maintain ETCO2 in a similar range to the ETT group.
Following ETT or air-Q® placement a disposable optical detector attached to the Respironics NM3® monitor (Philips North America, USA) was then inserted into the anesthesia circuit for all patients, in between the airway device and the circuit Y-piece. The time at which the detector was inserted was considered time zero. After 2 min, the Vte, inspiratory pressure, PEEP, RR, and oxygen saturation were recorded from the standard anesthesia monitor, and the airway deadspace (VDaw, the sum of anatomic and device deadspace), ETCO2, volume of carbon dioxide (VCO2), airway resistance (Raw), and dynamic compliance (Cdyn) were recorded from the NM3 monitor. This was repeated at 2 min intervals for 10 min. All measurements were recorded at each time point.
Following the fifth measurement in each patient, the disposable optical detector was removed from the anesthesia circuit and care was deferred to the clinical team caring for the patient. At this time the patient’s participation in the study was considered to be complete. Any adverse events associated with ongoing management of the case as well as any events at the time of emergence were recorded.
Statistical analysis
Initial pilot data in 10 patients (five ETT and five air-Q®) revealed that the airway and apparatus deadspace associated with an ETT was 3.2 ml/kg compared to a volume of 5.1 ml/kg associated with the air-Q® with a standard deviation of 1.9 ml. Using this information, sample size calculations were created; this revealed that with a power of 90% and an alpha of 0.05, a minimal sample size of 20 patients per group would provide the ability to detect at least a difference of 2 ml/kg in the primary outcome of airway deadspace between groups. Further, a priori, we decided to recruit 10 patients for each of the three weight ranges (5.0–9.9 kg, 10.0–14.9 kg, and 15.0–20.0 kg) to obtain a more evenly distributed sample across a range of weights for both the ETT tube and the air-Q® group. Thus, the study aimed for 60 total subjects (30 ETT and 30 air-Q®). This would also allow for a possible attrition and still maintain an adequate sample size.
Outcome measurements were recorded every 2 min for 10 min total, and the five data points were averaged for analysis. Descriptive statistics, including medians and interquartile ranges for demographic data not normally distributed and means and standard deviation for continuous measures and frequencies and proportions for categorical data, were calculated. Mann-Whitney test for non-parametric data, independent t-tests for normally-distributed continuous measures, and Fisher’s Exact Tests for categorical variables were used to test for differences between the two device groups. Spearman correlation coefficients were used to assess the strength of association between continuous variables. Analysis of variance (ANOVA) regression models were created to analyze the relationship between outcome measures and independent predictors which included weight, device, and device size. P values < 0.05 were assumed to be significant. SAS (version 9.4, USA) was used for all analyses.
Results
A total of 70 patients were approached for the study (Fig. 1). Sixty-two patients were consented for participation. Two patients were excluded after consent and did not participate in the study: one patient’s weight range had already been filled, and another patient was excluded because the surgeon requested the team caring for the patient not to use muscle relaxant for the case. A total of 60 patients were enrolled, 30 in each group. One patient from the air-Q® group was excluded from analysis due to incomplete data as a result of monitor malfunction. All patients had leak fractions greater than 0.9 except one who had a SGA initially; the device was exchanged for an ETT and this patient was secondarily assigned to the ETT group. Demographics for both device groups are summarized in Table 1. There were no significant differences between groups. No significantly morbid events were noted in any patient during the entire surgical or anesthetic epoch up to and including discharge from the post anesthesia care unit.

CONSORT flow diagram. ETT: endotracheal tube.
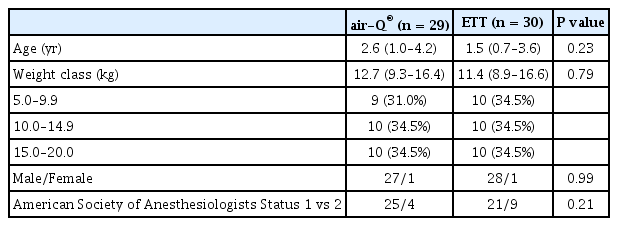
Patient Demographics
There was no statistically significant difference between the air-Q® and ETT groups in Vte, ETCO2, or total minute ventilation although minute ventilation in the air-Q® group did trend higher. These results are summarized in Table 2. There was a significant difference in weight-adjusted deadspace volume (the sum of airway deadspace and device deadspace) between the air-Q® and ETT 4.1 ± 0.8 ml/kg versus 3.0 ± 0.7 ml/kg, respectively (P < 0.001). Weight-adjusted deadspace volume (ml/kg) increased significantly with decreasing weight for both the air-Q® and ETT groups (Fig. 2).
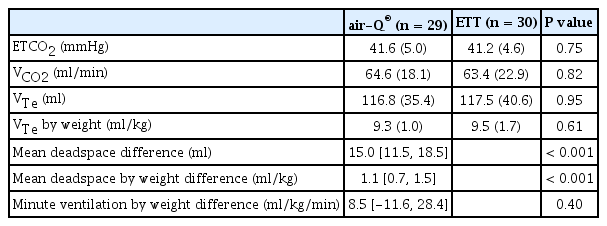
Main Outcome Results Using Volumetric Capnography for Patients with an air-Q® SGA Versus an Endotracheal Tube Following Induction of General Anesthesia and a Standardized Ventilation Protocol

Weight-adjusted deadspace volume (WADSV) for each device versus patient weight. Best-fit model (R2 = 0.930) is WADSV = 0.0164 w2 - 0.597 w + 1.172 d + 7.604 where: w is the child’s weight; d is the airway device: equals 0 for endotracheal tube (ETT), 1 for air-Q®.
Weight-adjusted deadspace volume varied more significantly from one size of ETT to another (P < 0.001) but did not vary with weight for each specific size. Conversely, for the air-Q® group, weight-adjusted deadspace volume did not vary significantly between sizes (P = 0.07), but retained an inverse relationship with weight for each specific size. This is summarized in Fig. 3.

Boxplot of weight-adjusted deadspace volume (WADSV) for endotracheal tube (ETT) and air-Q® as a function of device size. Box upper and lower borders denote 75th and 25th percentile values, respectively, and enclosed line denotes median value. Whiskers denote range. Note significant difference in WADSV when comparing sizes for ETT. WADSV for air-Q® follows a similar trend but is not statistically significant.
Discussion
The primary finding of this study is that use of an air-Q® SGA is associated with significantly more apparatus and anatomic deadspace when compared to an ETT. Further, while this difference is intuitive, the actual magnitude of weight-adjusted deadspace, especially in very young children, exceeds reasonable expectations of tidal volume during spontaneous ventilation in young children undergoing anesthesia [3]. Additionally, this deadspace will have to be compensated for when selecting mechanical ventilator settings to maintain CO2 homeostasis calling into question the wisdom of smaller tidal volume, lung protective ventilation strategies in very young children even in some cases when an ETT is present. While some might argue that although the result is statistically significant, the overall difference in deadspace/kg between the devices is less clinically significant. In assessing this though it is important to note that the difference enclosed by the 95% CI may actually be significantly higher, especially in very young children. These findings are clinically important because they may inform airway device selection for a given patient, as well as guide the clinician’s approach to determining the length of time they allow a patient to breathe spontaneously through a SGA.
Overall, there were no adverse events in our study group, and mild hypercarbia is generally well tolerated in healthy children, but for select patients increased airway deadspace may be clinically relevant. For example, children with pulmonary hypertension or certain types of congenital heart disease may deteriorate with hypercapnia and respiratory acidosis [9]. In these more fragile populations, the clinician may want to use an ETT instead of a SGA and/or the clinician may simply need to compensate with more aggressive mechanical ventilation or reduce periods of spontaneous ventilation [3].
Another interesting finding was that the weight-adjusted deadspace increases with decreasing patient size for both devices—not just the air-Q®. The inverse variation of weight-adjusted deadspace with both devices highlights the fact that, just because smaller devices are available for pediatric patients, non-linear scaling in physiologic processes and anatomy in smaller patients may require additional compensation strategies that may not at first glance be apparent. This is consistent with prior work in which the in vitro device volumes of several SGA devices were measured, including those for the air-Q® [10]. When the air-Q® device volume is normalized to the manufacturer’s recommended weight ranges, per kilogram device volume increases with decreasing device size: 0.66–1.17 ml/kg for air-Q® 2.0, 0.84–2.0 ml/kg for air-Q® 1.5, 1.4–2.5 ml/kg for air-Q® 1.0, and up to 3.3 ml/kg for air-Q® 0.5.
Another interesting finding of our study is that there appears to be a significant difference in the in vivo weight-adjusted deadspace from one size ETT to another, but not from one size air-Q® to another. This is likely related to a combination of two factors. First, there is a greater increase in apparatus volume as air-Q® size increases (up to 51%) as compared to ETTs (up to 25%) for the sizes used in the study. Second, a greater fraction of anatomic deadspace is inherent when using a SGA as compared to an ETT that excludes anatomic deadspace above the cuff. Practically speaking then, up- or down-sizing an ETT may make a significant difference in deadspace for a specific patient, but less so for a SGA that sometimes are upsized because of an inadequate sealing pressure.
Finally, it is important to note that despite significantly larger total deadspace in the air-Q® group, there was no statistically significant difference in ETCO2, Vte, and minute ventilation between groups as one would expect. While the study was not necessarily powered to detect a difference in these parameters, one would expect to see a difference in ETCO2 if the minute ventilation is the same with a larger proportion of the minute ventilation being from deadspace ventilation. As additional apparatus deadspace is introduced into the circuit, a smaller percentage of the delivered tidal volume ventilates the alveoli, and exhaled CO2-saturated gas is diluted by inhaled volume that did not exchange gas. In these cases, an increase in deadspace may actually lead to an increase in the A-a gradient. Over time, increasing PaCO2 will lead to an increase in ETCO2 despite the increased deadspace. However, ETCO2, due to the increased A-a gradient, may remain an underestimate of PaCO2, in proportion to the deadspace. It is likely that in our study, a measurement of PaCO2 in all children would have shown that the higher deadspace air-Q® group had higher PaCO2 values, and thus they were relatively hypoventilated, compared to the ETT group, despite similar ETCO2 between the groups. This also raises the possibility that during patient care a similar situation arises, whereby the clinician using a large deadspace airway device derives a false sense of security from a ‘normal’ ETCO2, when the patient is actually hypoventilated and hypercarbic. This may be of particular importance in smaller children in which the ratio of deadspace to tidal volumes is larger and therefore the gradient may be larger leading to a greater relative underestimate of ventilation adequacy using minute ventilation and ETCO2.
The results of this study are consistent with the work of Chhibber et al. [11,12] who compared the ETCO2 and arteriolar carbon dioxide (PaCO2) levels in infants and children undergoing ventilation with an LMA Classic® or ETT using a crossover design. In both studies, the authors found that patients had higher ETCO2 and PaCO2 values, as well as an increased ETCO2-PaCO2 difference with the LMA versus an ETT using similar ventilator settings. The disproportionate effects of apparatus deadspace on smaller children have also been alluded to in prior studies by Kwon [13] and Chau et al. [14] who measured increased levels of ETCO2 when adding heat and moisture exchanger to the ventilation circuit under similar ventilator settings. Finally, in a mathematical modeling study, Pearsall and Feldman [15] derived equations to evaluate PaCO2 and RR as a function of weight and deadspace. They found that the relationship between both PaCO2 as well as minute ventilation as a function of apparatus deadspace is exponential, and stressed the importance of patient weight since the ratio of deadspace volume to tidal volume (Vd/Vt)increases more rapidly for smaller patients as deadspace increases.
This study has several limitations. First, the sample size is small and the study was not powered to evaluate differences in secondary outcomes including minute ventilation, so while there was a trend toward increased minute ventilation to maintain similar ETCO2 in the air-Q® group, it was not found to be statistically significant. Second, these results apply strictly to the air-Q® SGA, and while we suspect other SGAs will add varying amounts of deadspace based on their different designs, we did not specifically evaluate other devices and further study is warranted in that regard [10]. Additionally, group selection was determined prior to enrollment in the study according to the preference of the attending anesthesiologist assigned to a given case, not randomized. This may be a source of selection bias, although both groups had similar baseline demographics with similar underlying patient characteristics.
In healthy children undergoing positive pressure ventilation for elective surgery, the air-Q® SGA introduces significantly greater airway deadspace than an ETT. Additionally, airway deadspace, and minute ventilation required to maintain normocarbia, appear to increase with decreasing patient weight irrespective of whether a SGA or ETT is used. More study is necessary to evaluate the ventilation consequences of these differences in even younger patients and whether these differences will persist with other SGA devices.
Notes
Funding
Funded by the Department of Anesthesiology, Wake Forest School of Medicine, Winston-Salem, NC, USA.
Conflicts of Interest
No potential conflict of interest relevant to this article was reported.
Author Contributions
Eduardo Javier Goenaga-Diaz (Conceptualization; Formal analysis; Investigation; Methodology; Writing – original draft; Writing – review & editing)
Lauren Daniela Smith (Data curation; Investigation; Methodology; Writing – original draft; Writing – review & editing)
Shelly Harrell Pecorella (Conceptualization; Investigation; Methodology; Writing – review & editing)
Timothy Earl Smith (Conceptualization; Investigation; Methodology; Writing – review & editing)
Gregory B Russell (Data curation; Formal analysis; Writing – review & editing)
Kathleen Nicole Johnson (Data curation; Formal analysis; Investigation; Visualization; Writing – original draft; Writing – review & editing)
Martina Gomez Downard (Conceptualization; Investigation; Methodology; Writing – review & editing)
Douglas Gordon Ririe (Conceptualization; Funding acquisition; Investigation; Methodology; Writing – review & editing)
Dudley Elliott Hammon (Investigation; Methodology; Writing – review & editing)
Ashley Sloan Hodges (Conceptualization; Investigation; Visualization; Writing – original draft; Writing – review & editing)
Thomas Wesley Templeton (Conceptualization; Formal analysis; Funding acquisition; Investigation; Methodology; Project administration; Supervision; Writing – original draft; Writing – review & editing)