Four different methods of measuring cardiac index during cytoreductive surgery and hyperthermic intraperitoneal chemotherapy
Article information

Abstract
Background
Cytoreductive surgery (CRS) and hyperthermic intraperitoneal chemotherapy (HIPEC) are high-risk extensive abdominal surgery. During high-risk surgery, less invasive methods for cardiac index (CI) measurement have been widely used in operating theater. We investigated the accuracy of CI derived from different methods (FroTrac, ProAQT, ClearSight, and arterial pressure waveform analysis [APWA], from PICCO) and compared them to transpulmonary thermodilution (TPTD) during CRS and HIPEC in the operative room and intensive care unit (ICU).
Methods
Twenty-five patients scheduled for CRS-HIPEC were enrolled. During nine predefined time-points, simultaneous hemodynamic measurements were performed in the operating room and ICU. Absolute and relative changes of CI were analyzed using a Bland-Altman plot, four-quadrant plot, and interchangeability.
Results
The mean bias was −0.1 L/min/m2 for ClearSight, ProAQT, and APWA and was −0.2 L/min/m2 for FloTrac compared with TPTD. All devices had large limits of agreement (LoA). The percentage of errors and interchangeabilities for ClearSight, FloTrac, ProAQT, and APWA were 50%, 50%, 54%, 36% and 36%, 47%, 40%, 72%, respectively. Trending capabilities expressed as concordance using clinically significant CI changes were −7º ± 39º, −19º ± 38º, −13º ± 41º, and −15º ± 39º. Interchangeability in trending showed low percentages of interchangeable and gray zone data pairs for all devices.
Conclusions
During CRS-HIPEC, ClearSight, FloTrac and ProAQT systems were not able to reliably measure CI compared to TPTD. Reproducibility of changes over time using concordance, angular bias, radial LoA, and interchangeability in trending of all devices was unsatisfactory.
Introduction
Hemodynamic monitoring is an essential part of patient care in the operating room (OR) and in the intensive care unit (ICU). Many hemodynamic measuring devices are available, with each having their own limitations [1–3]. In recent years, the use of invasive hemodynamic measuring devices has declined, as they have been linked to complications and the benefit for the patients is unclear [4]. Instead, there has been an increased focus on development of less invasive hemodynamic monitoring devices. In the perioperative period [5,6] hemodynamic measurements are used to minimize perioperative-related complications [7,8]. The use of these devices in critically ill patients is still a subject of debate [5,9]. Most new non-invasive devices are validated under stable ICU conditions. However, clinical conditions vary considerably in most studies, with both reference technique and clinical setting influencing the results [10].
In patients undergoing high risk surgery, goal directed therapy (GDT) using specific hemodynamic goals improves patient outcomes [11,12]. Cardiac index (CI) is often an element within the treatment algorithm and can be measured using many devices [3,8,12]. Cytoreductive surgery (CRS) and hyperthermic intraperitoneal chemotherapy (HIPEC) are high risk extensive abdominal surgery having a curative intent. After extensive resections which can even be multi-organ resections in some cases, intravenous chemotherapy is followed by intraabdominal perfusion of chemotherapy at 42–43°C. This procedure is known to cause extensive fluid shifts [13] and inflammation [14] with periods of hemodynamic instability. Advanced hemodynamic monitoring is used to tailor hemodynamic therapy [13], but complications can occur [4]. We evaluated three different methods to measure CI with variable levels of invasiveness and compared them to transpulmonary thermodilution (TPTD), which is the standard measuring device during this extensive surgical procedure. Two devices, the FloTrac, Edwards Lifesciences, CA, USA, and ProAQT system, Pulsion Medical Systems, Germany; Maquet Getinge Group, Sweden, use waveform analysis. The ClearSight system, EV1000 Clinical Monitor Platform, Edwards Lifesciences, CA, USA, uses volume clamp method. All were tested during different stages of this operation. CI obtained using arterial pressure waveform analysis (APWA) by the PiCCOTM system (Pulsion Medical Systems, Germany; Maquet Getinge Group, Sweden) was also compared to TPTD to analyze drift. The accuracy of CI measurements and the reproducibility of CI changes over time using these devices were compared to TPTD measurements. The goal of the study was to investigate if one of the less invasive devices could replace TPTD measurements in the OR or in the ICU, thereby increasing patient safety in the future.
Materials and Methods
Study design
This prospective and observational clinical cohort study was approved by the Medical Ethics Review Board of Arnhem-Nijmegen, the Netherlands, under the Number 2015-1793 (Dr. M. J. J. Prick, 21-05-2015). This study was registered at www.trialregister.nl, under a national trial registry number of NTR5249. The study was conducted between November 2015 and June 2017 at the Radboud University Medical Center, Nijmegen, The Netherlands according to the Declaration of Helsinki 2013 and following the ICH guidelines for Good Clinical Practice. After obtaining written informed consent, 25 patients older than 18 years who were scheduled for a CRS-HIPEC procedure were included. The study was performed in the OR and ICU of a university teaching hospital, Radboud University Medical Center, the Netherlands.
The exclusion criteria were patients with known valvular heart disease (severe tricuspid or aortic valve insufficiency), cardiac arrhythmias, or severe peripheral vascular disease as well as those who did not give informed consent. This study did not modify the standard perioperative or intensive care provided during and after the CRS-HIPEC procedure.
Anesthetic management
Standard patient monitoring, including continuous electrocardiogram, oxygen saturation and non-invasive blood pressure monitoring, were applied to all patients. All patients were given general anesthesia, supplemented with a thoracic epidural analgesia at T8-T10. Postoperative analgesic regimen consisted of patient controlled analgesia using ropivacaine with sufentanil 2 mg/1 μg/ml. Continues infusion varied according to analgesic effect between 8–10 ml/h. Patient bolus was set at 2 ml with 20 minutes lock out time. The epidural could be used in the peri-operative period, this was left to the discretion of the anesthesiologist. After orotracheal intubation mechanical ventilation with tidal volumes of 6–8 ml/kg was initiated. FiO2 and positive end-expiratory pressure were adjusted to maintain a peripheral oxygen saturation above 94%. Respiratory rate was adjusted to maintain PaCO2 between 35–40 mmHg. General anesthesia was maintained using isoflurane. Multimodal anesthesia/analgesia was administered using S-ketamine (10 mg loading dose followed by 10 mg/h), dexamethasone 8 mg intravenously, and magnesium chloride (30 mg/kg loading dose in 30 min followed by 500 mg/h) [15–17]. After induction of general anesthesia, ultrasound-guided insertion (Sonosite, X-porte, USA) of the PiCCO catheter in the right femoral artery (Pulsion, ref. PV2015L20-A) and a central venous catheter (Vygon multicath 3+, ref. 6209.251) in the right internal jugular vein were performed. One hour before the end of the CRS period, folic acid and systemic 5-fluorouracil were administered to all patients receiving oxiplatin as abdominal perfusion chemotherapy [9]. The data from the PiCCO system was used by the attending anesthesiologist to guide hemodynamic management. At the end of surgery, the patients remained intubated and were transferred to the ICU.
Body temperature was obtained from the thermistor in the TPTD system.
Brief description of techniques
Transpulmonary thermodilution measurement by the PiCCO® system (Pulsion Medical Systems, Germany; Maquet Getinge Group, Sweden)
TPTD measurements using the PiCCO system is an invasive technique that uses intermittent bolus injection of cold saline through a central line above the diaphragm and a femoral arterial catheter with a thermistor tip to measure the thermodilution curve. Measurements were performed using the IntelliVue MX800 or IntelliVue MP70 monitor (Philips, The Netherlands, software version J.10.52). This method provides the following variables: CI, global end-diastolic volume, intra thoracic blood volume, extravascular lung water, global ejection fraction and pulmonary vascular permeability index [18]. Intermittent bolus measurements are averaged and with this mean CI, pulse contour analysis of the PiCCO system (APWA) is (re)calibrated. The method is comparable with pulmonary artery catheter-derived measurements, which makes it a good reference technique when assessing new hemodynamic measuring devices [19].
Non-invasive ClearSight™ system
The ClearSightTM system (EV1000 Clinical Monitor Platform, Edwards Lifesciences, software version 1.8, USA) is an auto-calibrated measurement device that measures finger arterial blood pressure waveform using the volume clamp method and is automatically calibrated using the Physical method. The finger pressure waveform is transformed into a reconstructed brachial blood pressure waveform. The exact algorithm is explained elsewhere [20]. In summary, after applying a (size-specific) cuff to the finger, the arterial blood pressure waveform is obtained by the pressure in the cuff. An infrared transmission plethysmograph is used to measure the finger artery's diameter, which is used to keep the blood volume in the finger artery at a constant level [21]. By using the proprietary CO-Trek algorithm for pulse contour analysis on these non-invasively obtained arterial blood pressure waveforms, continuous cardiac output measurements are estimated.
FloTrac/Vigileo™ system (Edwards Lifesciences, USA)
The FloTrac/VigileoTM system is an auto-calibrated system that has updated its algorithm over the last few years [9]. The fourth-generation algorithm (Version 4.00) was developed to improve the performance of the system during rapid vascular tone changes. The system calculates Cardiac Output (CO) as follows: CO = PR × SD (blood pressure [bp]) × χ, where PR = pulse rate, SD [bp] = standard deviation of the arterial pressure, and χ = auto-calibration factor that is part of a proprietary algorithm and incorporates the assessment of vascular tone based on waveform morphology analysis and patient characteristics. Initially, χ was recalculated every minute. With the fourth-generation FloTrac algorithm, a new component called Kfast was developed, which is inversely proportional to pressure and is added to χ, with the new component calculated every 20 seconds. Thus, CO = PR × SD [bp] × K4 × Kfast using the latest algorithm [22].
PulsioFlex-ProAQT® system (Pulsion Medical Systems, Germany; Maquet Getinge Group, software V4.0.0.7 A, Sweden)
The Professional Arterial FlowTrending device (ProAQT) uses auto-calibrated pulse contour analysis. A special sensor is connected to an existing arterial catheter to provide beat-to-beat CI monitoring. The initial CI is automatically determined using patient characteristics and waveform analysis sampling at 250 Hz [23]. The statistical approach for autocalibration is the result of an analysis of a comprehensive database. The value of CI results from both the previous autocalibration and the pulse contour analysis that has run afterward. Hereafter, continuous cardiac indices are estimated using the known PiCCO algorithm. Calibrating with an externally-derived CI is possible at any time.
Protocol
Patient and surgical characteristics were recorded. Age, height, weight, and gender were entered in all monitors. All monitor devices were set up according to the operational manual provided by the manufacturer. All pressure transducers, including the ClearSight Heart Reference Sensor, were zeroed to the level of the right atrium. The FloTrac and ProAQT system were both connected to the already in situ PiCCO arterial catheter. All clocks were synchronized. Simultaneous CI measurements were performed at nine predetermined time-points (T1–T9):
T1 = after induction of general anesthesia but before surgical incision
T2 = 30 minutes after the start of CRS
T3 = 30 minutes before the end of CRS (in consultation with the surgeon or halfway iv chemotherapy)
T4 = after CRS, before the start of the HIPEC procedure
T5 = halfway through HIPEC
T6 = after the end of chemotherapy perfusion
T7 = at the end of surgery but still in the OR
T8 = approximately 6 hours postoperatively in the ICU
T9 = approximately 12 hours postoperatively in the ICU
Each TPTD measurement was performed in sets of three to five bolus injections of 20 ml of iced isotonic saline through the central venous catheter irrespective of the ventilator cycle. The mean value was recorded as TPTD CI. All individual bolus measurements were stored and used for the analysis of the precision of the reference method. APWA was also compared to TPTD to analyze drift. All devices provide continuous CI measurements, so we simultaneously used three minutes at the start of each of TPTD measurements to calculate the mean CI of all devices at each time-point. The mean values of these three-minute time frames were recorded and stored for analysis. All measurements were performed by a dedicated research group.
Statistical analysis and data storage
Statistical analyses were performed using IBM SPSS Statistics for Windows (Version 25.0, IBM Corp.) and GraphPad Prism (Version 5.03, GraphPad Software Inc.), figures were produced by SPSS and Microsoft Excel (2007, Version 12.0.6776.5000 SP3, Microsoft Corp.), and data were collected using Microsoft Access (2007, Version 12.0.6735.5000 SP3, Microsoft Corp.). P < 0.05 was considered statistically significant. Patient characteristics are presented as mean (SD) or median [range] where appropriate.
Agreement and thus interchangeability of the test devices with TPTD was examined with Bland-Altman analysis corrected for repeated measurements [24,25] and according to previously published statistical suggestions [26–28]. Agreement was calculated using mean CI, and presented as bias and limits of agreement (LoA) with 95% confidence intervals (95% CI). A percentage of error (PE) of less than 30% was considered clinically acceptable [24–28]. The precision of the less invasive hemodynamic devices was calculated as the repeatability coefficient (RC, %) using raw CI data collected in the three minutes. The precision of the TPTD measurement was calculated using the 3–5 individual measurements per time-point [28]. Proportional error (i.e. error dependent on the magnitude of the measurement) was assessed with linear regression analysis [24]. Systemic vascular resistance index (SVRI) was calculated from (
Sample size calculation
Sample size and posthoc power analyses were calculated according to Zou [34]. The presumed bias was 0 L/min/m2, the expected mean CI 3 L/min/m2, and the expected PE 30% [33], resulting in an expected LoA of 0.9 L/min/m2 (30% × 3.00 L/min/m2). Considering a clinical acceptable LoA of 0.6 L/min/m2 with the desired power of 0.80, this resulted in 130 paired measurements [35]. Anticipating the possible loss of measurements in patients who would be inoperable (20%), we included 25 patients, thus anticipating 225 paired measurements per test device.
Power analysis
Using the ICU measurements and an inoperable rate of 16%, we obtained 170 to 195 paired measurements per device instead of the required 130 for an expected power of 0.80. Using a LoA of 1.6 L/min/m2 and bias of −0.1 L/min/m2, these additional measurements increased the power to detect LoA of 0.6 L/min/m2 to 1.00. The data would allow us to correctly reject the null hypothesis with a power of 0.80 (or type 2 error rate of 0.20) when the expected LoA would be at least 1.2 L/min/m2.
Results
Twenty-five patients were included in the study, their characteristics summarized in Table 1. Individual patient data are listed in Table 2. Four patients had extensive disease, thus disqualifying them for the actual HIPEC. They were extubated at the end of the procedure and not admitted to the ICU; only their existing data was included in the analysis. Monitor-derived data were analyzed with one-way analysis of variance, as differences in CI measured with the test devices were normally distributed according to the D'Agostino and Pearson test (P = 0.489, P = 0.204, P = 0.522 for ClearSight, FloTrac, and ProAQT CI).

Patient Characteristics
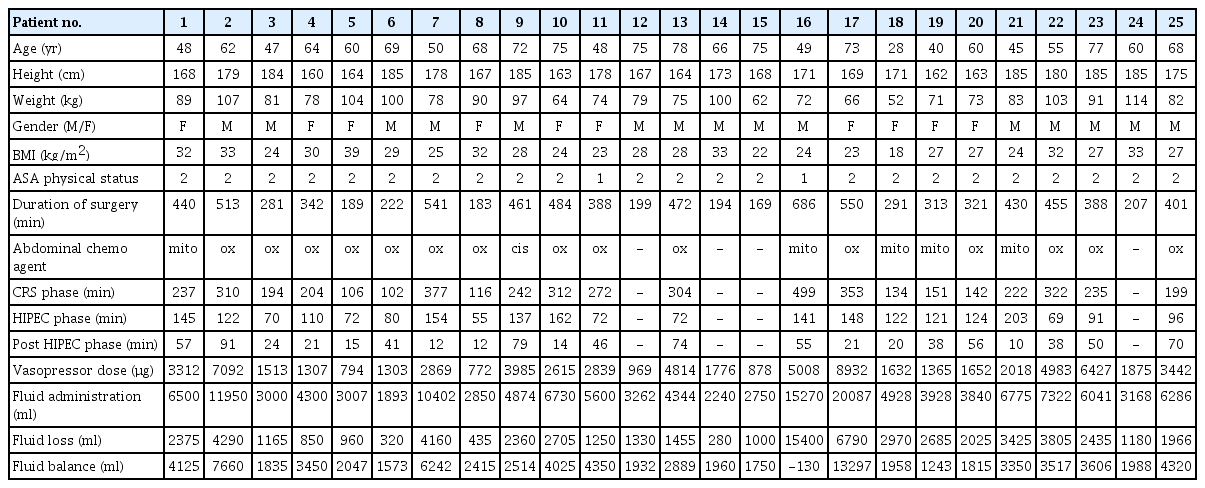
Individual Patient Characteristics
TPTD vs. ClearSight™
TPTD CI ranged from 1.7 to 7 L/min/m2 while ClearSight CI ranged from 1.5 to 7.8 L/min/m2. In total, 171 paired measurements were obtained for both devices. The mean bias was −0.1 (95% CI: −0.3, 0.0) L/min/m2, LoA ± 1.6 (95% CI: 1.4, 1.8) L/min/m2, and PE was 50% (95% CI: 44%, 57%). The interchangeability rate was 36%.
Trending analysis showed 65% uninterpretable data pairs of measurements and 13% interchangeability. Considering the repeatability of each measurement, 32% of pairs were uninterpretable and 8% were interchangeable. Using only clinically significant CI values, the chance of concordance was 85%. Polar plot analysis showed a mean angular bias of −7° and a radial LoA of ± 39° (95% CI: 34, 43°).
TPTD vs. FloTrac/Vigileo™
TPTD CI ranged from 1.7 to 7.2 L/min/m2, while FloTrac CI ranged from 1.6 to 5.6 L/min/m2. In total, 198 paired measurements were obtained. The mean bias was −0.2 (95% CI: −0.3, −0.1) L/min/m2 with a LoA of ± 1.6 (95% CI: 1.4, 1.8) L/min/m2 and a PE of 50% (95% CI: 45%, 58%). The interchangeability rate was 47%.
Trending analysis showed 68% uninterpretable data pairs and 9% interchangeability. Considering the repeatability of each measurement, 33% of pairs were uninterpretable and 7% were interchangeable. After the exclusion of clinically insignificant CI changes, concordance was found to be 76%. Polar plot analysis showed a mean angular bias of -19° and a radial LoA of ± 38° (95% CI: 32, 41°).
TPTD vs. PulsioFlex-ProAQT®
TPTD CI ranged from 1.7 to 7.2 L/min/m2, while ProAQT CI ranged from 1.5 to 7.8 L/min/m2. A total of 178 paired measurements were obtained with a mean bias of −0.1 (95% CI: −0.2, 0.0) L/min/m2, a LoA of ± 1.7 (95% CI: 1.5, 2.0) L/min/m2, and a PE of 54% (95% CI: 47%, 61%). The interchangeability rate was 40%.
The trending analysis showed 70% uninterpretable data pairs and 11% interchangeability. Considering the repeatability of each measurement, 33% of pairs were uninterpretable and 13% were interchangeable. Analyzing clinically significant changes gave a concordance of 76%. Polar plot analysis showed a mean angular bias of -13° with a radial LoA of ±41° (95% CI: 34, 43°).
TPTD PiCCOTM vs. APWA PiCCOTM
TPTD CI ranged from 1.7 to 7.2 L/min/m2, while APWA CI ranged from 1.5 to 7.0 L/min/m2. In total, 171 paired measurements were obtained for both methods. The mean bias was −0.1 (95% CI: −0.2, 0.1) L/min/m2, LoA was ± 1.2 (95% CI: 1.1, 1.4) L/min/m2, and PE was 36% (95% CI: 32%, 41%). The interchangeability rate was 72%.
Trending analysis showed 74% uninterpretable data pairs and 6% interchangeability. Considering the repeatability of each measurement, 36% of pairs were uninterpretable and 4% were interchangeable. Analyzing clinically significant CI changes, the concordance was found to be 66%. Polar plot analysis showed a mean angular bias of -15° with a radial LoA of ±39° (95% CI: 37, 40°).
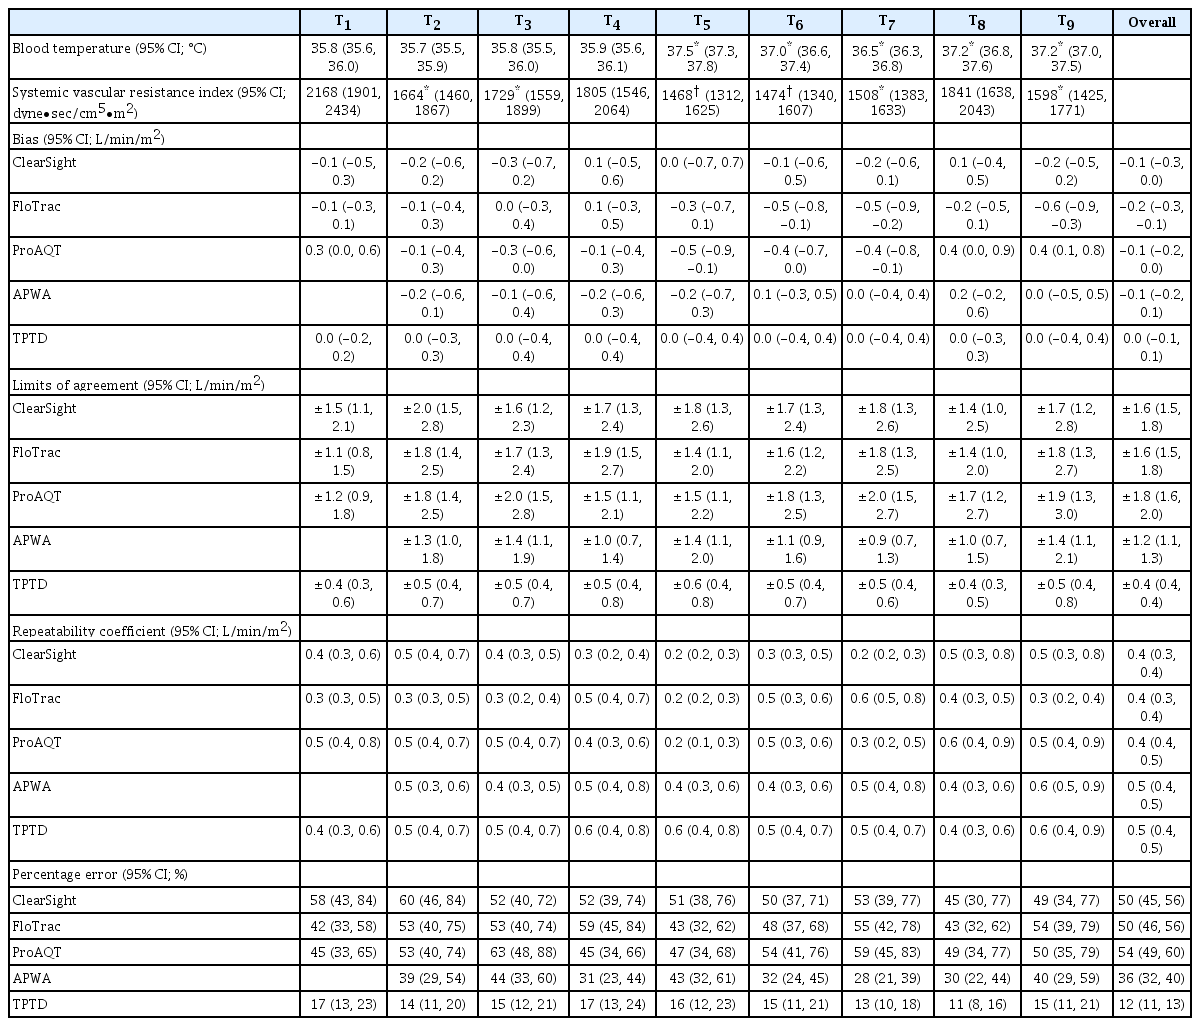
The graphical representation of the results is presented in Figs. 1, 2, and 3, respectively, as follows: Bland Altman analysis (including interchangeability), correlation analysis, and the four-quadrant plot (including interchangeability). Fig. 4 shows interchangeability in trending of all devices. In all graphs, the number of orange (possibly interchangeable) and green (interchangeable) data pairs are more or less equal. This in contrast with the blue (uninterpretable) and red (not interchangeable) data pairs. Using the actual RC for each point reveals additional interchangeable pairs, which were otherwise classified as uninterpretable. Results from all devices at individual time-points are shown in Table 3. There were no significant differences between the devices themselves nor among different time-points. All had minimal bias but large LoAs, thus resulting in high PEs.

Bland-Altmann plot of all devices vs. TPTD. Bland-Altman plot showing the agreement between ClearSight, FloTrac, ProAQT, APWA, and TPTD, respectively. All data are expressed as CI (L/min/m2). Solid lines indicate systematic bias ± limits of agreement (LoA). Dotted lines indicate the 95% CI around the bias and limit of agreement. Dashed lines indicate the inclusion zone using the repeatability coefficient of the thermodilution measurements. Green or red color: inclusion or exclusion of the data point using the repeatability coefficient of each data pair instead of using the overall inclusion zone. AWPA: arterial pressure wave analysis, TPTD: transpulmonary thermodilution, CI: cardiac index.
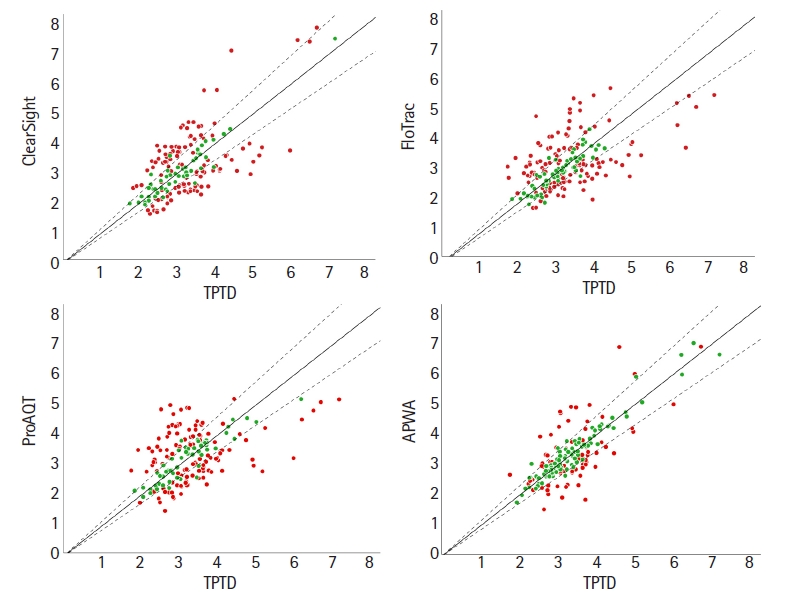
Correlation plot of all devices vs. TPTD. Correlation plot of ClearSight, FloTrac, ProAQT, and AWPA vs. TPTD. All data are expressed as CI (L/min/m2). Clearsight R2 = 0.48; FloTrac R2 = 0.32; ProAQT R2 = 0.24; APWA R2 = 0.68 compared with TPTD. Solid lines indicate the line of identity considering systematic bias. Dashed lines indicate the inclusion zone using the mean repeatability coefficient of the test device and the reference device. Green or red color: inclusion or exclusion of the data point using the repeatability coefficient of each measurement instead of using the overall inclusion zone. TPTD: transpulmonary thermodilution, AWPA: arterial pressure wave analysis, CI: cardiac index.

Four-quadrant plot of all devices vs. TPTD. Four-quadrant plot of the trending ability of ClearSight, FloTrac, ProAQT, and APWA vs. TPTD. The percentual increase or decrease from the preceding measurement is plotted as Δ%. Additionally, each data point is classified according to its interchangeability. Blue = uninterpretable change; red = test device and thermodilution measurements are not interchangeable; orange = ‘gray zone’ where test device and thermodilution could be interchangeable; and green = test device and thermodilution seem interchangeable. TPTD: transpulmonary thermodilution, AWPA: arterial pressure wave analysis.
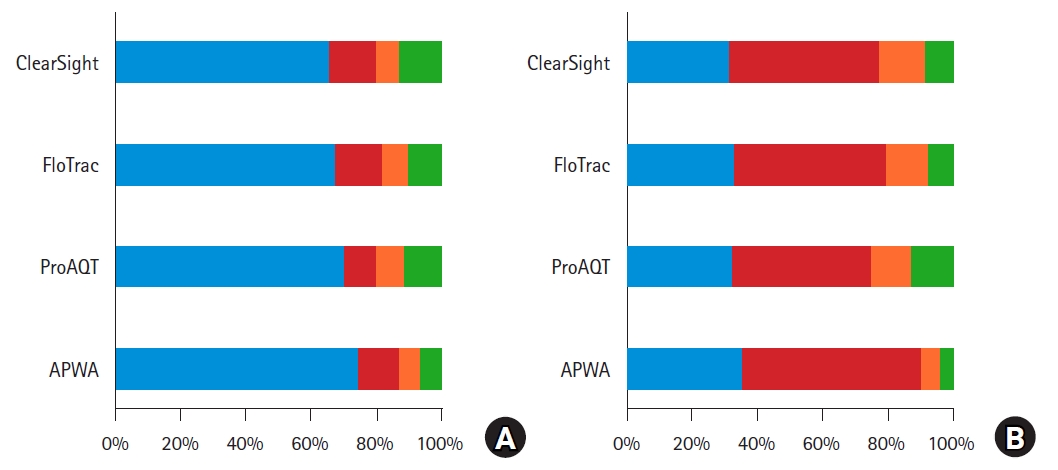
Summary of trending analysis. The proportion of data points from Fig. 3 being classified as uninterpretable (blue), as not interchangeable (red), in the ‘gray zone’ of possible interchangeability (orange), and as interchangeable (green) are summarized per test device according to Fischer et al. [31]. Fig 4A left: Data points are classified using the mean repeatability coefficient of the thermodilution measurements. This results in 66, 68, 70, and 74% uninterpretable pairs, and in 13, 9, 11, 6% interchangeable pairs for ClearSight, FloTrac, ProAQT, and APWA, respectively. Fig 4B (right): Data points are classified using the repeatability coefficient of the thermodilution measurements for each data point. This results in 32%, 33%, 32%, and 36% uninterpretable pairs; and in 8%, 7%, 13%, and 3% interchangeable pairs for ClearSight, FloTrac, ProAQT and APWA, respectively. Blue = uninterpretable data points; red = test device and thermodilution measurements are not interchangeable; orange = ‘gray zone’ where test device and thermodilution could be interchangeable; and green = test device and thermodilution seem interchangeable. AWPA: arterial pressure waveform analysis.
Bland-Altman Analyses per Time-point
During the HIPEC procedure, the intraabdominal temperature remained between 42–43°C for all patients. As a result, blood temperature significantly increased during this phase compared to pre-HIPEC blood temperature (P < 0.05). The SVRI during the CRS phase (T2–T4) was significantly lower (P < 0.05) compared to T1. During this procedure, there were significant changes in the SVRI. During the HIPEC phase (T5–T6), SVRI was significantly lower compared to the CRS (P < 0.05) and T1 phases (P < 0.001). There was also a significant difference in SVRI between CRS and HIPEC phases (P < 0.05).
The precision of the reference method TPTD, which was expressed as the repeatability coefficient, was 10%. The repeatability coefficients of Clearsight, FloTrac/Vigileo, ProAQT, and APWA were 8%, 9%, 10%, and 10%, respectively. This respectively corresponds to 0.4 (95% CI: 0.3, 0.4), 0.4 (95% CI: 0.3, 0.4), 0.4 (95% CI: 0.4, 0.5) and 0.5 (95% CI: 0.4, 0.5) L/min/m2. Bias was dependent on the magnitude of CI in ClearSight and APWA (0.22 and 0.14 L/min/m2 per L/min/m2, respectively, zero bias at 3.7 L/min/m2), but proportional LoAs were present in all devices (0.17, 0.30, 0.21 and 0.10 L/min/m2 per L/min/m2) for Clearsight, FloTrac/Vigileo, ProAQT and APWA, respectively. The estimated LoAs were 1.5, 1.4, 1.6 and 0.9 L/min/m2 for Clearsight, FloTrac/Vigileo, ProAQT, and APWA, respectively. Bias in APWA CI was not dependent on time since last TPTD bolus calibration (linear regression, R2 = 0.002; Pearson’s r = −0.043, P = 0.603; Spearman’s ρ = 0.032, P = 0.704).
Discussion
In this perioperative validation study, we compared CI measurements using less invasive hemodynamic monitoring devices, namely ClearSight, FloTrac and ProQAT, to that of TPTD measurements during CRS-HIPEC operations. Our data show a negligible bias for all studied devices but a large LoA.
Interchangeability rates, which are objective measurements of a device’s performance compared to a reference device as described by Lorne et al. [27], were well below clinically relevant levels. Using the measurement error of each individual pair of measurements, and thus a nonconstant repeatability coefficient, worsened the interchangeability rates in all test devices. We could not determine the cut off for 95% interchangeability in any of the devices because the inclusion rate was well below 95% within any subrange, which underlines the lack of interchangeability.
Considering the reproducibility of changes over time during this extensive surgical procedure, all devices had a concordance of < 92%. Only ClearSight had a concordance of 85%, which was closest to moderate trending. All devices showed systematic errors, with mean angular bias found to be between −7° and −19°. The radial LoA of all devices were outside the acceptable range, and varied from ± 38° and ± 41°.
Interchangeability in trending was defined using the measurement error of both the test device and the reference device. Uninterpretable pairs resulted from a statistically negligible change in the reference CI because of overlapping errors of two consecutive measurements, leading to > 60% of measurement pairs being uninterpretable. The proportion of either uninterpretable pairs (high) and interchangeable pairs (very low) was consistent with the results of Fischer et al. [31]. Using a nonconstant repeatability coefficient derived from the measurement error of each single measurement in both the test device and the reference device, both the proportion of uninterpretable pairs and the proportion of interchangeable pairs decreased. This is usually caused by a smaller individual repeatability coefficient (Table 3) and thus a smaller measurement error, which results in a larger number of statistically significant changes. The smaller individual repeatability coefficients may or may not change the classifications of not-interchangeable (red), possibly interchangeable (orange), or interchangeable (green). We also analyzed the repeatability of the devices, which showed an inverse proportional relation with the magnitude of the CI. This may justify the use of the measurement error of each CI measurement instead of using just one global repeatability coefficient. Trend interchangeability was low for all devices during this clinical procedure. The hemodynamic conditions of patients in previous studies varied from being stable post cardiac surgery [9,21,22,36] to developing sepsis or septic shock [9,21,37,38]. If validated in the OR, it often concerned liver surgery [9,37,38], and rarely, general surgery [39]. Most of these studies did not reach the criteria for interchangeability [23,36–41]. The trending ability of the devices in these studies varied and often showed conflicting results between the analyses used [21–23,37–41]. Overall, the results support moderate trending at best [21,22,38,39,41]. Our results conducted in the OR and ICU were comparable with literature [9,21–23,36–41].
All devices showed minimal bias at any time-point but a large LoA. These results were comparable to results seen during sepsis or septic shock [9,21,37,38] or liver surgery [9,37,38] and recognized for a decrease in vascular tone. Indeed, during CRS-HIPEC, the vascular tone significantly decreased (Table 3), which is also illustrated by the percentage of error of the APWA CI of 36%. These changes were unexpected during abdominal surgery. Our tested devices have shown to be sensitive to changes in vascular tone [22,37,40]. The aforementioned PE in combination with the short recalibration times (mean recalibration time was 63 min, SD 59 min) illustrate the complexity of hemodynamic monitoring in this patient population.
Many factors influence vascular tone during extensive surgical procedures, including the administration of general anesthesia, epidural analgesia, magnesium chloride infusion [17], as well as the patient’s immune response/inflammation [14,42]. Fluid administration and inotrope and/or vasopressor therapy counteract hypotension. During this extensive surgery we found an increase in CI (+8%; 95% CI: 1%, 14%) and a decrease in SVRI (−17%;95% CI: −27%, −9%) despite increasing norepinephrine dosages (+65%;95% CI: 37%, 93%) and rate of fluid administration (+148%; 95% CI: −12%, 310%). These data do resemble the hemodynamic changes that take place during sepsis episodes, in which we know less invasive devices are less accurate [3,9,21,37–39]. After the initiation of hyperthermic treatment, there was a significant reduction of SVRI (Table 3), which required an increase in vasopressor support. Although GDT studies have been published using different devices [12], the exact position with regards to the use of GDT remains unclear [43]. Results found in our study could have occurred in other studies involving liver surgery [9,37,38] and extensive surgical procedures [12,43], which likely negatively influenced the results.
Our recalibration moments were predefined and not influenced by the clinical situation. Time since the last calibration did not influence the bias between TPTD and APWA. To improve pulse contour-derived continuous cardiac index accuracy and precision, frequent recalibration is advised especially in hemodynamic challenging conditions. When to recalibrate remains unclear [44,45], Huber and colleagues advised that recalibration be initiated based on changes in APWA CI compared to the prior TPTD calibration [46].
Best TPTD measurement is achieved by creating a maximum temperature difference between the blood and injectate [47], with the maximal delta temperature measured at the thermistor tip. The accuracy of the measurements is not affected as long as the delta temperature is higher than > 0.3°C (verbal communication Pulsion/Getinge). We used a maximal amount of iced saline (20 ml) during the entire procedure. During HIPEC, the abdominal temperature was kept between 42–43°C, thus causing an expected rise in intravascular temperature (Table 3). The combination of high blood temperature and ice water provided the best condition for a good measurement [47]. Injecting iced saline during TPTD measurements did not alter abdominal temperature. Thus, there was no negative effect with regards to therapeutic effects during the HIPEC procedure.
Our study is a validation of extensive abdominal surgery and intensive care. In 25 patients and at nine predetermined time-points, we obtained 718 paired measurements. This number exceeds that in most validation studies [21–23,39,41,45,48]. We were able to calculate the precision of the measurements and the precision of the agreement of all measuring devices as advised by Hapfelmeier et al. [28]. This allowed us to conclude that the unacceptably high LoA and PE found in the present study were not attributable to a large variation in the measurements [33]. We combined old [24,25,33] and new [27,28] analyses for absolute values comparison. For the trending analysis, we also combined old and new values, combining the use of a four-quadrant plot [29,30], polar plot analysis [26], and interchangeability in trending [31], thus making the results robust.
Although visually inspected, theoretical under- or over dampening of the arterial waveform could have occurred during hemodynamic measurements. We did not use the pulmonary artery catheter as a reference technique due to its complications and lack of benefit with its use. We instead replaced it with TPTD [2,4]. The anesthesia protocol was not standardized to the fullest extent possible. As most of our anesthetics influence vascular tone, this could have influenced our results. Bias and precision of the tested devices (including the reference method) used have shown to be sensitive to changes in vascular tone [37–41,44–46,48]. The data from the TPTD measurement was used by the attending anesthesiologist to guide hemodynamic management. Different interpretations of these measurements could have led to different subsequent actions concerning fluid management and inotrope/vasopressor therapy. We think these inconsistencies were mitigated by the heterogeneity of the CRS-HIPEC.
Our study was also limited by the devices which we have used in this validation study combined with the selected CRS-HIPEC procedure. The generalization of these results could be questionable. However, extensive surgical procedures are performed on a large scale, and thus, results from T1–T4 apply to extensive abdominal surgery. Twenty-five patients were included and 718 paired measurements were taken. Although this could still be seen as a small cohort, power calculation found this to be enough.
During the HIPEC phase, blood temperature increased to a maximum mean temperature of 37.5°C (T5), with the intraperitoneal temperature being 42–43ºC All hemodynamic measurements were performed at “normal” blood temperatures (Table 3). However, one could argue that changes in temperature could have influenced our hemodynamic measurements in some way.
The ClearSight, FloTrac, and ProAQT systems were not able to reliably measure cardiac output compared to TPTD with the PiCCO system during CRS-HIPEC, with these devices having large limits of agreement and unacceptably high percentage errors. Reproducibility of changes over time using concordance, angular bias, radial LoA, and interchangeability in trending of all devices was unsatisfactory.
Acknowledgements
We thank the members of the HEMOHIP team (Dennis van Aalst, Chiel Baert, Lonneke Baggen, Martin Bucx, Hettie Custers, Mark Hoytink, Margien Jacobs, Koert Kersten, Jörg Mühling, Ruud van der Putten, Marlou Swenne, and Dominique Willems) for providing care for the study patients and facilitating the data acquisition as well as Ewald Bronkhorst, statistical and methodological consultant, for his advice and assistance for the conduct of statistical analyses.
Notes
Funding Statement
Clinical monitors were provided by Edwards Lifesciences and Pulsion Medical systems for the duration of the study, while disposables were purchased by the researchers. Further support was provided solely by institutional and/or departmental sources.
Conflicts of Interest
No potential conflict of interest relevant to this article was reported.
Author Contributions
Amon Heijne (Conceptualization; Data curation; Formal analysis; Methodology; Resources; Visualization; Writing – original draft; Writing – review & editing)
Piet Krijtenburg (Conceptualization; Data curation; Investigation; Methodology; Validation; Writing – original draft; Writing – review & editing)
Andre Bremers (Data curation; Investigation; Resources; Supervision; Validation; Writing – original draft; Writing – review & editing)
Gert Jan Scheffer (Conceptualization; Investigation; Supervision; Writing – original draft; Writing – review & editing)
Ignacio Malagon (Conceptualization; Methodology; Supervision; Validation; Visualization; Writing – original draft; Writing – review & editing)
Cornelis Slagt (Conceptualization; Investigation; Methodology; Supervision; Writing – original draft; Writing – review & editing)