Effects of propofol, desflurane, and sevoflurane on respiratory functions following endoscopic endonasal transsphenoidal pituitary surgery: a prospective randomized study
Article information

Abstract
Background
General anesthesia with intravenous or inhalation anesthetics reduces respiratory functions. We investigated the effects of propofol, desflurane, and sevoflurane on postoperative respiratory function tests.
Methods
This single-center randomized controlled study was performed in a university hospital from October 2015 to February 2017. Ninety patients scheduled for endoscopic endonasal transsphenoidal pituitary surgery were randomly categorized into either of these three groups: propofol (n = 30, the Group TIVA), desflurane (n = 30, the Group D) or sevoflurane (n = 30, the Group S). We analyzed the patients before, after, and 24 h following surgery, to identify the following parameters: forced expiratory volume in 1 second (FEV1) %, forced vital capacity (FVC) %, FEV1/FVC, and arterial blood gases (ABG). Furthermore, we also recorded the intraoperative dynamic lung compliance and airway resistance values.
Results
We did not find any significant differences in FEV1 values (primary outcome) among the groups (P = 0.336). There was a remarkable reduction in the FEV1 and FVC values in all groups postoperatively relative to the baseline (P < 0.001). The FVC, FEV1/FVC, ABG analysis, compliance, and airway resistance were similar among the groups. Intraoperative dynamic compliance values were lower at the 1st and 2nd hours than those immediately after intubation (P < 0.001).
Conclusions
We demonstrated that propofol, desflurane, and sevoflurane reduced FEV1 and FVC values postoperatively, without any significant differences among the drugs.
Introduction
General anesthesia associated changes in respiratory functions may be attributed to reduced lung compliance, closed airway, and lower functional residual capacity that may be etiologically associated with the formation of atelectasis. Halogenated anesthetics-induced loss of respiratory muscle tone can lead to formation of atelectasis [1] Similarly, a single bolus dose of propofol may reduce twitch diaphragmatic pressure. Animal studies have demonstrated that inhalation anesthetics impaired hypoxic pulmonary vasoconstriction (HPV) and increased shunt fraction, whereas propofol does not affect HPV [2–5]. Considering this, propofol and inhalation anesthetics are expected to demonstrate different effects on pulmonary functions. However, each inhalation anesthetic affects the respiratory system differently; for instance halothane, sevoflurane, and isoflurane relax the airways by depleting sarcoplasmic reticulum Ca2+ stores, unlike desflurane [6–8] .
Several studies have previously compared the effect of propofol and inhalation anesthetics on lung functions in different surgical procedures, except for intracranial surgeries, Tiefenthaler et al. [9] and Zoremba et al. [10] reported that propofol impaired lung functions more than inhalation anesthetics. Alternatively, no significant difference was found in other studies [11,12] . Proper titration of the positive end expiratory pressure level according to lung compliance may reduce the side effects of anesthetic drugs on lung function. However, positive end expiratory pressure (PEEP) titration in neurosurgical procedures could be problematic due to the complications associated with increased intracranial pressure. Therefore, to compare the effects of propofol, desflurane, and sevoflurane on respiratory functions we selected endoscopic endonasal transsphenoidal pituitary surgery patients who were already on a suboptimal ventilation with fixed PEEP levels.
Therefore, we aimed to compare the effects of three agents on forced expiratory volume in 1second (FEV1), forced vital capacity (FVC), lung compliance, and airway resistance during the postoperative 24 hours in patients who were undergoing endoscopic endonasal transsphenoidal pituitary surgery.
Materials and Methods
Study design
The Ethics Committee of Cerrahpasa School of Medicine, Istanbul, Turkey (Chairperson Prof Ozgur Kasapcopur) provided ethical approval for this study on 02 June 2015 (Ethical Committee No NAC 83045809/604.01/02). This study was registered to “clinicaltrials.gov with the number NCT02709863”. This prospective, randomized, and parallel study was performed between October 2015 and February 2017 in Istanbul University-Cerrahpasa, Cerrahpasa School of Medicine, Neurosurgical Operation Rooms and Neurosurgery ward.
Participants
Ninety American Society of Anesthesiologists physical status classification (ASA) I–II patients, aged between 18 to 70 years, who provided their written informed consent and were scheduled for elective endoscopic endonasal transsphenoidal pituitary surgery were included in the study. Patients presenting with any of the following conditions were excluded from the study: neurological disorders hindering the communication, obstructive or restrictive lung disease, heart failure, liver failure, kidney failure, smoking, drug or alcohol addiction, and dementia. Furthermore, patients who developed bronchospasm or laryngospasm or remained unconscious at the end of the surgery were excluded from the study.
Each patient underwent numerous respiratory functions tests (Spirolab III COLOUR LCD) and arterial blood gases (ABG) analyses (Cobas b 221) with the patient placed in the Fowler position before administration of anesthesia (Baseline). Three acceptable spirograms were acquired and the best measurement was recorded. We subsequently recorded hemodynamic parameters, forced expiratory volume in 1 second (FEV1) %, forced vital capacity (FVC) % and FEV1/FVC, pH, arterial partial pressure of O2 (PaO2), arterial partial pressure of CO2 (PaCO2), bicarbonate concentration ([HCO3−]), base excess (BE), and PaO2/FiO2.
Randomization
Patients were categorized using a computer-generated randomization method, by using numbered sealed envelopes to one of the following three groups by the anesthesiology nurse: total intravenous anesthesia (the Group TIVA, n = 30), desflurane (the Group D, n = 30), or sevoflurane (the Group S, n = 30) based general anesthesia.
Blinding
The on-duty anesthesiologists enrolled the participants, while another technician, who was blinded to the anesthesia method, performed the postoperative respiratory function tests.
Interventions
Patients were sedated with intravenous midazolam (0.03 mg/kg) before the surgery in the anesthesia preparation room. In the operating room, after routine monitoring, bispecteral index (BIS) and train-of-four (TOF) were monitored. Anesthesia was induced with propofol (1.5−2 mg/kg), rocuronium (0.5 mg/kg), and remifentanil (0.1 μg/kg/min). After 3 minutes of manual ventilation with oxygen/air (FiO2 = 0.8) patients were intubated with 7.5 mm internal diameter endotracheal tube for women and 8.0 mm internal diameter endotracheal tube for men. The cuff was inflated with air, and cuff pressure was maintained at 25 cmH2O. Patients were ventilated using a volume-controlled mode, tidal volume: 8 ml/kg (ideal body weight), FiO2 = 0.4, inspiration:expiration ratio of 1:2, PEEP: 5 cmH2O and the respiratory rate (9−12 /min) was adjusted to maintain PaCO2 in the range of 36 to 38 mmHg. Anesthesia was maintained with remifentanil (0.05−0.15 μg/kg/min) and rocuronium (0.3 mg/kg/h), followed by infusion of propofol (4 to 8 mg/kg/h), desflurane (1 minimum alveolar concentration [MAC] in oxygen/air), or sevoflurane (1 MAC in oxygen/air). Propofol and inhalation anesthetic concentrations were adjusted to maintain the BIS range between 45 and 60.
Intraoperative dynamic lung compliance (C) and airway resistance (Raw) were recorded after intubation and at 1st and 2nd hour. ABG analysis was repeated after orotracheal intubation, 15 min before extubation, and 30 min and 24 h after surgery. Hemodynamic parameters and respiratory rates were recorded at the same intervals.
The right radial artery and urinary catheters were placed. Surgical incision site was infiltrated with a maximum of 20 ml of lidocaine 1% and adrenaline (1 : 100.000) mixture. All patients were operated in the supine position. Intraoperative analgesia was maintained with an infusion of remifentanil and morphine. The maximum infusion dose of remifentanil was 0.20 μg/kg/min to intraoperatively control hemodynamic response. If it could not be controlled with remifentanil alone, we administered intravenous morphine with the maximum dose 0.1 mg/kg. Patients received ondansetron (4 mg) as an antiemetic prophylaxis at the end of the surgery. Residual muscle relaxation was reversed with sugammadex (2 mg/kg) at the end of surgery. The endotracheal tube was removed when the train of four ratio was 0.9 and the patient regained consciousness. The patient was subsequently transferred to the recovery room. All patients had previously been instructed about the visual analogue scale (VAS) from 0 to 10, with 0 representing no pain and 10 indicating the worst pain imaginable. Intravenous morphine (2 mg) administration was provided and repeated every 10 minutes if the VAS score was higher than 3. Total morphine consumption and duration of surgery were recorded. Patients were transferred to the ward when the modified Aldrete score was more than 9.
The respiratory function tests for each were repeated 30 min and 24 h postoperatively.
Outcomes
The primary endpoint of the present study was to compare the effects of propofol, desflurane, and sevoflurane on the FEV1, while the secondary endpoints were to compare their effects on the FVC, FEV1/FVC, ABG analysis, dynamic compliance, and airway resistance in patients undergoing endoscopic endonasal transsphenoidal pituitary surgery during the postoperative 24 h.
Statistical analysis and sample size
According to Tiefenthaler et al. [9], 27 patients were needed in each group to detect a minimum inter-group difference of 20% with regard to FEV1 values, with a probability of error type II of 20% (β = 0.2) and error type I of 1% (α = 0.01).
All data were expressed as a number or mean ± SD. The statistical package for the social sciences (SPSS) 15.0 (SPSS Inc, Chicago) was used for statistical analysis. Pearson χ2 test was used to compare inter-group qualitative variables, such as gender and ASA, which demonstrated binary change. The Shaphiro Wilk normality test was used to evaluate the distribution of data. The One-Way ANOVA was used to compare normally distributed variables among the groups. The Kruskal Wallis analysis was used to compare the variables that were not normally distributed. The Mann Whitney U test with Bonferroni correction was performed to highlight the inter-group differences when the differences were found. Statistical significance was determined via adjusted alpha (= 0.05/3 = 0.01666) by Bonferroni correction. The repeated measures ANOVA was used for intra- and inter-group comparisons; furthermore, P < 0.05 and P < 0.016 were considered as indicators of statistical significance, respectively.
Results
We had initially included 90 patients in this study. Three patients from Group TIVA were excluded from the study due to the following reasons: one developed bronchospasm necessitating switching from propofol infusion to sevoflurane inhalation, and two refused to postoperatively repeat respiratory function tests. Three patients from Group D were excluded, since one developed hematoma at the surgical site intraoperatively and had to be admitted to the intensive care unit, one did not adequately perform a proper spirometry test at the postoperative 30 min, and one vomited following extubation, which led to hypoxemia. Two patients from Group S were excluded, since one was admitted to intensive care unit due to severe intraoperative bleeding and the other could not postoperatively perform a proper spirometry test (Fig. 1).

Flow of participants in the study.
The study groups demonstrated significant similarity with respect to ASA physical status, gender, age, body weight, height, and body mass index. Duration of the surgery was longer in the Group D than Group S (P < 0.001, Table 1). The study groups were also similar with regard to their heart rate, blood pressures, and respiratory rates (P > 0.05).
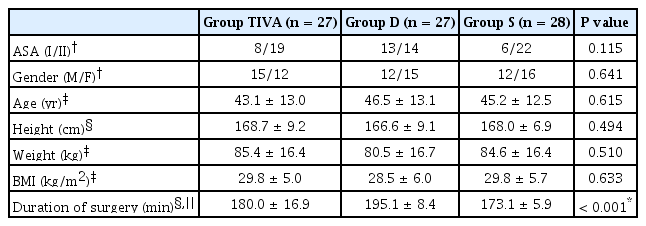
Patient Characteristics
We did not identify any statistically significant inter-group differences with respect to FEV1 levels in each measurement interval (P = 0.336). There was a statistically significant reduction in the FEV1 levels at the postoperative 30 min timepoint compared to the baseline, following which its levels increased and was significantly higher at the postoperative 24 h than at the postoperative 30 min in all groups (P = 0.001, Table 2).
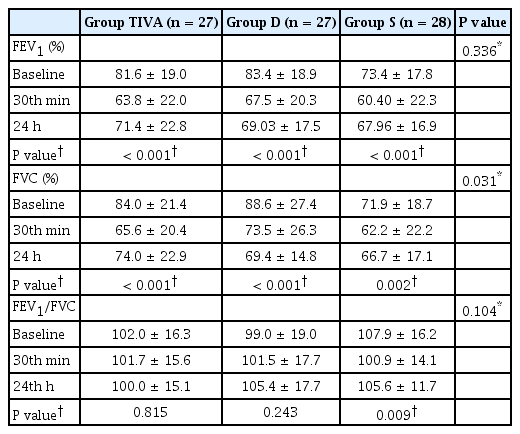
Results of Pulmonary Function Test
Although the baseline FVC values were lower in the Group S than Group TIVA and D, the difference was not statistically significant (P = 0.031, Table 2). The reduction in the postoperative 30 min FVC values demonstrated statistical significance than that at the baseline in all groups (P < 0.001 for the Group TIVA and Group D, 0.002 for the Group S). FVC values demonstrated a statistically significant increase at the postoperative 24 h than that at the postoperative 30 min in all groups (P < 0.001 for the Group TIVA and Group D, 0.002 for the Group S).
According to the data, we did not identify any particular inter-group differences with regard to the FEV1/FVC, PaO2, PaCO2, pH, SaO2, [HCO−3], base excess, lactate, and PaO2/FiO2 (P = 0.104, 0.299, 0.843, 0.632, 0.736, 0.685, 0.698, 0.027, and 0.268, respectively) (Tables 2 and 3). We noted statistically significant differences in the outcomes of the intra-group analysis with regard to FEV1/FVC values in Group S (P = 0.009) and PaO2, PaCO2, pH, SaO2, [HCO−3], base excess, and PaO2/FiO2 in all groups (P < 0.001 for all).

Results of Arterial Blood Gas Analysis
Dynamic lung compliance did not demonstrate any statistically significant difference at any measurement interval between the groups (P = 0.176). Reduction in the dynamic lung compliance levels was statistically significant at the 1st and 2nd hour of the operation than that after intubation in all groups (P < 0.001 for all, Table 4). Furthermore, there was no statistically significant difference with respect to airway resistance at any measurement intervals between (P = 0.679) and within the groups (P = 0.808 in the Group TIVA, P = 0.778 in the Group D, P = 0.372 in the Group S, Table 4).

Lung Compliance, Airway Resistance, and Cumulative Morphine Consumption
Cumulative morphine consumption was not different among the groups (P = 0.030, Table 4). None of the patients needed additional analgesic at the postoperatively.
Discussion
Similar to the previous studies, we identified a reduction in FEV1 and FVC values in the patients awakening from general anesthesia [13–15]. Considering the primary endpoint of the present study, we did not find any inter-group differences in FEV1 values. Additionally, We also did not observe any differences in secondary endpoints (FVC, FEV1/FVC, ABG analysis, compliance, and airway resistance) among the groups.
Inducing the general anesthesia reduced the functional residual capacity and increased airway resistance [16]. These changes may eventually lead to airway closure, atelectasis, or ventilation/perfusion mismatch [1]. Although preoxygenation with 100% O2 helped to prevent hypoxemia in cases demonstrating difficulty in ventilation and intubation; additionally, rapid absorption of trapped gas within closed airways may lead to atelectasis [1,17]. Alternatively, World Health Organization and the United States Center of Disease Control have recently recommended the intraoperative and early post-operative use of 0.8 FiO2 to prevent surgical site infections [18]. However, this recommendation triggered several discussions [19]. Despite these controversies pertaining to the prevention of absorption atelectasis, we administered 0.8 FiO2 while inducing the anesthesia and 0.4 FiO2 to maintain general anesthesia.
Tiefenthaler et al. [9] compared the effects of propofol and sevoflurane on postoperative lung function tests in patients undergoing lumbar disc surgery. Although they too did not identify any differences with regard to the FEV1 values, the reduction in the FVC values reported by them were significantly greater in the propofol group than the sevoflurane group. In their study, the patients were operated while being placed in a prone position, whereas in our study the patients were placed in a supine position. Different results may be attributed to the effect of surgical position on the ventilation/perfusion mismatch. Furthermore, they did not report any change in their primary endpoint (FEV1) and only showed a difference in their secondary endpoint (FVC). This may be due to a type II bias. Additionally, Tiefenthaler et al. [9] have not disclosed their intraoperative ventilation strategy, which may have affected the study results. Kim et al. [11] compared the effects of propofol and desflurane on the postoperative respiratory functions of elderly patients undergoing knee surgery. Similar to our results, they did not observe any differences in the postoperative spirometry values. Ozdogan et al. [12] compared the effects of sevoflurane and desflurane on respiratory function in patients undergoing sleeve gastrectomy and did not report any significant differences. Although a study with animal subjects had reported that desflurane increased total lung resistance and decreased lung compliance, sevoflurane did not [20]. Similar to Ozdogan et al. [12], we did not detect any differences in postoperative respiratory function tests between sevoflurane and desflurane groups. Here, intraoperative dynamic lung compliance values were reduced in the 1st and 2nd hours instead of immediately after intubation. It is our understanding that it might have been better to titrate the positive airway pressure level according to lung compliance; however, we used 5 cmH2O PEEP in all patients to avoid increased intracranial pressure. We did not observe any inter-group differences with regard to airway resistance. Although it has previously been demonstrated that sevoflurane caused airway relaxation while desflurane did not, we did not observe any significant differences between the groups [6–8]. Additionally, Zoremba et al. [10] compared the effects of propofol to desflurane on early postoperative lung functions in overweight patients and determined that propofol impaired early postoperative lung functions more than desflurane. Propofol decreased upper airway tone, unlike the volatile anesthetics [1], and this may be more significant in overweight patients [21].
In the present study, the PaO2 levels were higher during the intraoperative period and after 30 min postoperatively than the baseline values and 24 h due to O2 administration. The PaCO2 levels were higher and pH values were lower after 30 min postoperative than the other sampling times due to early postoperative hypoventilation. Other statistically significant differences in terms of ABG analysis and PaO2/FiO2 were not clinically important.
In the present study, intraoperative analgesia was provided using remifentanil and morphine administration. The nasal phase of the endoscopic endonasal transsphenoidal pituitary surgery is extremely painful. Controlled hypotension was necessary during this phase of the surgery to prevent severe bleeding. Preoperative local anesthetic and adrenalin administration to the nasal mucosa of concha reduced the amount of bleeding, but systemic absorption of adrenalin facilitated the rise in blood pressure. We administered remifentanil (max dose: 0.2 μg/kg/min) with morphine (max dose: 0.1 mg/kg) to provide analgesia during the nasal phase of the surgery. None of our patients needed additional postoperative analgesia. Cumulative morphine consumption was similar across the groups. Therefore, morphine induced hypoventilation could not impact our study results.
This study has a number of limitations, the study duration could have been longer and any surgical intervention at the nasal cavity may interfere with the spirograms. Additionally, we could not titrate the positive airway pressure level according to lung compliance. We used 5 cmH2O PEEP in all patients to avoid raised intracranial pressure. Therefore, there was a remarkable reduction in the intraoperative dynamic compliance after intubation. It was our understanding that we could have better described the negative effects of anesthetic drugs on respiratory functions since intracranial surgery patients were already on a suboptimal ventilation with lower PEEP and without the utilization of recruitment maneuvers. Although the numerical values of the baseline FVC were lower in Group S than Groups TIVA and D, the difference was not statistically significant. Therefore, we believe that this may not have affected our study results.
In conclusion, we compared the effects of propofol, desflurane, and sevoflurane on respiratory functions in patients undergoing endoscopic endonasal transsphenoidal pituitary surgery during the postoperative 24 hours. We demonstrated that all three agents postoperatively reduced respiratory functions, without any significant differences among the drugs.
Acknowledgements
We would like to thank Aybike Onur MD for editing the manuscript.
Notes
Conflicts of Interest
No potential conflict of interest relevant to this article was reported.
Author Contributions
Abdulvahap Oguz (Formal analysis; Investigation; Writing–original draft; Writing–review & editing)
Eren Fatma Akcil (Conceptualization; Data curation; Formal analysis; Investigation; Methodology; Project administration; Software; Supervision; Writing–original draft)
Yusuf Tunali (Conceptualization; Data curation; Formal analysis; Investigation; Methodology; Project administration; Software; Supervision; Validation; Visualization)
Hayriye Vehid (Formal analysis; Software)
Ozlem Korkmaz Dilmen (Conceptualization; Data curation; Formal analysis; Investigation; Methodology; Project administration; Visualization; Writing–original draft; Writing–review & editing)