Arrhythmogenic potential develops rapidly at graft reperfusion before the start of hypotension during living-donor liver transplantation
Article information

Abstract
Background
Detailed profiles of acute hypothermia and electrocardiographic (ECG) manifestations of arrhythmogenicity were examined to analyze acute hypothermia and ventricular arrhythmogenic potential immediately after portal vein unclamping (PVU) in living-donor liver transplantation (LT).
Methods
We retrospectively analyzed electronically archived medical records (n = 148) of beat-to-beat ECG, arterial pressure waveforms, and blood temperature (BT) from Swan-Ganz catheters in patients undergoing living-donor LT. The ECG data analyzed were selected from the start of BT drop to the initiation of systolic hypotension after PVU.
Results
On reperfusion, acute hypothermia of < 34℃, < 33℃ and < 32℃ developed in 75.0%, 37.2% and 11.5% of patients, respectively. BT decreased from 35.0℃ ± 0.8℃ to 33.3℃ ± 1.0℃ (range 35.8℃–30.5℃). The median time to nadir of BT was 10 s after PVU. Difference in BT (ΔBT) was weakly correlated with graft-recipient weight ratio (GRWR; r = 0.22, P = 0.008). Compared to baseline, arrhythmogenicity indices such as corrected QT (QTc), Tp-e (T wave peak to end) interval, and Tp-e/QTc ratio were prolonged (P < 0.001 each). ST height decreased and T amplitude increased (P < 0.001 each). However, no correlation was found between ΔBT and arrhythmogenic indices.
Conclusions
In living-donor LT, regardless of extent of BT drop, ventricular arrhythmogenic potential developed immediately after PVU prior to occurrence of systolic hypotension.
Introduction
The most challenging part of anesthetising a patient undergoing liver transplantation (LT) is managing the hemodynamics of the hepatic graft reperfusion. During this period, severe hemodynamic perturbation may occur, including hypotension, bradycardia, malignant ventricular arrhythmia, and occasionally cardiac arrest. This constellation of hemodynamic changes is called the post-reperfusion syndrome [12], which presumably results from the sudden influx of cold, acidotic, and hyperkalemic preservation solution along with vasoactive mediators from the graft [3].
Patients with liver cirrhosis frequently have QT interval prolongation, which predisposes them to ventricular dysrhythmia, with a prevalence that exceeds 50% in patients with class B and C Child-Pugh classification [45]. Additionally, during LT surgery, the QT interval progressively increases from the preanhepatic phase and shows substantial prolongation in the anhepatic phase of surgery in over half of the patients, and can reach values that are associated with a high risk of ventricular arrhythmias [6]. With such changes in their electrocardiography (ECG), LT recipients suffer acute hypothermia during graft reperfusion, which may lead to further prolongation of the QT interval, because acute hypothermia is a well-known cause of prolonged QT intervals [78]. In living-donor LT, the hepatic graft volume and the cold ischemic time are relatively smaller and shorter than those of cadaveric LT. But, little is known of incidence and detailed magnitude of acute hypothermia immediately after portal vein unclamping.
In order to understand the changes in ECG that occur when cold preservation solution is rapidly introduced into the patient's systemic circulation via the unclamped portal vein during hepatic graft reperfusion, we examined the detailed profile of acute hypothermia in these patients. We hypothesized that rapidly introducing the cold preservation solution would alter the ECG manifestation of ventricular arrhythmogenicity, before hemodynamic perturbation occurred during hepatic graft reperfusion.
Materials and Methods
Patients and anesthesia
This retrospective observational study received approval of our Institutional Review Board. The requirement for written informed consent was waived. A total of 317 patients who underwent LT at Asan Medical Center, Seoul, Korea, between May 2011 and March 2012 were enrolled in this study. Of these, we evaluated 148 patients without any history or symptoms of heart disease, such as hypertension, ischemic and nonischemic cardiomyopathy, portopulmonary hypertension, valvular heart disease, beta-blocking medications, or conduction abnormalities with the exception of those with isolated premature beats. Patients were also excluded if they had incomplete ECG or blood temperature (BT) data in the electronic medical record, if they received a cadaveric donor LT, if they had LT as a child, or if they did not show hypotension after graft reperfusion because our study focused on ECG changes prior to the occurrence of systolic hypotension. After approval by our institutional ethics committee, patients' electronic medical records were reviewed for aspects, including demographic data, comorbidities, Child-Pugh scores, model for end-stage liver disease scores, preoperative echocardiographic and laboratory evaluations, and hemodynamic and intraoperative data, such as graft weight, cold ischemic time, and warm ischemic time. Graft weight was normalized to graft-recipient weight ratio (GRWR = graft weight/recipient body weight, %) to examine the effect of graft weight on changes in BT.
Patients were anesthetized using a standard protocol at our institution [69]. Briefly, general anesthesia was induced with intravenous thiopental, fentanyl, and vecuronium, and maintained with 1% sevoflurane, a 50% O2/50% air mixture, and continuous infusion with fentanyl and vecuronium. All patients were monitored for standard biomedical parameters, including ECG, end-tidal CO2 concentration, bispectral index, BT, peripheral O2 saturation, cerebral blood oxygenation, and blood pressure from the radial and femoral arteries. BT was measured with a rapid-response thermistor in the pulmonary artery catheter and recorded using the analog output of a Vigilance II device (Edwards Lifescience LLC, Irvine, CA, USA), which can accurately monitor abrupt changes in BT [1011]. Central venous pressure, pulmonary arterial pressure, cardiac output, mixed venous oxygen saturation, right ventricular end-diastolic volume index, and systemic vascular resistance were also continuously measured with a 7.5 French pulmonary artery catheter (Swan-GanzCCOmbo V, CCO/SvO2/CEDV; Edwards Lifesciences LLC, Irvine, CA, USA). Simultaneous data, including the beat-to-beat ECG waveform of lead II, arterial, pulmonary and central venous pressure waveforms from a Solar 800 anesthesia monitor (GE, Milwaukee, WI, USA) and BT from the Swan-Ganz catheter, were routinely recorded throughout the LT. The data were archived as a multi-wave electronic medical record using a DI-720 WINDAQ multi-wave record computerized data acquisition system (DATAQ Instruments, Inc., Ackron, OH, USA) and a multi-data logger (Edwards Lifesciences, LLC).
During the anhepatic phase of living-donor LT, a piggyback technique was used to maintain hemodynamic stability. A temporary portocaval shunt was not used. A veno-venous bypass was employed to minimize hemodynamic instability when cardiac output was decreased by over 50% as the inferior vena cava was cross-clamped. The hepatic graft from the living donor was preserved with cold Histidine-Tryptophan-Ketoglutarate (HTK) solution during the cold and warm ischemic phase of the surgical procedure. All patients had similar hemodynamic and blood gas parameters before graft reperfusion: central venous pressure of 6 to 8 mmHg, mean arterial pressure of at least 60 mmHg, normal blood potassium concentration, and pH > 7.35. Before reperfusion, the liver graft was not flushed with the patient's blood or crystalloid to remove the preservation solution.
Data retrieval and ECG analysis
The intraoperative femoral arterial pressure, ECG waveform, and BT were retrieved from the electronically archived multiwave data. For the accurate analysis of the ECG data obtained during the short time period after the rapid influx of preservation solution but before the onset of hemodynamic perturbation, changes in BT in the Swan-Ganz catheter were used to determine the exact time point at which cold blood rapidly flooded into the heart, i.e., ECG data were selected from the start of the BT drop to the start of systolic hypotension (Fig. 1). An average of 1 min of data was collected just before the BT dropped and served as baseline data. ECG data was sampled at 500 Hz and transferred to Labchart® Pro ECG analysis software (Version 6; ADI Instruments, Colorado Springs, CO, USA) by the WINDAQ Waveform Browser (DATAQ Instruments). From each recording, four consecutive beats were chosen for analysis and a four-beat moving average was calculated by the Labchart software. Several features were measured automatically from the averaged data: PR, QRS and RR intervals; ST height; T amplitude; QT interval; corrected QT interval (QTc); and Tp-e interval (interval between the peak and end of T wave) (Fig. 2). The Labchart software automatically determined the baseline of ECG waveform, peak of the T wave, and end of the T wave. If the automatically measured QT intervals and Tp–e intervals were not acceptable by visual inspection, we manually adjusted the measurement to obtain the correct QTc and Tp-e intervals [1213]. Bazett's and Fridericia's formulae were chosen to calculate the QTc interval (QTc[B] and QTc[F], respectively) because a recent study demonstrated that Fridericia's formula is recommended in patients with cirrhosis [514]. We also determined the Tp-e/QT ratio and Tp-e/QTc ratio as ECG indices of ventricular arrythmogenicity [15].

Example of electrocardiogram (ECG) data selection from multi-wave record system. ECG is shown in the upper panel, femoral arterial pressure and blood temperature are shown in the lower panel. Vertical line on the left indicates time point portal vein is unclamped and vertical line on the right indicates time point blood pressure starts to decrease. ECG data for analysis was selected between two vertical lines. FAP: femoral arterial pressure, BP: blood pressure, BT: blood temperature
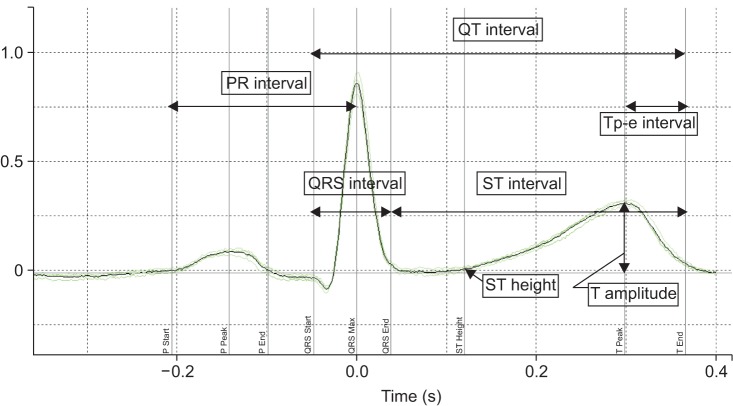
Example electrocardiographic parameters analyzed using Labchart software. Four consecutive beats were chosen and averaged.
Statistical analysis
Continuous data were expressed as mean ± SD, or median (interquartile range). Between-group comparisons were evaluated using the chi-square test, paired t-test, Wilcoxon signed-rank test and Pearson correlation coefficient, as appropriate. A P value < 0.05 was considered statistically significant. P values were calculated with SPSS version 21 statistical program (IBM Corporation, New York, NY, USA).
Results
Patient demographic characteristics and preoperative and intraoperative LT data are listed in Table 1. BT dropped abruptly and then recovered gradually when cold blood containing preservation solution was introduced into the recipient's blood at the moment of hepatic graft reperfusion (Fig. 3). Hypothermia of < 34℃, < 33℃, and < 32℃ developed in 75.0%, 37.2%, and 11.5% of patients, respectively. BT dropped from 35.0℃ ± 0.8℃ to 33.3℃ ± 1.0℃ (range, 35.8℃–30.5℃). The difference in BT (BT) was as high as 4℃ and the median BT was 1.7℃ (range, 0.3℃–4.0℃; Q1-Q3, 1.2℃–2.2℃) (Table 1; Fig. 3). The time from baseline to the minimum value of BT was 9.5 s (range, 7.0–14.1 s). Five minutes after the portal vein was unclamped, patients gradually recovered from acute hypothermia and their BT returned to 99.3% of baseline (Fig. 3).

Patient Characteristics, Preoperative and Intraoperative Data
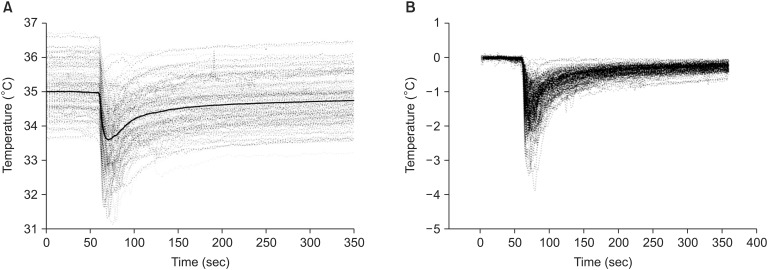
Changes in blood temperature during hepatic graft reperfusion. (A) Changes in blood temperature during reperfusion. The thick line indicates the mean value. (B) Changes in blood temperature are expressed by difference from baseline.
At a median time of 15.7 s (Q1-Q3, 13.8–18.3 s) after the portal vein was unclamped, the femoral arterial pressure started to decrease.
The PR intervals did not change significantly from the baseline measurements (P = 0.055). The ST height decreased (P < 0.001) and the T wave amplitude increased (P < 0.001). The QRS interval, QT interval, QTc interval, and Tp-e interval were prolonged significantly, and the arrhythmogenic indices of Tp-e/QT ratio and Tp-e/QTc ratio increased significantly after graft reperfusion (all P < 0.001; Table 2).

Electrocardiographic Measurements during Hepatic Graft Reperfusion
The changes in BT were weakly correlated with GRWR (r = 0.22, P = 0.008) but not with cold ischemic time (r = 0.07, P = 0.417), warm ischemic time (r = -0.14, P = 0.104), QTc(B) interval (r = -0.128, P = 0.127), QTc(F) interval (r = -0.11, P = 0.190), Tp-e interval (r = -0.08, P = 0.325), Tp-e/QTc(B) ratio (r = -0.04, P = 0.618), or Tp-e/QTc(F) (r = -0.05, P = 0.541).
Discussion
Although the hepatic graft volume and the cold ischemic time are relatively smaller and shorter in LDLT than the deceased-donor LT, a typical 'square root-shaped' decrease in BT was shown when the portal vein was unclamped in patients undergoing LDLT, as expected. Ventricular arrhythmogenic indices (QTc, Tp-e interval, Tp-e/QT ratio, and Tp-e/QTc ratio) were prolonged, T wave amplitude increased, and ST height decreased when cold blood with preservative solution was introduced into the heart and systemic circulation. Therefore, our findings indicate that prior to the occurrence of systolic hypotension, ventricular arrhythmogenic potential and changes in ST-T waves develop rapidly immediately after the portal vein is unclamped. Importantly, this implies that such ECG manifestations may lead to severe malignant ventricular dysrhythmia and occasional cardiac arrest, if profound systolic hypotension occurs due to postreperfusion syndrome after hepatic graft reperfusion.
Prolongation of QT interval is common in patients undergoing LT and this prolongation worsens during surgery [6]. Although this does not always lead to occurrence of arrhythmia or PRS, this possibility should not be ruled out because fatal arrhythmia can occur in combination of other factors, such as severe hypotension, bradycardia, hypothermia, or use of drugs that prolong the QT interval.
Myocardial repolarization can be assessed using the QT interval, QTc interval, QT dispersion, or transmural dispersion of repolarization (TDR). These measurements can be used as indices of ventricular arrhythmogenesis. Of these measurements, the Tp-e interval is considered an index of TDR and is linked to inducible and spontaneous ventricular arrhytmmias [161718]. Corrected Tp-e intervals, such as the Tp-e/QT ratio and Tp-e/QTc ratio, are also used as an electrocardiographic index of ventricular arrhythmogenesis [15]. In the present study, these indices of ventricular arrhythmogenesis all increased after the portal vein was unclamped. These changes occurred during a very short period (approximately 16 s) immediately after graft reperfusion and prior to systolic hypotension.
Several studies demonstrated that typical ECG findings of hypothermia are prolongation of the PR, QRS, and QT intervals; the presence of J (Osborn) waves; and atrial and ventricular dysrhythmias [1920]. Hypothermia can also produce ST changes in ECG patterns that mimic acute coronary syndrome, and T wave changes, thereby, such findings may attenuate the expected ECG findings of hyperkalemia [719].
Most research on ECG changes during hypothermia has been based on gradual changes in BT, such as those that occur after long exposure to cold weather [7] or during therapeutic hypothermia used to protect organs in intensive care units [20]. In the present study, cold blood was rapidly introduced into the heart and systemic circulation. A typical pattern of BT change after the portal vein was unclamped showed a sudden BT drop and recovery, i.e., BT decreased to its minimum value within 10 s of the cold solution being introduced and then gradually recovered to the baseline level within 5 min after graft reperfusion (Fig. 3). Rushing the cold preservation solution into the heart, which might be additionally saturated with ischemic metabolites, is quite different from other hypothermia studies. Therefore, it is likely that such differences might contribute to absent correlations between the changes in BT and arrhythmogenic indices. Specifically, we did not use the temperature measurement from the esophageal probe, which is commonly used to monitor body temperature during routine anesthetic practice, because it uses a slow response thermistor that is incapable of showing abrupt changes in BT. Our analysis is unique because we measured BT from the rapid response thermistor in the Swan-Ganz catheter [1011] to indicate precisely when cold blood perfused the heart. We also first observed changes in the ECG with arrhythmogenic potential immediately following the decrease in BT.
Several studies examined postreperfusion syndrome during LT, which is characterized by marked hemodynamic perturbation with severe hypotension, ventricular dysrhythmias, decreased systemic vascular resistance, bradycardia, and occasional cardiac asystole [13212223]. It is probably caused by the sudden influx of cold, acidotic and hyperkalemic preservation solution, along with vasoactive mediators from the graft and concomitant hypovolemia [24]. However, reperfusion hypotension has been correlated with a decrease in systemic vascular resistance, but not with hypothermia, acidosis, or hyperkalemia [2]. Therefore, its underlying mechanisms are generally multifactorial and are still not fully elucidated [24]. Nonetheless, little research has been done on the ECG manifestations that occur prior to hemodynamic changes. In the present study, we measured ECG changes that had arrhythmogenic potential and found that arrhythmogenicity developed immediately after the portal vein was unclamped in patients undergoing living-donor LT. Similar to the hypothermia issue raised previously [2], our findings showed no significant correlation between changes in BT and ECG indices of ventricular arrythmogenicity, despite observing changes in these indices. These findings suggest that acute hypothermia is not a sole key player in the arrhythmogenic ECG changes that occur after the portal vein is unclamped. Rather, acute ECG changes may be attributed to multifactorial etiologies, such as electrolyte abnormalities of the preservative solution, vasoactive and inflammatory mediators released from the cold ischemic graft, and acute volume loading effects on the right side of the heart, as could be expected from the ST segment and T wave changes.
Cardiovascular collapse during post-reperfusion syndrome elicits a high incidence of graft dysfunction, morbidity, and retransplantation because it causes extended warm ischemia and ischemia-reperfusion injury [24252627]. The use of HTK solution instead of University of Wisconsin cold solution is a possible risk factor for the development of post-reperfusion syndrome [242528]. Furthermore, ventricular arrhythmogenic potential and ST-T wave changes developed shortly after the portal vein was unclamped in the present study, the practice of routine flushing out HTK solution before graft reperfusion is recommended to minimize severe hemodynamic perturbation and malignant ventricular arrhythmias [22], although potassium content is low in HTK solution and graft volume is relatively smaller in the living-donor LT than those of deceased donor LT.
Our study has some limitations. First, because this is a retrospective and single center study, observational bias and selection bias may exist. A randomized, prospective, controlled study is needed to resolve these limitations. Second, we did not measure the acid-base status, electrolyte concentrations, and inflammatory cytokines immediately after graft reperfusion and prior to systolic hypotension by our retrospective study design; therefore, we could not differentiate between the effects of cold HTK solution itself or the donor blood containing inflammatory mediators affecting cardiac functions. A prospective design is required to elucidate these differences in the future study. Additionally, a comparison study between HTK and UW solution is also needed. Third, although a sudden decrease in BT was common when the portal vein was unclamped, we failed to demonstrate the correlation between changes in BT and arrhythmogenic indices. This was likely due to the compound nature of cold blood containing preservation solution and the relatively short time period of ECG analyzed by our study design. Therefore, exact ECG response of sudden hypothermia remains to be elucidated.
In conclusion, acute hypothermia was prevalent in undergoing living-donor LT after the portal vein was unclamped. We also found an increase in ventricular arrhythmogenic potential and changes in ST and T waves that developed rapidly and immediately after portal vein unclamping in LDLT patients using HTK solution before hemodynamic instability, which may have contributed to further development of severe ventricular dysrhythmias if combined with profound systolic hypotension of postreperfusion syndrome.