Effect of hydroxyethyl starch on blood glucose levels
Article information

Abstract
Background
Hydroxyethyl starch (HES), a commonly used resuscitation fluid, has the property to induce hyperglycemia as it contains large ethyl starch, which can be metabolized to produce glucose. We evaluated the effect of 6% HES-130 on the blood glucose levels in non-diabetic patients undergoing surgery under spinal anesthesia.
Methods
Patients scheduled to undergo elective lower limb surgery were enrolled. Fifty-eight patients were divided into two groups according to the type of the main intravascular fluid used before spinal anesthesia (Group LR: lactated Ringer's solution, n = 30 vs. Group HES: 6% hydroxyethyl starch 130/0.4, n = 28). Blood glucose levels were measured at the following time points: 0 (baseline), 20 min (T1), 1 h (T2), 2 h (T3), 4 h (T4), and 6 h (T6).
Results
Mean blood glucose levels at T5 in the LR group and T4, T5 in the HES group, increased significantly compared to baseline. There were no significant changes in the serial differences of mean blood glucose levels from baseline between the two groups.
Conclusions
Administration of 6% HES-130 increased blood glucose levels within the physiologic limits, but the degree of glucose increase was not greater than that caused by administration of lactated Ringer's solution. In conclusion, we did not find evidence that 6% HES-130 induces hyperglycemia in non-diabetic patients.
Introduction
Despite serious side effects such as acute kidney injury in sepsis [1], hydroxyethyl starch (HES) has been widely used for intravascular volume resuscitation in various clinical settings [23456]. Although recent studies have suggested careful consideration when choosing between a colloid and a crystalloid solution, colloids are still one of the most widely used and recommended treatment options in the case of hypovolemia, according to the resuscitation guidelines and intensive care management algorithms [2345]. Moreover, colloids can also be administered as preanesthetic agents for the prevention of spinal anesthesia-induced hypotension [6].
HES is a synthetic carbohydrate polymer and it is commonly used for fluid resuscitation [7]. HES has been used in various clinical situations to treat hypovolemia in patients with trauma, burns, sepsis, and surgery [1]. However, there are still concerns about serious side effects derived from using HES in patients with sepsis or who are critically ill because of its association with the risk of kidney injury and bleeding [1]. Furthermore, HES contains large ethylated starch or glucose polymers, which can be metabolized by serum amylases to produce smaller starch polymers and free glucose [8]. Thus, it is possible that HES could induce hyperglycemia in patients undergoing surgery, hence more susceptible to stress responses [9]. Hyperglycemia in surgical patients is associated with numerous adverse effects and serious adverse clinical outcomes [10]. There are few publications describing the possible effects of HES on blood glucose level and these include studies suggesting that 6% HES-450 was able to trigger changes in glycemia [811].
We hypothesized that the administration of 6% HES-130 is also able to increase blood glucose level. For this reason, we examined whether 6% HES-130, which has a lower molecular weight and lower degree of substitution than the 6% HES-450, increase blood glucose level in non-diabetic patients undergoing lower limb surgery under spinal anesthesia. In addition, we compared the serial differences of mean blood glucose levels from baseline between 6% HES-130 and lactated Ringer's solution.
Materials and Methods
After approval by the Institutional Review Board, written informed consents were obtained from all patients after the study was carefully explained. A total of 60 patients who were scheduled to undergo elective lower limb surgery with spinal anesthesia were enrolled. Only patients who belonged to the American Society of Anesthesiologists (ASA) class I or II and were aged between 30 and 80 years, with a body weight between 40 and 75 kg, were included in the study [8]. Patients with diabetes mellitus, taking hyperglycemic drugs (acetaminophen, ascorbic acid, steroids, etc.), with possible allergies to experimental drugs (especially with an allergy to corn), coagulation disorders, renal or cardiac dysfunctions, and suspected hypervolemia, including pulmonary edema, were excluded from the study.
Patients were divided into two groups: Group LR, administered lactated Ringer's solution (15 ml/kg, n = 30); Group HES, administered 6% HES-130/0.4 (Volulyte 6%™, Fresenius-kabi Korea, 7.5 ml/kg, n = 28).
All patients were premedicated with 0.05 mg/kg midazolam, intramuscularly, 30 min prior to the induction of anesthesia. An intravenous access was achieved with an 18 gauge intravenous cannula and the patients were transported to the operating room. Basal monitoring devices such as electrocardiogram, pulse oximetry, and non-invasive arterial pressure were attached to the patients in the operating room, and blood was sampled from the fingertip for testing blood glucose level using glucometer (Accu-Check Inform II METER with RF card, Roche Diagnostics GmbH, Germany). The reading obtained at this point was considered as the baseline (T0).
After recording of basal glucose level, calculated doses of intravenous fluid were administered according to the allocated group for 20 min before anesthesia. Then, the fluids were changed with physiologic saline as subsequent intravenous fluid until the end of the study. Together with blood glucose level, the heart rate (HR) and the mean blood pressure (MBP) were also measured. A total of six measurements were obtained: T0, baseline before administration of fluid; T1, 20 minutes after the termination of the designated fluid administration; T2, T3, T4, and T5 representing 1, 2, 4, and 6 hours after the termination of the designated fluid administration. After the blood glucose values were obtained, the mean blood glucose levels and serial differences between mean blood glucose level and baseline were calculated.
Patients' characteristics, fasting time, types of operation, operation time, the dosage of fluids administered during surgery, estimated blood loss, as well as the use of phenylephrine and total dosages, were recorded.
Statistical analysis
Sample size was calculated using the G*Power3 free software (available at http://www.gpower.hhu.de). The effect size was assumed according to the Cohen's guidelines for the social sciences and we selected a medium effect size of 0.3 [12]. Using α = 0.05 with a power of 80%, the total sample size was calculated as 54 for the statistical analysis of six consecutive time points measurement of blood glucose level with repeated measures ANOVA between different factors with a correlation of 0.5. After assuming a 10% drop out rate, 30 patients were allocated to each group.
Data were analyzed using SPSS (Windows ver. 12.0, SPSS Inc., Chicago, IL, USA) and all the results are presented as mean ± standard deviation (SD). Statistical analysis was performed after the normality assessment with Kolmogorov-Smirnov test. A Student's t-test was performed to evaluate statistical significance between the two groups for age, height, body mass index (BMI), the dosage of administered fluids during surgery, and fasting time. The non-parametrically distributed weight, operation time, estimated blood loss, and total dosage of phenylephrine used were analyzed by the Mann-Whitney U test. Fisher's exact test was performed for the analyses of gender, ASA score, type of operation, and the use of inotropics, which were non-parametrically distributed.
Two-way ANOVA with repeated measures for one factor was performed to compare the differences of MBP, HR, and blood glucose level between the groups. Values with P < 0.05 were considered statistically significant. Post hoc analysis was done with a t-test. Bonferroni's correction was applied and values with P < 0.0083 were considered statistically significant between the groups.
Results
A total of 67 patients were assessed for eligibility, and 60 patients decided to participate. A total of 58 patients were enrolled and examined. Two patients were excluded as general anesthesia replaced the spinal anesthesia due to an unexpected prolongation of surgery (Fig. 1).
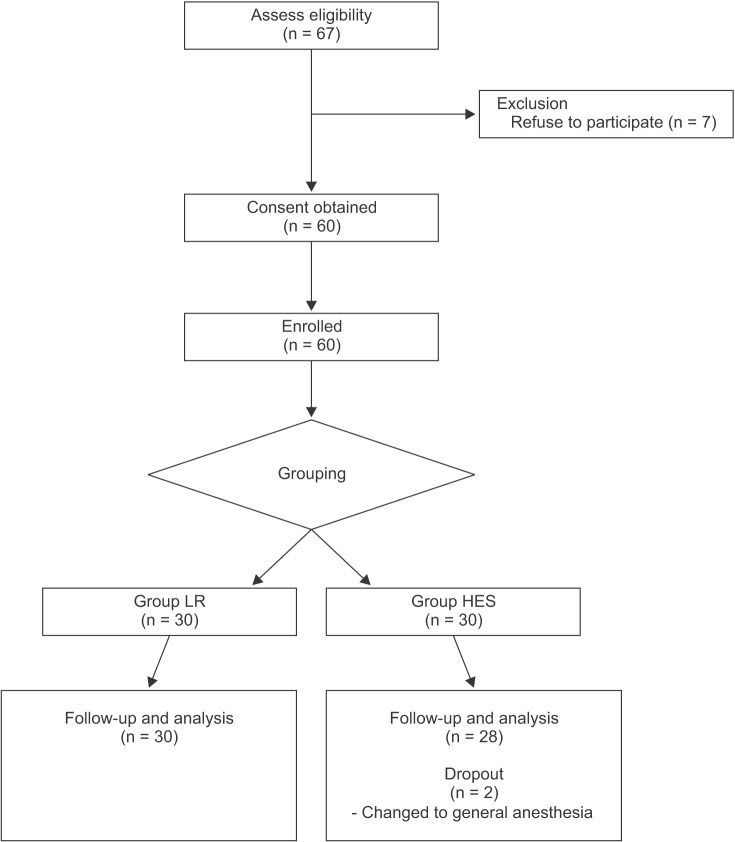
Consort flow diagram for the study. Group LR: preloading with lactated Ringer's solution, Group HES: preloading with hydroxyethyl starch.
There were no significant differences in the patients' characteristics between the two groups (Table 1).
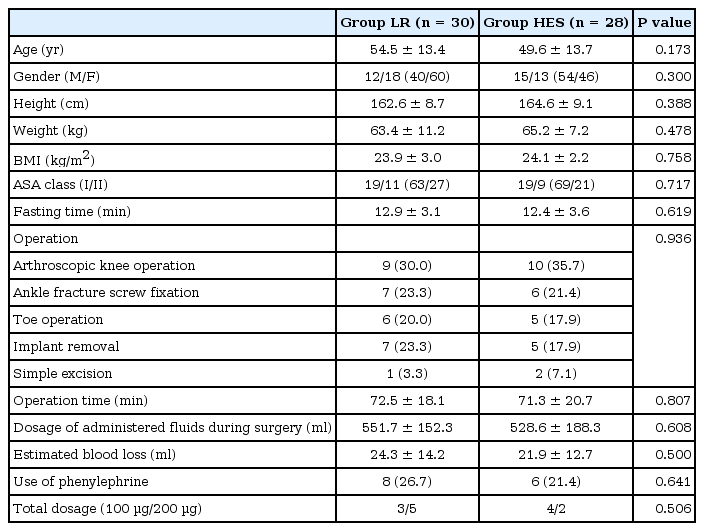
Patient Characteristics
Mean blood glucose levels at T5 in the LR group and T4, T5 in the HES group increased significantly compared to baseline (Fig. 2).

Changes in mean blood glucose levels. Group LR: preloading with lactated Ringer's solution, Group HES: preloading with hydroxyethyl starch, T0: baseline before administration of fluid, T1: 20 min after finishing designated fluid administration, T2: 1 h after finishing designated fluid administration, T3: 2 h after finishing designated fluid administration, T4: 4 h after finishing designated fluid administration, T5: 6 h after finishing designated fluid administration. *P < 0.05 compared to the baseline (T0).
Because the glucose levels of T0 were different between the two groups, and the mean blood glucose levels in the LR group were higher than those of the HES group at all 6 time-points, we performed a multilevel mixed model analysis and the results showed a significance value of 0.879. Thus, we assumed the observed changes of glucose levels over time were not significantly different between the groups. Since the significance value of Mauchly's test was 0.000 and Greenhouse-Geisser estimate of sphericity (ε) was 0.617, we used Greenhouse-Geisser test for sphericity correction. There were no significant differences in the serial differences between mean blood glucose levels and baseline after fluid preloading between the two groups (P = 0.908, Table 2).

Serial Differences of Mean Blood Glucose Levels from Baseline between the Groups
There were no significant differences in HR (P = 0.080, Greenhouse-Geisser correction) and MBP (P = 0.566, Greenhouse-Geisser correction) between the groups (Fig. 3).
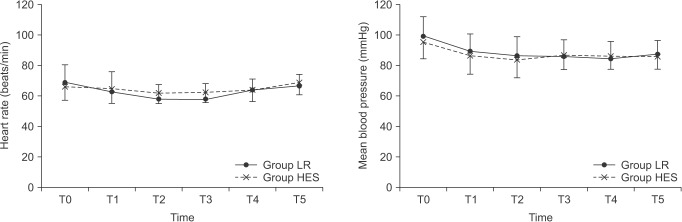
Changes in mean blood pressure and heart rate. Group LR: preloading with lactated Ringer's solution, Group HES: preloading with hydroxyethyl starch, T0: baseline before administration of fluid, T1: 20 min after finishing designated fluid administration, T2: 1 h after finishing designated fluid administration, T3: 2 h after finishing designated fluid administration, T4: 4 h after finishing designated fluid administration, T5: 6 h after finishing designated fluid administration.
Discussion
In this study, we assessed changes in blood glucose levels after the administration of 6% HES-130 and lactated Ringer's solution during lower limb surgery in non-diabetic patients. We found that there are no significant differences in the serial differences of mean blood glucose levels from baseline between the administration of 6% HES-130 and lactated Ringer's solution.
As mentioned earlier, the structure of HES is similar to that of glycogen as it contains conformationally different polysaccharides; therefore, it is metabolized by serum amylases [7]. The original form of starch is not used as volume expander because it is hydrolyzed fast by serum amylases [13]. HES is made by substituting hydroxyl residues of starch with hydroxyethyl residues in order to delay the hydrolysis by serum amylases [14]. Especially, the inhibition of plasma amylase and the consequent increase in the intravascular half-life of the HES solution is more prominent when the hydroxyethyl residues are bound to the C2 position of glucose [14]. Thus, HES has the potential to increase blood glucose level after administration.
HES metabolism has been studied on animals and it was found that HES infusions did not change blood glucose levels [1516]. Because HES metabolism results in the production of increasingly smaller molecules (down to about 40,000 to 50,000 D), which are excreted in urine, degraded molecules are rapidly excreted without further metabolism and glucose formation [17]. It is known that the initial rapid amylase-dependent break-down occurs immediately after HES infusion and within the first 24 h, 50% of the administered dose is excreted by the kidneys [14]. These might be the reasons why HES does not alter blood glucose levels significantly.
However, other studies reported that increased blood glucose levels were observed after the administration of HES in non-insulin-dependent diabetics; indeed, Murty et al. [8] reported that HES increased blood glucose levels significantly compared to lactated Ringer's solution. They also demonstrated that the rise in blood glucose levels started within fifteen minutes of HES administration, and the peak was reached after two hours of administration. Patki and Shelgaonkar [11] reported a sustained and statistically significant rise in blood glucose levels after HES administration. Our study demonstrated a statistically significant rise in blood sugar levels (still within the physiological limits) from the baseline to 4 h after terminating HES administration. In addition, serial differences of mean blood glucose levels from baseline showed no differences between the HES and the LR groups. This discordance might be explained by the use of different HES solutions. In previous studies, 6% HES-450 was used as oppose to 6% HES 130/0.4, used in our study [811]. Compared to 6% HES-450, 6% HES 130/0.4 has a lower molecular weight and lower degree of substitution, and thus provides less plasma accumulation because of the shorter half-life and quick hydrolysis by serum α-amylase [1718]. Less plasma accumulation and rapid elimination due to the lower molecular weight might play a role in diminishing the effect of HES on the changes of glucose levels. Moreover, Volulyte 6%™ contains acetate, which is quickly converted to acetyl-CoA by the enzyme acetyl-CoA synthetase [19]. Previous reports showed that intravenous administration of sodium acetate had a large suppressive effect on fat and carbohydrate utilization and decreased plasma glucose concentration [1920]. Hence, it is possible that the acetate contained in the HES solution used in the study suppressed the rise of glucose levels.
There are limitations to this study. Firstly, there were significant differences in the basal glucose levels between the two groups. Thus, it is possible that the patients' characteristics might be different between two groups, hence affecting the results of our study. However, there were no statistical differences in age, gender, BMI, fasting time, operation time, input, estimated blood loss, etc. The mean age was higher in the LR group than in the HES group (54.5 vs. 49.6). The prevalence of impaired fasting glucose (IFG) shows a tendency to increase with age after 40 years. Overall, 28.4% of patients > 50 years of age, had IFG whereas only 20.0% of subjects < 50 years of age had an abnormal fasting blood glucose level [21]. Based on this study, we would expect basal glucose levels to be higher in the LR group compared to the HES group. Therefore, we applied a multilevel mixed model and Greenhouse-Geisser test for the sphericity correction. According to the results with applied multilevel mixed model and sphericity correction, we calculated that there were no significant differences in the changes of glucose levels according to time, between the two groups. Secondly, the stress of surgery itself can produce hyperglycemia via catecholamine release [9]. However, local anesthesia can abolish adrenocortical and glycemic responses to surgery by blocking both the afferent input from the operative site to the central nervous system, and the efferent autonomic neuronal pathways to the liver and adrenal medulla [9]. In this study, all patients had spinal anesthesia and the surgery duration was relatively short with minimal blood loss. Therefore, most of the confounding factors that could have influenced blood glucose levels were excluded. However, we do not feel confident to ignore a possible surgical stress effect after recovery from spinal anesthesia or an insulin intolerance caused by fasting, because blood glucose levels were indeed significantly elevated 4–6 hours after the administration of designated fluids. It would appear that the increase in blood glucose level observed is not related to the 6% HES-130 administration, but to surgical stress, and insulin intolerance after fasting. Furthermore, we cannot exclude the fact that lactated Ringer's solution did not increase blood glucose concentration, as lactated Ringer's solution itself can induce hyperglycemia through the conversion of lactate to glucose (Cori's cycle) [22]. However, the ability of lactated Ringer's solution to induce hyperglycemia should only concern diabetic patient, because impairment of peripheral lactate disposal due to inactivation of pyruvate dehydrogenase occurs only in diabetic patients, [22]. In our study, we included only non-diabetic patients and further studies with diabetic patients are indeed needed. Finally, we injected 6% HES-130 and lactated Ringer's solution before spinal anesthesia as a preanesthetic administration. However, prehydration with crystalloid or colloid is not usually associated with a lesser degree of hypotension [6]. The aim of the study was to explore whether HES increased the blood glucose level in non-diabetic patients. We enrolled patients undergoing minor lower limb surgery with minimal blood loss under spinal anesthesia and found that clinical application of HES before spinal anesthesia as a prehydration method is reasonable.
In conclusion, 6% HES-130 increased the blood glucose levels within the physiologic limits, and there were no significant differences in the serial differences of mean blood glucose levels over time between administration of 6% HES-130 and lactated Ringer's solution. This result indicates that the degree of glucose increase in the presence of 6% HES-130 is not greater than that with lactated Ringer's solution. Furthermore, we found no evidence that 6% HES-130 induces hyperglycemia compared to lactated Ringer's solution, in non-diabetic patients.
Acknowledgments
This study was supported by research funds from Chosun University, 2014.