Effect of neuromuscular blockade reversal by pyridostigmine on spectral entropy values during recovery from desflurane anesthesia: a prospective, randomized, double-blind, controlled trial
Article information

Abstract
Background
According to several studies investigating the relationship between muscle activity and electroencephalogram results, reversal of neuromuscular blockade (NMB) may affect depth of anesthesia indices. Therefore, we investigated the effect of pyridostigmine on these indices via spectral entropy.
Methods
Fifty-six patients scheduled for thyroidectomy or parotidectomy were included in this study and randomized into two groups. At the start of skin suturing, the desflurane concentration was adjusted to 4.2 vol% in both groups. Following this, the pyridostigmine group (group P, n = 28) was administered pyridostigmine 0.2 mg/kg mixed with glycopyrrolate 0.04 mg/kg, while the control group (group C, n = 28) received normal saline. Entropy values (response entropy [RE] and state entropy [SE]), train of four (TOF) ratio, and end-tidal desflurane concentration were recorded from point of drug administration to 15 minutes post-drug administration.
Results
Mean RE values at 15 minutes, when the maximum effect of pyridostigmine was anticipated, showed a statistically significant difference between groups (53.8 ± 10.5 in group P and 48.0 ± 8.8 in group C; P = 0.030). However, mean SE at 15 minutes showed no significant difference between the two groups (P = 0.066). At 15 minutes, there were significant differences in the TOF ratio between the two groups (P < 0.001).
Conclusions
NMB reversal by pyridostigmine significantly increased RE values but not SE values. This finding suggests that spectral entropy may be a useful alternative tool for monitoring anesthetic depth during recovery from anesthesia in the presence of electromyogram activity.
Introduction
Various monitoring tools developed to assess the depth of anesthesia are routinely utilized in clinical practice [1]. Among these, the bispectral index (BIS) is the most commonly applied and integrates three different descriptors of an electroencephalogram (EEG) into a single metric by Fourier spectral analysis [2]. Another tool for monitoring anesthetic depth, spectral entropy, quantifies the degree of EEG irregularity by adopting the concept of entropy in physical science [3]. In contrast with other processed EEG devices, entropy provides two distinct values, response entropy (RE) and state entropy (SE). The SE is computed over the EEG-dominant part of the frequency spectrum (0.8–32 Hz) and is thought to reflect the cortical state of the patient. The RE is computed over the 0.8–47 Hz frequency range and incorporates both the EEG-dominant and electromyogram (EMG)-dominant parts of the spectrum. Consequently, RE can serve as an indicator for detection of facial muscle activity. Bruhn et al. [4] reported the first two cases of falsely increased BIS by EMG activity in non-paralyzed patients, and since then, EMG has been considered the main cause of EEG contamination, with the potential to increase and interfere with BIS values. According to the characteristics of entropy, particularly the RE value calculated from EEG data, the inclusion of EMG-dominant frequencies can be influenced by neuromuscular blockade (NMB). Liu et al. [5] demonstrated that a muscle relaxant reduced BIS and RE, but not SE values, during induction of anesthesia using propofol-remifentanil. Kim et al. [6] showed that both SE and RE significantly decreased following administration of a muscle relaxant during light general anesthesia, maintaining the SE value at 80. In addition to these studies investigating the relationship between NMB and anesthetic depth indices, several researchers have also investigated the correlation between reversal of NMB and indices of anesthetic depth. Neostigmine, the cholinesterase inhibitor most widely used to reverse muscle relaxants, has been shown to significantly increase BIS [7], with values remaining unchanged in patients with no EMG activity post administration of a NMB reversal agent [8]. With regard to the potential influence of EMG activity on indices of anesthetic depth, entropy may be a useful device for assessing the effects of cholinesterase inhibitors. Distinguishing between RE and SE values is expected to allow clinicians to recognize whether an increase in the value of an index originates from the EEG or from the EMG during recovery from anesthesia.
The aim of this study was to evaluate the effect of pyridostigmine, another cholinesterase inhibitor commonly administered to reverse NMB in clinical practice, on indices of anesthetic depth through application of spectral entropy. We investigated changes in the RE and SE values following administration of this NMB reversal agent during recovery from desflurane anesthesia.
Materials and Methods
Informed written patient consent was obtained, along with approval from the Institutional Review Board at our medical center. A total of 56 patients aged 20–60 years with an American Society of Anesthesiologists physical status of I or II and scheduled for elective thyroidectomy or parotidectomy under general anesthesia were included in this prospective, randomized, double-blind study. Patients were randomized to either a pyridostigmine group (group P, n = 28) or a control group (group C, n = 28) using a computer-generated program. Patients were excluded if they had a cardiopulmonary, renal, hepatic, or neurological disorder, a history of drug abuse, or if they were taking cholinesterase inhibitors, antidepressants, or sedatives.
All patients were administered midazolam 0.05 mg/kg intramuscularly 30 minutes prior to induction of anesthesia, and upon arrival in the operating room, standard monitoring, including an electrocardiogram, non-invasive blood pressure measurement, and pulse oximetry, was performed. For monitoring of anesthetic depth, a disposable entropy electrode strip (Entropy sensor™, Datex-Ohmeda, Finland) was placed on the forehead of the patient, and both the RE and SE values were recorded. For monitoring of neuromuscular function, the acceleromyographic train of four (TOF) response of the adductor pollicis muscle was monitored. The electrode of a TOF-WATCH® (Organon, Swords, Dublin, Ireland) was placed on the ulnar nerve pathway of the wrist, and contraction of the adductor pollicis muscle was measured.
Anesthesia was induced using propofol 2 mg/kg and tracheal intubation was facilitated with rocuronium 0.8 mg/kg. Anesthesia was maintained with 4.2–7.8 vol% desflurane in an air/O2 mixture (FIO2 0.5, 4 L/min) and at a remifentanil effect-site concentration of 2–5 ng/ml via a target-controlled infusion (TCI) device (Orchestra®, Fresenius Vial, Brezins, France). Mechanical ventilation was maintained at a tidal volume of 8 ml/kg, and ventilator frequency was adjusted for maintenance of an endtidal CO2 of 30–35 mmHg. When the TOF count exceeded 4 during surgery, rocuronium 0.2 mg/kg was administered.
At the start of skin suturing, the concentration of desflurane was maintained at 4.2 vol% and the effect-site concentration of remifentanil was titrated to 2.0 ng/ml in both groups. Simultaneously, the study drugs were administered in accordance with the random group assignment. The study drugs were prepared beforehand by an independent clinician not involved in this study, and were loaded in identically labelled syringes by an anesthesiologist who was unaware of the patient allocation. Group P received pyridostigmine 0.2 mg/kg mixed with glycopyrrolate 0.04 mg/kg, while group C received an equal volume of normal saline; this time point was defined as "baseline". At baseline and 15 minutes later, RE and SE values, TOF ratio, and end-tidal desflurane concentrations were recorded by another anesthesiologist. The primary endpoints were RE and SE at 15 minutes, at which the maximum effect of pyridostigmine was anticipated [9], and was compared between the two groups separately. To avoid external stimulation, the patients were kept calm in the operating theater and no stimuli were provided during the study period. If patients required muscle relaxants and general anesthetics during the study period due to sudden movement such as coughing or full awakening, they were excluded from the study. Hypothermia reduces the metabolism of NMB agents [10] and alters the response of skeletal muscle to electrical nerve stimulation [11]. Therefore, patients were kept normothermic by application of a forced air warming device (Warmtouch®, Mallinckrodt Medical Inc., St. Louis, MO, USA) to the lower extremities. After all the values at 15 minutes were measured, we followed the standard technique for awakening from general anesthesia.
Based on the study by Jeong et al. [12], the mean BIS value 15 minutes post-administration of pyridostigmine was 68.2 ± 6.2, and was 63.2 ± 6.2 in the control group. We calculated our sample size based on this result because agreement between BIS and entropy is known to be high in paralyzed patients [13]. Assuming a type I error protection of 0.05 and a power of 0.80, 26 patients were required in each group. Therefore, we enrolled 56 patients, allowing for a 10% dropout rate during the study period.
All statistical analyses were performed using Statistical Package for Social Sciences version 19.0.0 software (IBM Corp., Armonk, NY, USA). Normally distributed data were expressed as the mean ± standard deviation (SD) and were analyzed by independent Student's t-test. Nonparametric data were expressed as the median (first quartile [Q1]-third quartile [Q3]) and were analyzed by the Mann–Whitney U test. Categorical data were expressed as number of patients (percentage) and analyzed using the Chi-square test.
Results
Of the 62 eligible patients, 56 were included in this study. No patient was excluded due to awakening or moving abruptly during the study period (Fig. 1). Demographic data are presented in Table 1. There was no difference in patient age, sex, height, weight, body mass index, anesthesia time, operation time, or type of surgery between the two groups (Table 1).
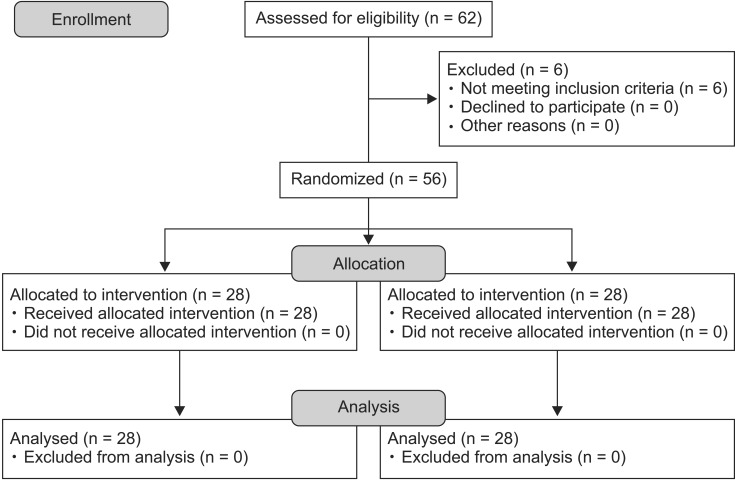
CONSORT flow diagram.

Patient Characteristics
As the primary endpoint, depth of anesthesia indices, including RE and SE, at 15 minutes were compared between the two groups using independent Student's t-test. There was a statistically significant difference in the mean RE value at 15 minutes between the groups (group P, 53.8 ± 10.5; group C, 48.0 ± 8.8, P = 0.030). However, there was no significant difference in the mean SE value (group P, 51.0 ± 9.3; group C, 46.6 ± 8.3, P = 0.066). In addition, the RE-SE difference at 15 minutes was not significantly different between the groups (group P, 2.8 ± 2.7; group C, 1.4 ± 2.3, P = 0.050; Table 2).
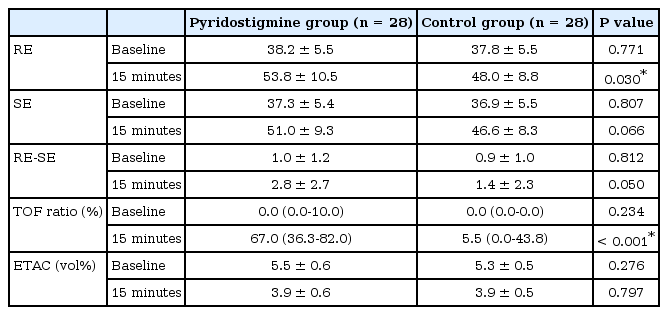
Values at Baseline and 15 Minutes after Administration of Study Drugs
Due to muscle activity, the TOF ratio was significantly different between the two groups at 15 minutes, with median (Q1-Q3) values of 67.0 (36.3–82.0) in group P and 5.5 (0–43.8) in group C (P < 0.001). There was no significant difference in end-tidal desflurane concentrations at 15 minutes between the two groups (group P, 3.9 ± 0.6; group C, 3.9 ± 0.5; P = 0.797; Table 2).
Discussion
The aim of this study was to evaluate the effect of pyridostigmine, an agent used to reverse NMB, on indices of anesthetic depth during recovery from desflurane anesthesia. We investigated changes in both RE and SE values after administration of the study drugs. There was a statistically significant difference in the primary endpoint at 15 minutes, when the maximum effect of pyridostigmine was anticipated, between the two groups with regard to RE values, but not for SE values.
The RE outcomes of the present study were similar to those of a study by Vasella et al. [7], who demonstrated an increase in BIS values following administration of neostigmine, indicating that reversal agents of muscle relaxants can alter the indices of anesthetic depth. There has been some debate surrounding the effect of muscle activity on the anesthetic depth index over the last several years, and the results of these studies remain controversial. One of the hypotheses proposed to elucidate the interaction between muscle activity and EEG is the afferentation muscle spindle theory. This theory states that afferent inputs generated from stretching or contraction of muscle fibers to the arousal centers in the brain may induce arousal, and conversely, NMB can potentially induce sedation by reducing such afferent signals from the muscle fiber. As supporting evidence, Lanier et al. [14] showed that pancuronium reduced EEG activity in lightly anesthetized dogs, and Forbes et al. [15] reported that pancuronium reduced the minimum alveolar concentration (MAC) of halothane by 25% in humans. However, several studies have produced contradictory results. For example, Fahey et al. [16] showed that muscle relaxants did not alter the MAC of halothane, and Messner et al. [17] reported that administration of muscle relaxants in fully awake volunteers temporarily reduced the BIS value due to a reduction of EMG activity, but had no effect on sedation. Therefore, the afferentation theory remains controversial.
Potentially the most plausible explanation with regard to the relationship between muscle activity and the EEG is that EMG arising from the forehead muscles can interfere with indices of anesthetic depth, and consequently, NMB can prevent the EMG signal from disturbing EEG-derived indices. Under such an explanation, changes in EMG activity would affect only the values indicating anesthetic depth, not the actual depth of anesthesia. The beta ratio, an important component required for calculation of the BIS algorithm, is calculated from the frequency range that overlaps EMG frequencies in the 30–47 Hz range. Therefore, EMG frequencies can mimic the 30–47 Hz component of the beta ratio, and may be interpreted as the awake or light anesthesia state in BIS monitoring. Although several revisions to the BIS algorithm have been performed to improve rejection of artifacts, including electrocautery, eye movement, and EMG activity, BIS does not completely exclude potential contamination by the EMG of forehead muscles [18].
In order to overcome the limitations of BIS monitoring, we utilized spectral entropy as an alternative tool for monitoring anesthetic depth in the present study. By applying the concept of entropy to depth of anesthesia, spectral entropy quantifies the degree of asynchrony or variability between EEG signals, reflecting the underlying state of brain activity. During the awakened state, increased irregularity or complexity in EEG signals increases entropy values, while relatively more regular EEG signals during anesthesia reduce entropy values [3]. Entropy provides two values, the SE and RE. SE is predominantly computed over the EEG-dominant part of the frequency spectrum (0.8–32 Hz) and is thought to reflect the cortical state, that is, the level of hypnosis. RE integrates the complete spectrum including both the EEG-dominant and EMG-dominant parts of the spectrum (0.8–47 Hz), and because it is influenced more by muscle relaxants than SE, the RE- SE difference can serve as an indicator of EMG activation [18]. According to such entropy characteristics, unlike other EEG-derived monitoring devices, entropy allows clinicians to distinguish whether an increase in index values originates from the EEG or from the EMG. Furthermore, SE has been reported to be affected by muscle relaxation to a lesser extent than BIS [5,19].
Similarly, in the present study, muscle activity caused by a NMB reversal agent is believed to have resulted in an alteration in the anesthetic depth index, the RE value in particular. Considering muscle activity, the TOF ratio at 15 minutes was significantly different between the two groups, with median (Q1-Q3) values of 67.0 (36.3–82.0) in group P and 5.5 (0–43.8) in group C. Simultaneous with the increase in TOF ratio in accordance with NMB reversal, RE values at 15 minutes also showed significant differences between the two groups, in contrast with SE, and therefore, appear to be influenced by EMG to a greater extent than SE. Unfortunately, while the TOF ratio at 15 minutes showed significant differences between the two groups, recovery from muscle relaxation could not be considered complete, even in group P, in which the TOF ratio was larger than that in group C. Further studies are needed to overcome such limitations, and a comparison of the anesthetic depth indices between the two groups as a primary endpoint when the TOF ratio of patients in group P is restored completely to 90%–100% would enable a more accurate determination of the effect of EMG activity on anesthetic depth indices.
Maintaining depth of anesthesia deep enough to block afferent stimuli throughout the study period is thought to be another reason why the SE value was not significantly different between the groups at 15 minutes. We intended to maintain the endtidal concentration of the inhalational anesthetic agent above 0.7 MAC for prevention of awareness. As a result, end-tidal concentrations of desflurane (mean ± SD) in groups P and C at baseline were 5.5 ± 0.6 and 5.3 ± 0.5, respectively, and 3.9 ± 0.6 and 3.9 ± 0.5, respectively, at 15 minutes. Furthermore, SE values were maintained between 40 and 60, indicating deep sedation or adequate depth of general anesthesia, namely no patient was awakened during the entire study period. Since afferent input signals from the external environment were already blocked in such a deep sedation state, the reversal agent of the muscle relaxant had no further significant effect on SE values. However, in contrast with our findings, the study by Kim et al. [6] showed that both SE and RE values exhibited similar trends in accordance with depth of anesthesia during the study period. According to their study, RE and SE values were significantly reduced by a muscle relaxant in light general anesthesia, maintaining SE 80, while both values showed no significant difference between the muscle relaxant group and the control group in a deeper anesthesia state maintaining SE 60. Therefore, further studies are required with larger sample sizes in order to determine whether muscle relaxants affect SE values.
With regard to other factors affecting the values of entropy, noxious stimulation is known to increase the RE-SE difference [20] because intensive nociceptive stimuli may induce activation of the frontal EMG via the sympathetic nerve system, thereby increasing RE values. If RE values increase 10 units above SE in an adequate SE range (40–60), it is interpreted as a sign of uncovered pain, so an increase in administration of analgesic drugs is recommended. Besides nociceptive stimulation, coughing may also affect EMG activity and increase entropy values. Therefore, in the present study, remifentanil was administered by TCI at a constant effect-site concentration to exclude potential environmental bias. Cho et al. [21] demonstrated that the EC50 of remifentanil TCI, determined by Dixon's up-and-down method, was 1.54 ± 0.70 ng/ml, and the EC95 by probit analysis was 2.88 ng/ml for preventing coughing during emergence from desflurane anesthesia. In our preliminary study, based on the report by Cho et al. [21], tachycardia, hypertension, or coughing frequently occurred at a remifentanil effect-site concentration of 1.5 ng/ml. In contrast, bradycardia and hypotension occurred in a number of patients at a remifentanil effect-site concentration of 2.5–3.0 ng/ml. Therefore, we aimed to maintain the effectsite concentration of remifentanil at 2.0 ng/ml using TCI, and no patient was coughing abruptly during the study period. As an indicator of response to pain, the RE-SE difference was not significantly different between the two groups at baseline and 15 minutes. Moreover, while the RE-SE difference increased above 10 units in three cases in each group, the RE-SE difference values of these six cases were generally within the insignificant level between 10 and 13. Therefore, continuous infusion of remifentanil for minimizing nociceptive stimuli that can influence entropy values combined with administration of desflurane above 0.7 MAC may block the input signal excessively, consequently preventing awakening and coughing successfully, and also even delaying recovery from anesthesia. Unfortunately, we only collected data at 15 minutes post-administration, when the effect of pyridostigmine was expected to be revealed; therefore, this study has a limitation with respect to the length of the study period.
In addition, the fluid flow rate through the intravenous (IV) route or the distance from the three-way tube to the catheter inserted into the patient's vein may have affected the onset time of pyridostigmine administration. Since the fluid flow rate and IV route condition of our patients were not comparable, an interval in excess of 15 minutes would be required to record a more accurate effect of complete reversal of muscle relaxation on anesthetic depth indices.
In conclusion, we demonstrated that pyridostigmine, an agent that reverses NMB, significantly increased RE values due to EMG activation, but did not increase SE values, thereby indicating that SE values are less influenced by EMG activity than RE values. Spectral entropy appears to be a useful alternative tool for monitoring depth of anesthesia during recovery from general anesthesia in the presence of EMG activity post NMB reversal. However, considering the conflicting studies on the relationship between EEG and EMG, we should be cautious when interpreting anesthetic depth indices during recovery from general anesthesia until the effect of muscle activity on the indices can be more clearly identified.