The diabetes-induced functional and distributional changes of the alpha 1-adrenoceptor of the abdominal aorta and distal mesenteric artery from streptozotocin-induced diabetic rats
Article information
Abstract
Background
The aim of this study was to evaluate the effect of diabetes on the function and distribution of vascular α1-adrenoceptors in the abdominal aorta and distal mesenteric artery from streptozotocin (STZ)-induced diabetic rats at the level of the α1-adrenoceptor subtypes.
Methods
Diabetes was induced by a single intravenous injection of STZ (60 mg/kg) in 8 week-old male Sprague-Dawley rats (n = 11). Age-matched normal rats (n = 14) were used as a control group. Four weeks after STZ injection, the tilting-induced change of the mean arterial pressure was recorded. The α1-adrenoceptor subtypes mediating the contractions of the distal mesenteric artery and abdominal aorta were investigated using the agonist phenylephrine and subtype-selective antagonists that included prazocin, 5-methylurapidil and BMY 7378. The expressions of the α1-adrenoceptor subtypes of each artery were examined by immunofluorescence staining using the subtype selective antibodies.
Results
The recovery of the mean arterial pressure was delayed after positional change in the diabetic rats. Compared with that of the normal rats, the contractile response to phenylephrine was increased in the abdominal aortas and it was decreased in the distal mesenteric arteries in the diabetic rats. In addition, compared with the normal rats, the fluorescent intensity of all the α1-adrenoceptor subtypes was increased in the abdominal aortas and it was decreased in the mesenteric arteries of the diabetic rats.
Conclusions
Diabetes increased the contractility of the abdominal aorta in response to phenylephrine, yet diabetes decreased that of the mesenteric arteries in the STZ-induced diabetic rats. Those results are mainly based on the overall change of the α1-adrenoceptor, and not on the change of the specific α1-adrenoceptor subtypes.
Introduction
Diabetes affects approximately 100 million persons worldwide [1], and it damages the cadiovascular autonomic nerve fibers mainly because of the sympathetic denervation of the heart and the blood vessels (diabetic cardiovascular autonomic neuropathy) [2,3]. This change usually leads to arterial stiffness [4], but it leads to vasodilation in the peripheral arteries [5]. This vascular denervation also changes the blood flow responsiveness to various stimuli. For example, the peripheral vasoconstriction in response to sympathetic stimuli such as standing up or coughing is reduced [2]. Moreover, a previous study has shown that vasopressor support was needed more often during anesthesia in diabetic patients with autonomic dysfunction that in diabetic patients without autonomic dysfunction during anesthesia because the normal autonomic response of vasoconstriction and tachycardia did not completely compensate for the vasodilating effects of anesthesia [6]. Therefore, it has been suggested that preoperative cardiovascular autonomic screening of diabetic patients may be very useful for anesthesiologists [3].
The α1-adrenoceptor plays an important role in the vascular sympathetic system to maintain the peripheral vascular resistance and the systemic arterial pressure [7-10]. Moreover, it is generally accepted that there are 3 functional α1-adrenoceptor subtypes called α1A, α1B, and α1D and that the distribution of those α1-adrenoceptor subtypes is different according to the types of arteries [11,12]. Considering these findings, the diabetes-induced functional and distributional changes of the vascular α1-adrenoceptor in different arteries would play a role in the pathogenesis of diabetic vascular autonomic disturbance.
Yet to the best of our knowledge, the previous studies did not show consistent results about adrenergically mediated vasocon-striction in diabetic rats [13-15]. Moreover, there has been no study that has focused on the diabetes-induced distributional change of the α1-adrenoceptor or the α1-adrenoceptor subtypes according to the different types of arteries.
Therefore, we evaluated the effect of diabetes on the function and distribution of the vascular α1-adrenoceptor, at the level of α1-adrenoceptor subtypes, using the abdominal aorta and distal mesenteric artery in streptozotocin (STZ)-induced diabetic rats.
Materials and Methods
Animals
Eight-week-old male rats (n = 25) were used for this study. All the rats were housed at 22 ± 2℃ with 40-60% humidity in a 12/12-h light/dark cycle, and they were maintained on a diet of animal chow and water ad libitum. All the animal studies were carried out in a semi-pathogen-free barrier zone at the Institute for Laboratory Animal Research in Seoul National University Hospital in accordance with the procedure outlined in the Guide for the Care and Use of Laboratory Animals.
Induction of diabetes mellitus
The rats were randomly allocated into either the control group (n = 14) or the diabetic group (n = 11). Diabetes was induced by intravenous administration of a single dose of STZ (60 mg/kg in citrate buffer, pH 4.5) through the tail vein. In the normal group, the same volume of citrate buffer was injected intravenously. Three days after STZ-injection, the blood glucose levels were measured from a drop of blood using a OneTouch Ultra® Blood Glucose Meter (LifeScan, Inc) for determining the successful induction of diabetes. Rats with a blood glucose level > 300 mg/dl were considered diabetic. All the rats were maintained for 4 weeks before intervention.
Changes in the arterial blood pressure related to tilting
The rats' blood glucose levels and body weight were measured four weeks after STZ or citrate buffer injection. For each rat, anesthesia was induced with sevoflurane with the rat in a chamber, and the anesthesia was maintained with 2 vol% sevoflurane. Following anesthesia, the rat was placed in a supine position and the four legs and upper front teeth were firmly fixed on a tilt board. The tail artery was cannulated with a 24 G catheter for continuous arterial pressure monitoring. To prevent the effect of postural change on measuring arterial pressure, the transducer was positioned at the level of the heart. After measuring the mean arterial pressure at the supine position (basal MAP), the table was vertically tilted at 45° angle in the head-up direction and the MAPs at 10, 30, 60 and 120 seconds after tilting were recorded. The changes in the MAP related to tilting were compared at each time point between the diabetic and control groups.
Preparation of vascular tissues
After the tilting experiment, the rat was euthanized by cervical dislocation under the deep anesthesia and the third branch of the mesenteric artery and the abdominal aorta were rapidly removed. The arteries were placed on a Petri dish with ice-cold modified Krebs' solution of the following composition (in mM): NaCl: 119, KCl: 4.7, MgSO4: 1.17, NaHCO3: 22, CaCl2: 1.6, HEPES: 8, KH2PO4: 1.18, d-glucose: 5, and the arteries were cleaned of fat and connective tissues under a microscope (Zeiss). In addition, the Petri dish was kept cold by surrounding it with crushed ice. Following the cleaning procedure, to exclude the effect of endothelium-derived relaxing factor, the endothelium of the arteries was removed by gently rubbing the lumen with coarse silk and each artery was cut into 3-mm ring segments for the in vitro contractile studies.
Measurement of isomeric tension
Each ring segment was suspended between two triangle-shape tungsten hooks, and this was mounted in a 5 ml water-jacketed temperature-controlled tissue bath (Harvard Apparatus, Holliston, MA, USA) that contained modified Krebs' solution. The lower and upper hooks were attached, respectively, to the bottom of the bath chamber and to a force displacement transducer (NP 72-4493, Harvard Apparatus, Holliston, MA, USA). The tissue bathing solution was gassed with a mixture of 95% O2 and 5% CO2 (pH: 7.38-7.42, pCO2: 34-36 mmHg) and maintained at 37℃. Propranolol (1 × 10⁻⁶ M) and yohimbine (1 × 10⁻⁷ M) were always included in the tissue bathing solution to block the β- and α2-adrenoceptors, respectively. The isometric contractions were recorded using an A/D converter (Powerlab®, ADInstruments, Colorado Springs, CO, USA) and they were analyzed by using Chart for Window Software® (ADInstruments, Colorado Springs, CO, USA).
Following applying an initial tension of 2.0 g, which provided the optimum concentration-response relationships to KCl 60 mM, the arterial strips were allowed to equilibrate for 60 min. When the resting tension reached a stable baseline, no attempt was made to adjust the tissue tension. After the equilibrium, tissues were primed by the addition of phenylephrine (1 × 10⁻⁶ M) to the organ bath. After a steady-state contraction was achieved, the bath contents were replaced with drug-free buffer several times. The tissues were then allowed to reach baseline tension, and the priming procedure was repeated once more before constructing the concentration-response curves. This priming procedure reduces tissue variability in response to repeated agonist administration. In addition, the absence of functional endothelium was also confirmed by the loss of the relaxation response to acethylcholine (1 × 10⁻⁶ M) in the pre-contracted rings with a priming dose of phenylephrine (1 × 10⁻⁶ M) during the priming procedure.
Construction of the concentration-response curves
Reproducible cumulative concentration-response curves were constructed by exposing each artery to increasing concentrations (0.5 log unit increments) of phenlyephrine (1 × 10⁻⁹ to 1 × 10⁻⁴) until a sustained maximum response (Emax) was observed. The concentration-response curves to phenylephrine were then obtained (60 min apart each) in the presence of four selective α1-adrenoceptor antagonists to each artery and the procedure was repeated with a high concentration of antagonists in the same preparation. The incubation time for the selective α1-adrenoceptor antagonists prazosin (α1; 1, 3 and 10 × 10-9 M), 5-methylurapidil (5-MU; α1A; 3, 10 and 30 × 10-8 M), and BMY 7378 (α1D; 3, 10 and 30 × 10-8 M) was 30 min. In all the experiments, one preparation was run in parallel with the experimental tissues, but it received no antagonist, and it was used to determine any time-dependent changes in agonist sensitivity. Propranolol (1 × 10⁻⁶ M) and yohimbine (1 × 10⁻⁷ M) were always included in the tissue bathing solution to block the β- and α2-adrenoceptors, respectively.
Immunofluorescence staining
After removing the vessels and cleaning the extraneous tissues, the arteries were cut into 2-mm rings, embedded in OCT compound (Tissue-Tek® OCT™ Compound, Sakura Finetek) and quickly frozen (-50℃ in isopentane cooled with dry ice). The frozen blocks were cut into 5-µm sections and mounted on the slide. All the sections were stored at -80℃ until use. After warming at room temperature for 30 minutes, the tissue sections were fixed in iced cold acetone for 5 minutes. Following rinsing the sections in PBS, a blocking solution with 10% normal donkey serum was placed on the sections and this was incubated for 30 minutes to block the non-specific binding sites of immunoglobulin. After removal of the blocking solution, the tissue section was incubated with the 1 : 100-diluted primary antibody (α1D-AR cat. no. s.c.-1475, α1B-AR cat. no. s.c.-1476, α1A-AR cat. no. s.c.-1477; Santa Cruz Biotechnologies) for 60 minutes at room temperature. Following washing the primary antibody in PBS, fluoresceinisothiocyanate (FITC)-conjugated donkey anti-goat IgG (1 : 100 dilution, no. s.c.-2024; Santa Cruz Biotechnology, Santa Cruz, CA, USA) secondary antibody was placed on the sections for 60 minutes in the dark at room temperature. After removing the secondary antibody by washing with PBS, mounting media was placed and a glass coverslip was applied. For reducing the technical errors, the staining was performed in one slide for same type of artery from two different groups. Three independent investigators observed the expression of the α1-adrenoceptor subtypes of each artery with using a fluorescence microscope (Olympus VENOX-AHBT3, Tokyo, Japan).
Statistical analysis
The data is presented as means ± SDs, means ± SEMs, number of rats or number of arterial segments. In each concentration-response curve, the changes in tension related to increasing concentrations of phenylephrine are expressed as the difference of tension (g) between the basal values and the measured value in a certain concentration of phenylephrine. The curves were fitted to all the data by non-linear regression analysis using GraphPad Prism software (GraphPAD software, San Diego, CA, USA) to calculate the negative logarithm of the concentration of agonist that provokes a half-maximal response (pEC50 = agonist potency). The pA2 values and Schild slopes were calculated by the method of Arunlakshana and Schild [16]. Using three different concentrations of each antagonist, the ratios between the half-maximal concentrations (EC50) of phenylephrine obtained in a specific antagonist concentration and that obtained in its absence (the concentration ratio, R) were respectively calculated when the maximal amplitudes between the concentration-response curves in those two conditions were similar. The data was plotted as negative log-concentrations of the antagonist on the x-axis vs. log (R-1) on the y-axis and the data was fitted as a regression line. For calculation purposes, the slope parameter was set to -1.0 when it was statistically not different from unity. The x-intercept of the fitted regression line was the estimated pA2. pA2 is the estimated equilibrium dissociation constant for the specific antagonist and also the dose of antagonist that requires a 2-fold increase in the agonist concentration. Student's t-test was used to determine the statistical differences between the diabetic and control groups. A P value < 0.05 was considered statistically significant.
Results
Induction of diabetes mellitus and the changes in arterial blood pressure related to the tilting
The initial body weight was 242.8 ± 18.9 g for the diabetic rats and 244.7 ± 14.8 g for the normal rats, respectively (P = 0.79). Four weeks after diabetic induction, the body weight was 242.3 ± 28.0 g and the blood glucose level was 481.7 ± 110.5 mg/dl in the diabetic rats. However, the body weight and blood glucose level in the normal rats were 428.5 ± 21.3 g and 133.1 ± 31.5 mg/dl, respectively. The diabetic rats showed a significantly higher blood glucose level and a lower body weight than that of the normal rats (all P values < 0.001).
After vertical tilting the table at 45° in the head-up direction, the recovery of the mean arterial pressure was significantly slower in the diabetic rats than in that in the normal rats (Fig. 1).

Time course for the change in the mean arterial pressure (MAP) after tilting in the streptozotocin-induced diabetic (■) and normal (▲) rats. Each data point represents the mean ± SD. *P < 0.01 vs. the normal rats.
Concentration-response curves
The diabetic rats showed a significantly higher Emax and pEC50 than that of the normal rats on the phenylephrine-induced concentration-response curve of the abdominal aorta (all P values < 0.001, Table 1 and Fig. 2A). However, in the distal mesenteric arteries, the diabetic rats showed a lower Emax and pEC50 than that of the normal rats (all P values < 0.001, Table 1 and Fig. 2B).
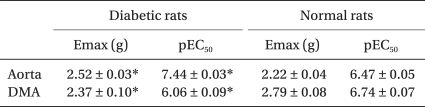
Maximal Response (Emax) and the pEC50 Values for Phenylephrine- induced Contraction of the Aorta and Distal Mesenteric Artery from Streptozotocin-induced Diabetic and Normal Rats
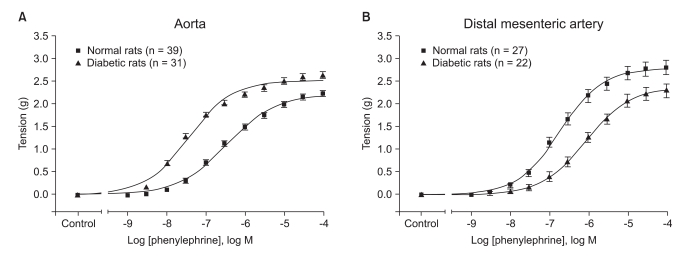
Concentration-response curves for phenylephrine-induced contraction of the aorta (A) and the distal mesenteric artery (B) and as obtained from the streptozotocin-induced diabetic (■) and normal (▲) rats. Tension is expressed as the difference between the measured value and the basal value at each point. Each data point represents the mean ± SEM.
Regardless of the arterial type, prazocin, 5-MU and BMY 7378 shifted the concentration-response curve according to phenylephrine to the right direction for both the diabetic and normal rats (Fig. 3).
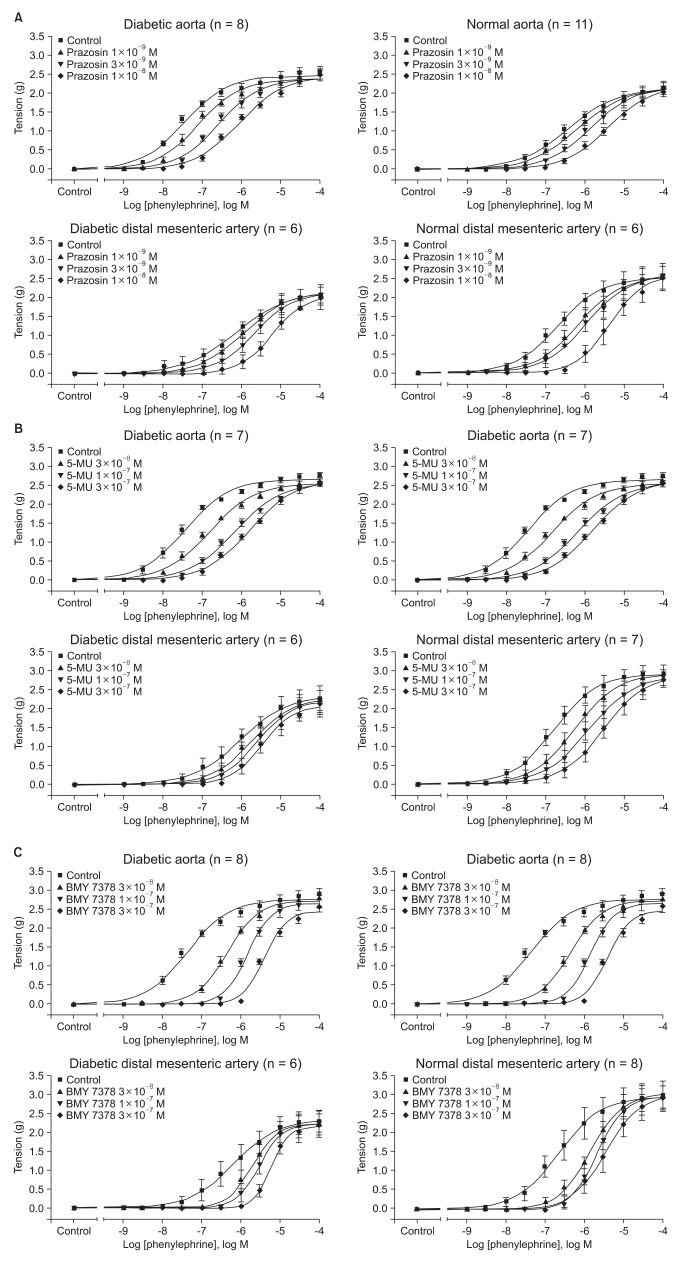
Effects of prazosin (A), 5-methyurapidil (5-MU,) (B) and BMY 7378 (C) on the concentration-response curve of contraction in response to phenylephrine in the aorta and distal mesenteric arteries from the streptozotocin-induced diabetic and normal rats. Tension is expressed as the difference between the measured value and the basal value at each point. Each data point represents the mean ± SEM.
In addition, the pA2 values of prazocin, 5-MU and BMY 7378 for inhibiting the contractile response to phenylephrine increased a half order of magnitude in the abdominal aorta from the diabetic rats, but this all decreased by a similar order of magnitude in the distal mesenteric arteries from the diabetic rats, respectively (all P < 0.001, Table 2).

The pA2 Values Against Phenylephrine in the Aorta and Distal Mesenteric Artery from the Streptozotocin-induced Diabetic and Normal Rats
Immunofluorescence staining
The diabetic rats showed an increased fluorescent intensity of all the α1-adrenoceptor subtypes in the abdominal aorta (Fig. 4A). However, in the distal mesenteric arteries, the fluorescent intensity of all the α1-adrenoceptor subtypes was decreased in the diabetic rats (Fig. 4B).
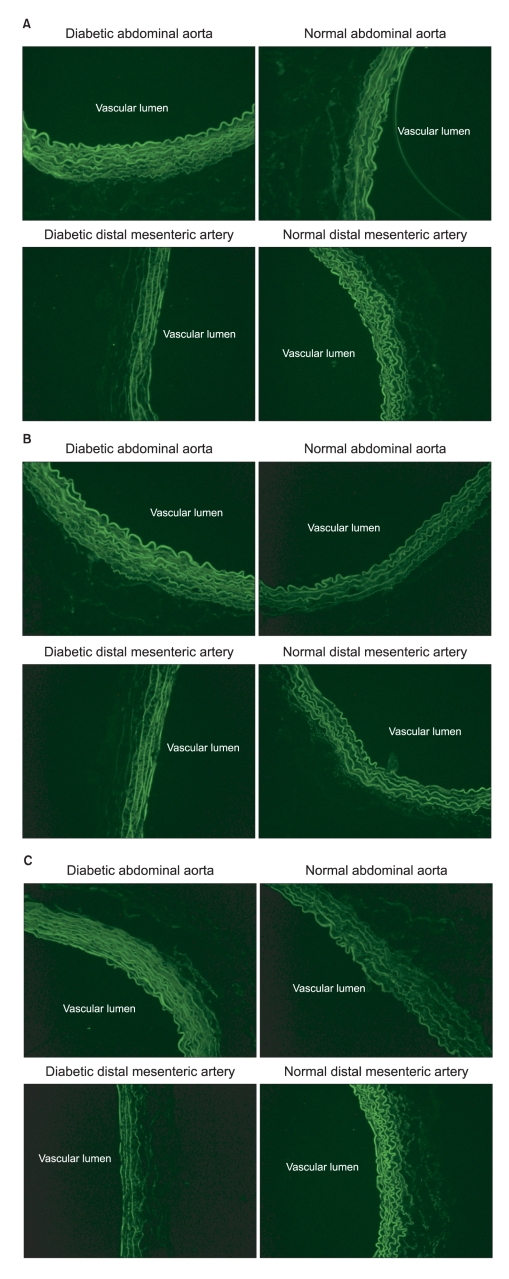
Immunofluorescence images of the α1A- (A), α1B- (B) and α1D- (C) adrenoceptor subtypes in the abdominal aorta and distal mesenteric arteries from the streptozotocin-induced diabetic and normal rats (magnification: ×200). The abdominal aorta showed increased fluorescent intensity in the diabetic rats, but the distal mesenteric arteries showed decreased fluorescent intensity in the diabetic rats.
Discussion
Our results showed that diabetes impaired the MAP recovery after positional change in rats, and that the phenylephrine-mediated vascular contractility of diabetic rats was increased in the abdominal aorta and decreased in the distal mesenteric arteries compared with that of the normal rats. In addition, the diabetic abdominal aorta showed the increased fluorescent intensity of all the α1-adrenoceptor subtypes, but the fluorescent intensity of all the α1-adrenoceptor subtypes was decreased in the diabetic distal mesenteric arteries. However, the functional and distributional changes related to diabetes would be based on the increase or decrease of the overall α1-adrenoceptors, and it is not based on changes of the specific α1-adrenoceptor subtypes.
The vascular α1-adrenoceptor plays a primary role in maintaining the systemic arterial pressure and arteriolar resistance [7-10]. Since the first report of strong evidence for pharmacologically distinct α1-adrenoceptor subtypes in 1982 [17], numerous studies have assessed the function, distribution and classification of each subtype. It is now well known that there are 3 functional α1-adrenoceptor subtypes (α1A, α1B, and α1D) corresponding to the 3-cloned α1-adrenoceptor [11]. In addition, recent studies have shown that the α1D-adrenoceptor plays a major role in the vasoconstriction of the mesenteric arteries [18,19] and that the α1A-adrenoceptor plays a major role in the vascular contraction of the distal mesenteric arteries [19]. Moreover, Asbún-Bojalil et al. [20] suggested that the role of the α1D-adrenoceptor is the most important for the contractile response to phenylephrine in both the abdominal and thoracic aortas. Therefore, in this study, to evaluate the effect of diabetes on the α1-adrenoceptor or the α1-adrenoceptor subtypes of the different types of artery, the abdominal aorta and the distal mesenteric artery were chosen as the conductive artery and the resistant artery, respectively.
Positional change of the arterial pressure was assessed for testing the appropriateness of our diabetic model; 4 weeks after diabetic induction by STZ intravenous injection, the diabetic rats showed impaired recovery from the tilt-induced decrease in blood pressure. This phenomenon was very comparable with orthostatic hypotension. Considering that orthostatic hypotension is the most serious clinical consequence of diabetes-induced vascular disturbance [2], our diabetic rat model would be appropriate for evaluating the effect of diabetes on the vascular alpha 1-adrenoceptor.
In this study, the responses of the α1-adrenoceptor to phenylephrine were different between the abdominal aorta and the mesenteric arteries according to the presence of diabetes. In the abdominal aorta, diabetes increased the Emax over 10%. In addition, the diabetic abdominal aorta showed an EC50 in a 10-times lower concentration of phenylephrine than that of the normal abdominal aorta. This result corresponds with the previous studies where diabetes increased the adrenaline-mediated contractility in the aorta [21-24].
However, the diabetic distal mesenteric arteries showed lower a Emax by over 15% and the EC50 in a 5-times higher phenylephrine concentration than did the normal distal mesenteric arteries. This finding is incompatible with the previous studies where the contractility of diabetic superior mesenteric arteries to α1-adrenoceptor agonists was increased [25-27]. However, various contractile responses of the α1-adrenoceptor in the superior mesenteric arteries to adrenergic agonist have been reported [28]. It has also been suggested that those various results were caused not only from the different experimental methods, but also from the different vascular responses between the superior and distal mesenteric arteries [28]. In addition, in the study using methoxamine by Makino and Kamato [29], the maximum contractile response was impaired in the diabetic mesenteric arteries. Moreover, the results of our immunofluorescence staining were also in accordance with our different contractile responses to phenylephrine between the abdominal aorta and the distal mesenteric arteries. Therefore, we speculate that the inconsistent results might have been caused by the different vascular characteristics between the superior and distal mesenteric arteries.
There were several limitations in this study. First, in this study, all the results would be based on the overall changes in the α1-adrenoceptor. Therefore, the authors found no difference of the diabetes-induced functional and distributional changes of the specific α1-adrenoceptor subtypes. However, this is still the first study that has evaluated the relationship between diabetes and the α1-adrenoceptor subtypes. Second, the distribution of the α1-adrenoceptor subtypes was not quantified using Western blotting. In our experiments, we failed to get consistent results for Western blotting. Therefore, we could not quantify our results. However, consider a recent report that used commercial antibodies for the α1-adrenoceptor subtypes [30], and that inconsistency might have been caused by the limitations of the commercial antibodies. Moreover, that previous report has also suggested that competition radio-ligand binding is the only reliable approach to quantify the α1-adrenoceptor subtype proteins [30]. More studies are needed to overcome the limitations of our study.
In conclusion, progressed diabetes increased the contractile response to phenylephrine in the abdominal aorta, but it decreased the contractile response in the mesenteric arteries in STZ-induced diabetic rats. Those results were caused by the overall change in the α1-adrenoceptor, and not from the change in the specific α1-adrenoceptor subtypes. Our results may be helpful to understand one of the complex pathophysiologies of diabetic cardiovascular autonomic neuropathy, and this is a very common and serious complication that clinical anesthesiologists are obligated to deal with.
Acknowledgements
This manuscript was supported by a grant no. 04-2006-078 from the Seoul National University Hospital Research Fund.
We thank Nam-Su Gil for experimental support.