Determination of optimal tip position of peripherally inserted central catheters using electrocardiography: a retrospective study
Article information

Abstract
Background
Accurate tip positioning of a peripherally inserted central catheter (PICC) is crucial for optimal drug delivery and avoiding complications. The objective of this study was to evaluate the amplitude ratios of intravascular electrocardiography (ivECG) and external electrocardiography (exECG) according to the tip location.
Methods
This retrospective study analyzed ivECG, exECG, and chest X-ray (CXR) of 278 patients who underwent a PICC procedure. The tip-to-carina distance (TCD) was measured using vertebral body units (VBU) on CXR. Tip locations were categorized as follows: Zone 1, malposition (TCD < 0.8 VBU); Zone 2, suboptimal (0.8 VBU ≤ TCD < 1.5 VBU); Zone 3, optimal (1.5 VBU ≤ TCD ≤ 2.4 VBU); Zone 4, deep (TCD > 2.4 VBU). The amplitude ratios between ivECG and exECG and within ivECG were compared in each zone.
Results
The ivECG/exECG amplitude ratios of P-wave (Piv/Pex) and QRS-complex (QRiv/QRex and RSiv/RSex) in Zone 3 were significantly higher than in Zones 1 and 2 (adjusted P < 0.05). The ivECG amplitude ratios of the P-wave and QRS-complex (Piv/QRiv and Piv/RSiv) were significantly lower in Zone 3 than in Zones 1 and 2 (adjusted P < 0.001). The calculated TCD using stepwise multiple regression analysis was estimated to be 1.121 + 0.078 × Piv/Pex – 0.172 × Piv/QRiv.
Conclusions
Though caution is required, amplitude ratios such as Piv/Pex and Piv/QRiv can help determine tip location during the PICC catheterization procedure.
Introduction
Central venous catheter (CVC), including peripherally inserted central catheter (PICC), has been used to deliver total parenteral nutrition, chemotherapy, antibiotics, and other medications in the critical care management of patients with long-term illnesses [1–4]. The performance of the PICC depends on tip position, and incorrect tip positioning of the PICC can cause complications [5]. The tip of a PICC or CVC should be placed in a large vein without contacting the vein or heart wall [6]. The recommended catheter tip location is between the lower 1/3 of the superior vena cava (SVC) and cavo-atrial junction (CAJ) [7–11]. If the tip is positioned above the recommended area, the risk of complication, such as catheter occlusion or infection, increases as blood flow decreases [6,9,12]. Insertion of a catheter into the right atrium (RA) can cause arrhythmias, cardiac tamponade, or tricuspid valve damage [6,9,12]. Therefore, accurate placement of the intravascular catheter tip near the CAJ is crucial to ensure optimal drug delivery and avoid potential complications, especially for long-term PICC placement [6,9,12–14].
Intravascular electrocardiography (ivECG) is a simple, easily applicable, and less invasive technique to estimate PICC tip location [5,7]. The amplitude of the ivECG P-wave increases as the tip approaches the lower portion of the SVC and the P-wave reaches its maximum amplitude around the CAJ area; the P-wave then becomes biphasic in the RA [15]. Recent studies using transesophageal echocardiography (TEE) to identify CAJ have shown that the ivECG-based technique has higher accuracy than chest X-ray (CXR) [16,17]. However, the final PICC tip location can vary from user to user because the ivECG-based technique heavily relies on the user’s interpretation of changes in the P-wave amplitude.
There are also risks of malposition due to false-positive readings of maximal P-wave amplitude [15,16]. Moreover, there are no data on the magnitude or the range of maximum P-wave amplitude changes at the optimal location. Therefore, additional evaluation of ivECG characteristics according to tip location is required for more accurate catheter tip positioning and new technology development for the PICC placement. We hypothesized that there would be significant differences in the amplitude ratios between external ECG (exECG) at the body surface versus ivECG waveforms depending on the catheter tip location shown on CXR. The objectives of this study were to 1) evaluating the amplitude ratios of ivECG and exECG by characterize ivECG patterns according to the final PICC tip location identified by CXR and 2) define an accurate PICC placement method based on ECG changes that are not confounded by user interpretation. To achieve these goals, we evaluated final exECG, ivECG, and CXR data from 278 patients who underwent a PICC procedure.
Materials and Methods
This retrospective study was conducted after approval of the protocol and waiver of the documentation of informed consent from the Institutional Review Board of Massachusetts General Hospital (Protocol #: 2020P004053). We reviewed the medical records of 859 patients who underwent a PICC placement between January 2020 and April 2020 to assess eligibility. The initial study population included adult patients (> 17 years of age) who had both exECG and ivECG records and upright CXR after PICC insertion on the same day. Patients with the following conditions were excluded: 1) unrecognizable or atypical ECG patterns lacking normal P-waves, such as atrial fibrillation, atrial flutter, or pacemaker rhythm, 2) abnormal central anatomy of airway or blood vessels, 3) destructive lung disease, and 4) history of spine disease or surgery in which the vertebral body cannot be recognized. Of the 859 records initially accessed for eligibility, 581 were excluded from analysis due to non-compliance with the inclusion criteria (atypical ECG, n = 193; abnormal anatomy of airway or spine, n = 223) or lack of exECG, ivECG, and CXR data measured during/after the PICC procedure (n = 165). Finally, the records of 278 patients were analyzed.
PICC procedure
The insertion of PICC of all patients was done using standard hospital technique. After the sterilization and draping of the patient’s arm using standard sterile technique, local anesthesia was administered with an intradermal injection of 1% lidocaine. The brachial vein on the antecubital area was confirmed by ultrasound to be patent and compressible. Then, the vein was accessed with a 21-gauge echogenic needle under sonographic guidance. After confirming the nitinol guidewire (0.46 mm x 50 cm) was easily introduced to the length that measured before insertion, the 21-gauge needle was exchanged for a peel away sheath microintroducer and the guidewire was removed. Then, the PowerPICC™ catheter (Bard Medical, Inc., USA) was trimmed to a pre-measured length and introduced through the sheath. After advancing the catheter, the PICC was positioned and confirmed via ECG technology using Sherlock 3CG® Tip Positioning System (Bard Access Systems, Inc., USA) and the exECG and ivECG was recorded. After confirming patency of the catheter, the PICC was secured with an adhesive catheter and the catheter-skin junction was covered with a sterile topical hemostatic agent, and a transparent semipermeable membrane dressing was applied. After the PICC procedure, upright CXR was taken to evaluate the tip position of PICC catheter.
Assessment of tip position using CXR and VBU
All CXRs were independently reviewed by two investigators blinded to ECG data to avoid bias. The major differences in the measurement results were resolved through the agreement of investigators after re-measurement, and the averaged data were used for the final analysis. The tip-to-carina distance (TCD) was measured using an electronic caliper on CXR and calculated in vertebral body units (VBU), defined as the distance from the inferior endplate of the upper vertebra to the inferior endplate of the lower vertebra [10,18–20]. The area from the CAJ to the lower 1/3 of the SVC was defined as the standard target location of the PICC tip, as reported in the previous studies [9–11].
Since previous studies reported that the distance from the carina to the CAJ was 2.4 VBU and the distance to the lower 1/3 of the SVC was 0.8 VBU in the CXR, we defined the area between 0.8 VBU and 2.4 VBU from the carina as a target location [10,18,19]. We divided the target location of the PICC tip into optimal and suboptimal locations.
The optimal location of the PICC tip was assumed as the area between the CAJ (2.4 VBU from carina) and 0.9 VBU (about 20 mm) above the CAJ [13]. Collectively, the position of the PICC tip was categorized according to the TCD using the VBU as follows: Zone 1, malposition as TCD < 0.8 VBU; Zone 2, suboptimal as 0.8 VBU ≤ TCD < 1.5 VBU; Zone 3, optimal as 1.5 VBU ≤ TCD ≤ 2.4 VBU; Zone 4, deep as TCD > 2.4 VBU (Fig. 1A).

Assessment of peripherally inserted central catheter (PICC) tip position and measurement of the amplitude ratios of electrocardiography (ECG) waves. (A) Assessment and categorization of PICC tip position on chest X-ray (CXR). (B) Measurement of the amplitude of external ECG and intravascular ECG at the final tip location of the PICC. The average of each amplitude ratio of the corresponding wave was calculated as variables and compared according to the tip position on CXRs. CAJ: cavoatrial junction, TCD: tip-to-carina distance, VBU: vertebral body unit, SVC: superior vena cava.
Measurement of ECG
We reviewed recorded exECG and ivECG data at the final location in electronic medical records. In three successive ECGs, the specific vector position of each wave was recognized, and the amplitude of each wave was measured using an electronic caliper described in Fig. 1B. The ratio of the amplitude of each wave was calculated as follows (Fig. 1B): Piv/Pex, QRiv/QRex, RSiv/RSex, Piv/QRiv, Piv/RSiv. Using the averages of calculated ratios as variables, we compared the average ratio according to the tip location on CXRs.
Endpoints
The primary endpoint of the study was to compare the characteristic ratios of amplitudes of corresponding ECG waves in relation to the tip location of PICC. The secondary endpoint of the study was to evaluate the correlation between the calculated amplitude ratios and tip location and to predict the PICC tip location with a mathematical model using the calculated amplitude ratios.
Statistical analysis
The sample size was calculated using ‘G*Power3 (3.1.9.7)’ free software (Heinrich-Heine University, Germany). The calculated effect size was 0.199 with r2 = 0.04 based on our retrospective pilot analysis of the correlation between ECG amplitude ratios and tip position. The total sample size was calculated to be 209 with α = 0.05 and a power of 90%.
Statistical analyses were performed using IBM® SPSS® Statistics (version 28.0, IBM Corp., USA). A normality test showed non-normal distribution in all values; thus, values were expressed as a median (Q1, Q3) or the number of patients (%) with exact P values. Continuous data (age, height, weight, body mass index [BMI], and ratios of heights of corresponding waves) were analyzed using the Kruskal–Wallis test with a post-hoc test using Mann–Whitney U test with Bonferroni’s correction. Categorical variables (gender and access side) were analyzed using Fisher’s exact test. Differences were considered statistically significant when adjusted P values were less than 0.05.
A simple linear regression analysis was performed to determine the correlation between the tip position based on VBU and each amplitude ratio of the ECG waveform. Then, multivariate backward stepwise regression was performed on variables showing more than a moderate correlation to estimate calculated TCD (cTCD) using VBU. A variation inflation factor (VIF) of less than five was considered appropriate to verify multicollinearity between variables. Bland–Altman analysis and linear regression were performed to evaluate the difference and correlation between cTCD and TCD. The area under the curve of the receiver operating characteristic (ROC) was performed to analyze the cutoff values of cTCD for the optimal location of the PICC tip (Zone 3). A second ROC analysis was performed to evaluate the ability of cTCD cutoff values to predict the optimal location (Zone 3). P < 0.05 was considered statistically significant.
Results
Table 1 shows the characteristics of patients in each zone classified according to the final tip location. There were no significant differences in the characteristics of the patient groups. When both Zones 2 and 3 were considered optimal locations, the PICC tip was correctly located in 69.7% of patients. However, the PICC tip was correctly located in only 38.8% of patients when only Zone 3 was considered optimal.

Patient Characteristics
The amplitude ratios of ECG waveforms showed a significant difference according to the PICC tip position (Table 2). The Piv/Pex in Zone 3 was significantly higher than in Zones 1 and 2 (all adjusted P < 0.001). The QRiv/QRex in Zone 3 was significantly higher than in Zones 1 and 2 (adjusted P = 0.048 and 0.019, respectively) and RSiv/RSex in Zone 3 was significantly higher than in Zone 2 (adjusted P = 0.032). The Piv/QRiv and Piv/RSiv were significantly lower in Zone 3 than in Zones 1 and 2 (adjusted P < 0.001). There were no significant differences in the amplitude ratios of ECG waveforms between Zone 1 and Zone 2 and between Zone 3 and Zone 4.

The Ratios of Amplitudes of Corresponding ECG Waves according to the Tip Position of PICC
There were moderate correlations between TCD using VBU and ECG amplitude ratios, such as Piv/Pex, Piv/QRiv, and Piv/RSiv (all P < 0.001, Fig. 2). Stepwise multiple regression analysis results showed that Piv/Pex and Piv/QRiv were associated with TCD (adjusted R2 = 0.280, Durbin–Watson = 2.220, tolerance = 0.755, VIF = 1.325, and P < 0.001). From these results, cTCD using ECG amplitude ratios was estimated to be 1.121 + 0.078 × Piv/Pex – 0.172 × Piv/QRiv.
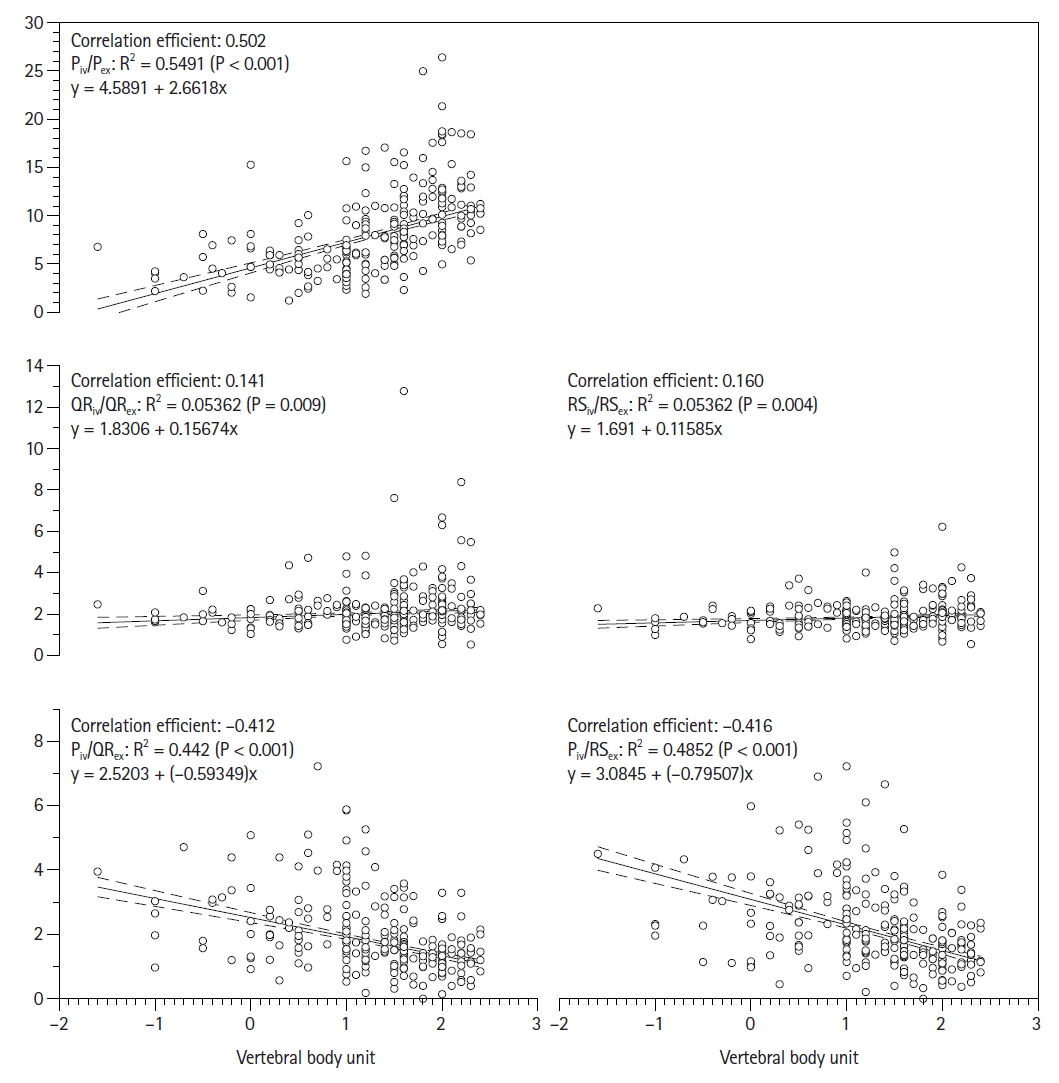
Simple linear regression analysis shows significant relations between the tip-to-carina distance (TCD) and ratios of electrocardiography (ECG) amplitude. A moderate correlation between TCD and ratios such as Piv/Pex, Piv/QRiv, and Piv/RSiv was shown. Zone 1: malposition as TCD < 0.8 vertebral body unit (VBU), Zone 2: suboptimal as 0.8 VBU ≤ TCD < 1.5 VBU, Zone 3: optimal as 1.5 VBU ≤ TCD ≤ 2.4 VBU, Zone 4: deep as TCD > 2.4 VBU, Piv/Pex: external/internal ratio of the amplitude of P-wave, QRiv/QRex: external / internal ratio of amplitude between QR points, RSiv/RSex: external/internal ratio of the amplitude between RS points, Piv/QRiv: the amplitude ratio of P-wave and QR point in the internal ECG, Piv/RSiv: the amplitude ratio of P-wave and RS point in the internal ECG.
Bland–Altman analysis of cTCD versus TCD showed an average bias of −0.001 (95% CI [–0.093, 0.091]) with a limit of agreement of -1.530 to 1.527 and positive correlation (r = 0.620, 95% CI [0.542, 0.688]) (Fig. 3A). Linear regression analysis showed a moderate correlation (correlation efficient = 0.534) between the cTCD model and TCD with R2 = 0.433 and root mean square error (RMSE) = 0.568 (P < 0.001, Fig. 3B).
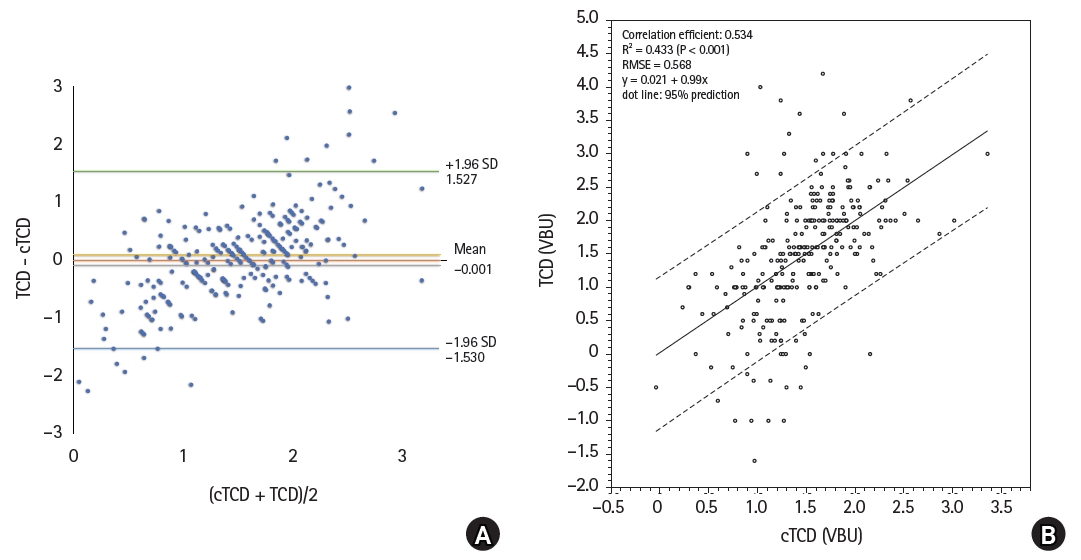
The performance of a mathematical model to predict the correct location of peripherally inserted central catheter (PICC) tip. (A) Bland and Altman plots comparing the level of agreement between tip-to-carina distance (TCD) and calculated tip-to-carina distance (cTCD) using vertebral body unit (VBD). The 95% limit of agreement and mean bias are indicated on the graph. TCD and cTCD showed a positive correlation (r = 0.620, 95% CI [0.542, 0.688]). (B) Regression line comparing the cTCD and TCD. Dot lines show 95% prediction interval. RMSE: root mean square error. P < 0.001.
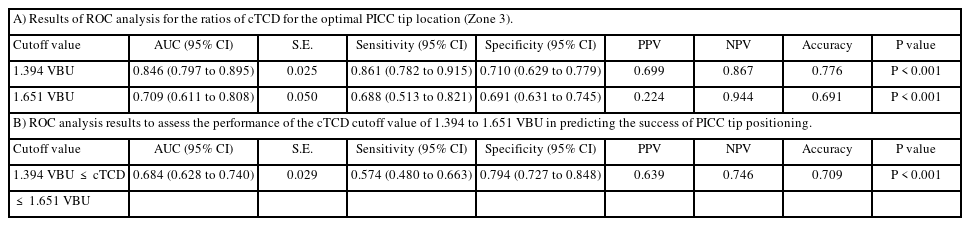
Though Zone 2 could be considered a suitable PICC tip location, we defined only Zone 3 (the area between the CAJ and 0.9 VBU above the CAJ) as the optimal location of the PICC tip. Therefore, an additional ROC analysis was performed to find the cutoff value of cTCD for the PICC tip location in Zone 3 (Table 3). The cutoff value of cTCD for the tip location of TCD ≥ 1.5 VBU (0.9 VBU above CAJ) was ≥ 1.394 VBU (a positive predictive value of 69.9% with a sensitivity of 86.1% and a specificity of 71.0%). The cutoff value of cTCD for the tip location of TCD ≤ 2.4 VBU (the area between CAJ and the upper region of RA) was ≤ 1.651 VBU (a negative predictive value of 94.4% with a sensitivity of 68.8% and a specificity of 69.1%). The cutoff value of 1.394 ≤ cTCD ≤ 1.651 VBU showed an accuracy of 70.9% (positive predictive value of 63.9% and negative predictive value of 74.6%) to predict PICC tip location between the CAJ and 0.9 VBU (about 20 mm) above the CAJ (Zone 3).
Results of ROC Analysis
Discussion
In this study, we found significant differences in the amplitudes ratios of ivECG / exECG P-wave (Piv/Pex) and ivECG P-wave/QRS-complex (Piv/QRiv and Piv/RSiv) at different locations and significant correlations between amplitude ratios of ECG and TCD using VBU. In addition, only 38.8% of patients showed final PICC tip placement in the optimal location with current ivECG-based technique. The equation for estimating cTCD (1.121 + 0.078 × Piv/Pex – 0.172 × Piv/QRiv) showed considerable accuracy in predicting the proper position of the PICC tip. These results show that placement of PICC tips based on ratios such as Piv/Pex and Piv/QRiv will be more effective and accurate than placing PICC tips using only the P-wave changes in the ivECG waveform.
The optimal final location of the PICC tip should be closer to the CAJ (Zone 3) for long-term placement [10,13] because of the potential for complications such as occlusion or infection [6,9,12–14] or cephalad dislocation during an upright position with upper limb movement [21,22]. Therefore, although clinically acceptable, placing the catheter tip in the suboptimal location is not recommended. The rate of malposition of the PICC tip after blind insertion is high (37–76%) and estimating insertion length based on anatomical landmarks often gives unreliable results [5,13,18,23]. Current technology still has many limitations; fluoroscopy guidance or CXR is not applicable for implementation at the patient’s bedside or in assisted living facilities [5,6,9,24], and carries the risk of false-positive or false-negative diagnosis [25–27]. Current ivECG-based techniques are reported to be a reliable method with high accuracy of close to 100% [5,7,28,29], but still show false-negative rates of 0.7–7% of P-wave changes during PICC insertion [30,31]. The amplitude of the P-wave may also be maximal before reaching the CAJ when the ivECG electrode contacts the SVC in the part of the pericardial reflection [15,32]. The absence of a typical biphasic P-wave can occur if the tip contacts the RA wall [16,30]. According to the study by Wang et al. [11], the maximum P-wave amplitude can be obtained in the middle or upper 1/3 of SVC (9.7% of patients) or in the RA (4.3% of patients). A retrospective study showed that only 56.1% of cases had catheter tips in the appropriate locations defined in Zones 2 and 3 of our study [33]. In the current study, the accuracy of PICC tip location was only 69.7% under the same conditions. Moreover, the accuracy was only 38.8% when the optimal location was strictly defined only near the CAJ area (between CAJ and 2 cm above CAJ). Therefore, the current single unipolar ivECG-based catheter guidance technique using the morphological change of the P-wave does not seem to guarantee accuracy in actual clinical practice [7,15,34], and the development of an objective method to increase the accuracy is necessary.
In the current study, we found a significant increase in Piv/Pex as the PICC tip approached the CAJ, with the highest correlation among all ratios. In addition, the ivECG/exECG amplitude ratios of the QRS complex (QRiv/QRex and RSiv/RSex) showed an increase in Zone 3 with statistical differences. A previous study reported that the most significant difference in the P-wave amplitude normalized to the R-wave was found at the CAJ (0.87 ± 0.14) [35]. The difference in P-wave/QRS complex ratio was also used for the PICC placement, and the ratio of 50–80% was regarded as CAJ [11]. However, the method using only the P-wave/QRS-complex ratio was not accurate enough because the final tip position was mainly located at the lower 1/3 of SVC rather than the CAJ [11]. Similarly, our study demonstrated that Piv/Pex showed a better correlation than Piv/QRiv (correlation efficient 0.502 vs. -0.412).
Therefore, we thought that utilizing both amplitude ratios of ivECG and ivECG/exECG could be more effective in reducing false-positive confirmation of PICC tip placement. Estimating cTCD using both Piv/Pex and Piv/QRiv to predict the position of the PICC tip via multivariate regression analysis showed a moderate correlation with TCD (correlation efficient 0.534, R2 = 0.433, RMSE = 0.568). In addition, it was confirmed that the cTCD model was suitable to predict the TCD with the cutoff values between 1.394 and 1.651 VBU to identify the tip location in Zone 3. With this technique, the accuracy of predicting the PICC tip location in Zone 3 was 70.9%, which was about 1.8 times higher than the accuracy of the current method (38.8%). Therefore, the results of this study can serve as useful values for new guidance for placing PICC tips in the desired location.
There are several limitations in the current study. First, additional evaluation of the characteristics of ECG ratios to discriminate between Zone 3 and Zone 4 is needed in case of the absence of a biphasic P-wave. Overall, 32 of 278 (11.5%) of PICC tips were located in Zone 4 without showing biphasic P-waves, likely as a result of the PICC tip making contact with the RA wall [16,30]. Secondly, there is a possibility that biases and confounding factors exist due to the study’s retrospective nature. Although we used VBU that represents a relatively constant distance in the thoracic anatomy regardless of age, gender, or BMI [10,18–20], CXR is not as accurate as TEE or computerized tomography in identifying PICC tips [10,24,25,30]. Thirdly, we could not evaluate temporal changes in relation to the PICC tip location. Also, we did not conduct external validation. Finally, the data in the current study was obtained on a device from a specific manufacturer and does not apply to other devices. Therefore, external validation of the results, additional technical methods for accurate identification of distances, and well-controlled prospective trials are required to obtain accurate amplitude ratio according to the CAJ position without bias and confounding factors. Moreover, efforts to apply these methods to other single unipolar ivECG-based PICC tip positioning systems are required for future clinical applications.
In summary, we demonstrated that using multiple amplitude ratios of exECG and ivECG waves, such as Piv/Pex and Piv/QRiv, during the PICC catheterization procedure, as well as a mathematical model to determine cTCD, can help predict the correct PICC tip location. We suggest that adding the ratios mentioned above to the currently used single unipolar ECG-based system will significantly reduce the malposition rate of PICC tip placement. This method, however, still requires caution and further evaluations are needed.
Notes
Funding
None.
Conflicts of Interest
Ki Tae Jung has been an editor for the Korean Journal of Anesthesiology since 2020. However, he was not involved in any process of review for this article, including peer reviewer selection, evaluation, or decision-making. There were no other potential conflicts of interest relevant to this article.
Data Availability
The analyzed datasets used in this study are available from the corresponding author upon reasonable request.
Author Contributions
Ki Tae Jung (Data curation; Formal analysis; Investigation; Visualization; Writing – original draft; Writing – review & editing)
Linda Kelly (Data curation; Resources)
Alexandra Kuznetsov (Validation; Writing – review & editing)
A. Sassan Sabouri (Validation; Writing – review & editing)
Kichang Lee (Conceptualization; Data curation; Formal analysis; Methodology; Project administration; Supervision; Validation; Writing – original draft; Writing – review & editing)