Role of carotid corrected flow time and peak velocity variation in predicting fluid responsiveness: a systematic review and meta-analysis
Article information

Abstract
Background
Dynamic parameters used for predicting fluid responsiveness require special equipment and are minimally invasive. Therefore, recent interest in the use of carotid artery ultrasound parameters, such as carotid corrected flow time (FTc) and peak velocity variation (ΔVpeak) has grown. Therefore, we performed this systematic review and meta-analysis to assess the ability of carotid FTc and/or ΔVpeak to accurately predict fluid responsiveness.
Methods
We searched the PubMed and Embase databases for articles evaluating the diagnostic accuracy of carotid FTc or ΔVpeak for predicting fluid responsiveness. Two independent authors performed the search and selected studies published until May 2022. The studies were assessed for the inclusion and exclusion criteria using Rayyan (Rayyan Systems Inc., 2022).
Results
Ten studies (n=438) that fulfilled the inclusion criteria were selected. Studies were divided into those assessing carotid FTc and those assessing carotid ΔVpeak. Five studies (six datasets) assessed FTc. The pooled sensitivity and specificity of carotid FTc were 0.76 and 0.88, respectively. The summary receiver operating characteristic (SROC) curve for carotid FTc had an area under the curve (AUC) of 0.9092, with a Q value of 0.8412. Seven studies calculated carotid ΔVpeak. The pooled sensitivity and specificity for ΔVpeak were 0.83 and 0.81, respectively. The SROC curve had an AUC of 0.8941 and a Q value of 0.8250.
Conclusions
Our meta-analysis showed that both carotid FTc and ΔVpeak are useful for predicting fluid responsiveness in anesthesia and critical care settings with good specificity and sensitivity.
Introduction
Adequate preload is necessary for decent cardiac output and is an important determinant of patient outcomes in anesthesia and critical care. A patient is considered fluid responsive when cardiac output increases in response to increasing preload [1,2]. Historically, we relied on static markers, such as central venous and pulmonary artery pressures, to determine fluid responsiveness. However, the reliability of these markers has recently been questioned [3]. Over time, dynamic markers for predicting fluid responsiveness such as pulse pressure variation (PPV) and stroke volume variation (SVV) replaced static parameters in clinical practice [4].
However, the dynamic determinants of fluid responsiveness have their own limitations. For instance, most of these techniques require special equipment or expensive devices and are minimally invasive. PPV and SVV require arterial cannulation and/or central line insertion, which are associated with complications [5]. Others, such as transesophageal echocardiography (TEE), require the patient to be completely sedated and paralysed. In addition, a patient’s movements, such as turning, may displace the TEE probe. Therefore, recent interest in the use of carotid artery ultrasound parameters has grown. Of these, the carotid corrected flow time (FTc) and peak velocity variation (ΔVpeak) have been the most studied. FTc is the duration of left ventricular ejection measured on a systolic pulse waveform from the start of the upstroke to the incisural notch [6]. It is corrected to the heart rate using Wodey’s or Bazett’s formula or other similar methods [7]. The ΔVpeak is the change in the height of the carotid pulse upstroke with respiratory variations.
The use of carotid ultrasound-derived FTc and ΔVpeak has several advantages. First, they do not require any specific equipment and can be assessed at the bedside. Furthermore, this technique is completely noninvasive. M-mode ultrasonography is performed at the neck level, which remains accessible during most thoracic and abdominal surgeries. Furthermore, these parameters can be used even at a tidal volume (TV) as low as 6 ml/kg or in patients who are spontaneously breathing, unlike other dynamic markers (such as PPV), which require mechanical ventilation with a TV of at least 8 ml/kg to accurately predict fluid responsiveness. However, the carotid-artery-derived parameters may not be reliable markers for the presence of significant carotid artery stenosis (> 50%). Additionally, in head and neck surgery, the carotid artery site may be difficult to access.
Various studies have assessed the potential use of these parameters for determining fluid responsiveness. These studies included diverse patient populations, small sample sizes, and different cutoff values to identify fluid responders. Therefore, we performed this systematic review and meta-analysis to assess the ability of ultrasound-derived carotid FTc and/or ΔVpeak to accurately predict fluid responsiveness in different clinical scenarios of adult patients in anesthesia or critical care settings.
Materials and Methods
For our systematic review, we followed the Preferred Reporting Items for Systematic Reviews and Meta-Analyses (PRISMA) 2020 statement [8]. We registered our protocol using PROSPERO (No. CRD42022334313) on June 3, 2022. Since no human subjects were directly involved in our study, no institutional ethical approval was obtained.
Search strategy
For our systematic review, we searched the PubMed and Embase databases for clinical trials published up to May 2022. The search terms were “carotid” and “corrected” and “flow” and “time” for the first search and “carotid” and “peak” and “velocity” and “variation” for the second second search (Supplementary Material 1).
Study selection
The inclusion criteria were as follows: 1) human adult patients (i.e., age > 18 years) in anesthesia and critical care settings; 2) ultrasound assessment of carotid FTc and/or ΔVpeak in relation to fluid responsiveness; 3) ultrasound performed by a person experienced with the technique; 4) clearly defined criteria to determine fluid responders that involved a cardiac output or stroke-volume-based method to assess fluid responsiveness; and 5) inclusion of the cutoff value, sensitivity, specificity, and area under the receiver operating characteristic (ROC) curve (AUC) for the investigated intervention. The exclusion criteria were as follows: 1) studies not involving human participants (i.e., animal and in vitro studies), 2) studies involving children, 3) language other than English, 4) full text not available online (conference abstracts etc.), 5) studies not related to fluid responsiveness, 6) studies not using FTc and/or ΔVpeak to assess fluid responsiveness, and 7) no clearly defined criteria to determine fluid responders.
Two independent authors (DS and MM) reviewed all the abstracts for potential inclusion. The full texts of the remaining studies were reviewed in a blinded manner for potential inclusion in the meta-analysis. Any disagreements were resolved by discussion.
Data extraction and quality assessment
Data were extracted using Rayyan software (https://www.rayyan.ai, Rayyan Systems Inc., 2022). After removing duplicates and unrelated studies, the full texts of the remaining studies were obtained. After selecting studies based on the inclusion and exclusion criteria, the data were presented in a Microsoft Excel sheet (Microsoft Corp., USA). From each study, we extracted data regarding the author, title, year of publication, number of participants, population type (mechanical/spontaneous ventilation, medical condition), carotid ultrasound parameters analyzed, reference methods to check fluid responsiveness, criteria for fluid responsiveness, number of fluid responders, and results. For the quality assessment, we used the Quality Assessment of Diagnostic Accuracy Studies version 2 (QUADAS-2, University of Bristol, UK) [9]. Two independent authors (DS and MM) analyzed all the data, and any disagreements were resolved by discussion.
Statistical analysis
We divided the studies into two separate groups based on whether FTc or ΔVpeak were analyzed. Meta-DiSc® (version 1.4, XI Cochrane Colloquium, Spain) was used for all statistical analyses. The Spearman correlation coefficient of sensitivity and 1-specificity log was used to estimate the heterogeneity due to the threshold effect. Heterogeneity due to non-threshold effects was estimated using the I2 test. I2 values ≤ 25% were considered low heterogeneity, 25–50% was moderate, and >50% was high heterogeneity. In the presence of heterogeneity, a random-effects model was used for further analyses. For each study, we calculated the true positive (TP), false positive (FP), false negative (FN), and true negative (TN) for the index parameter. The pooled sensitivity, specificity, NLR, and PLR were determined using 95% CIs. For each parameter, a summary receiver operating characteristic (SROC) curve was generated and the Q value was calculated. Publication bias was evaluated through Egger’s and Begg’s tests using MedCalc statistical software (version 20.110, MedCalc Software Ltd., Belgium)
Results
Study identification, screening, and inclusion
For the first search (i.e., “carotid” and “corrected” and “flow” and “time”), 221 articles on PubMed and 193 on Embase were retrieved. For the “carotid” and “peak” and “velocity” and “variation” search, we retrieved 139 articles on PubMed and 131 articles on Embase. Thus, we identified 684 articles in total (Fig. 1). Of these 684 articles, 181 duplicate records were excluded. The remaining 503 abstracts were screened based on the inclusion and exclusion criteria. In total, 470 studies were excluded. Of the remaining 33 studies, 12 were excluded because the full text was not available online, four articles were not in the English language, five studies had no predefined criteria for fluid responsiveness, and in two studies, the assessments were performed by novice investigators. Therefore, a total of ten studies were included in our analysis.
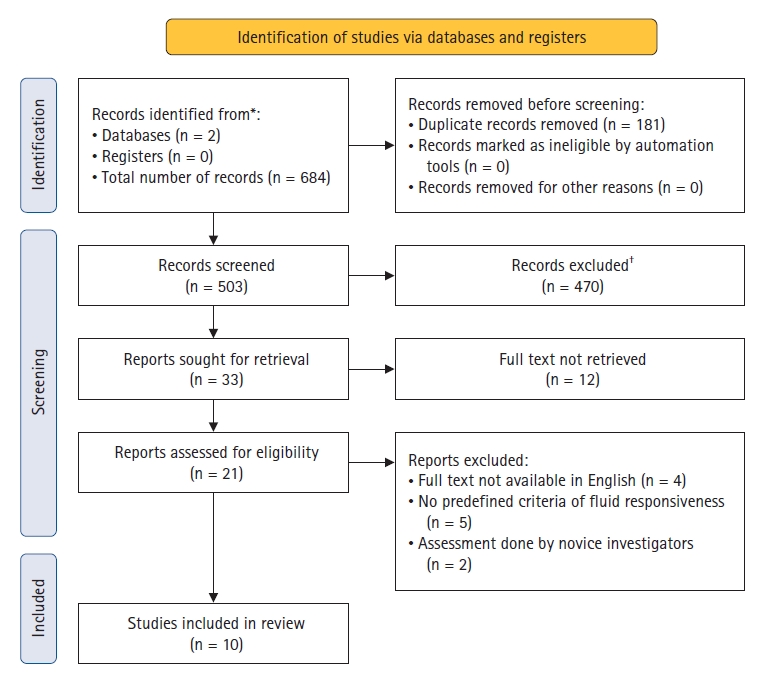
PRISMA flow diagram. *PubMed = 221 + 139, Embase = 193 + 131; resulting in a total of 684 articles identified. †No automation tools were used.
These ten studies enrolled 438 patients and involved 478 assessments of fluid responsiveness. Of these, 264 (55.23%) were fluid responsive (Table 1). To simplify the analyses, we grouped the studies based on the parameters analyzed (i.e., FTc or ΔVpeak). A total of five studies (and six data sets) investigated FTc. One study by Jung et al. [10] used two different formulae to determine FTc. Therefore, it was evaluated as two different studies, and both datasets (at a physiological tidal volume of 6 ml/kg) were included (Supplementary Table 1). We obtained seven studies that evaluated ΔVpeak (Supplementary Table 2). From the sensitivity and specificity data, we calculated the TP, FP, FN, and TN for each study (Supplementary Tables 1 and 2).
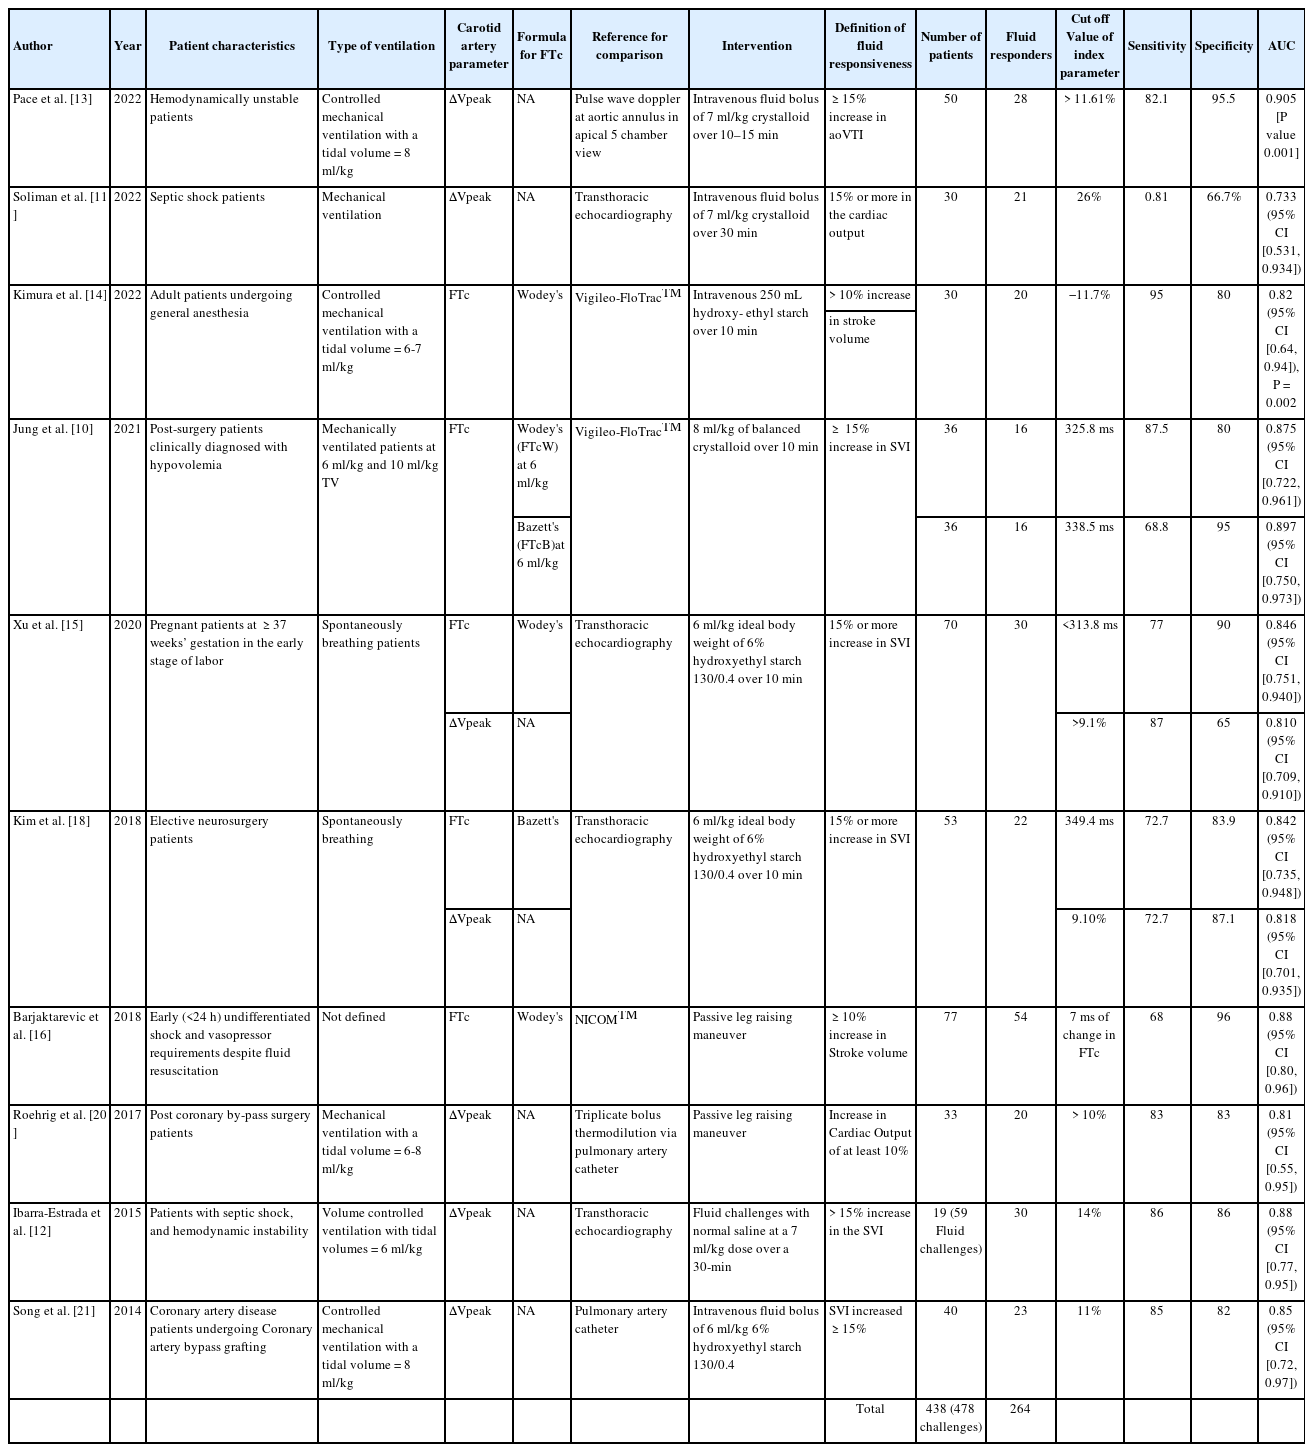
Studies Analysing Carotid Ultrasound Based Corrected Flow Time and/or Peak Velocity Variation
Quality assessment
For the quality assessment of the included studies, we used the QUADAS-2 (Table 2). Most studies did not describe whether the patients were selected consecutively or randomly. In the studies by Soliman et al. [11] and Ibarra-Estrada et al. [12], the criteria for septic shock were not clearly defined. Pace et al. [13] did not explain if both observers performed all ultrasounds, and the number of examinations for which the third expert was called. Kimura et al. [14] and Xu et al. [15] did not assess interobserver reproducibility. Kimura et al. [14] did not exclude patients with significant carotid artery stenoses. In the studies by Kimura et al. [14] and Jung et al. [10], cardiac output monitoring was performed using the Vigileo-FloTrac™ system, which may be affected by changes in systemic vascular resistance. Barjaktarevic et al. [16] used the NICOMtm study to assess fluid responsiveness and did not define the type of shock or exclude patients with carotid artery stenosis.

Quality Assessment of Included Studies Using the QUADAS-2
Meta-analysis of FTc
Five studies (six datasets) assessed FTc. The Spearman correlation coefficient was 0.928 (P = 0.008). Therefore, there was a positive correlation between sensitivity and (1-specificity) and heterogeneity due to a threshold effect. The pooled sensitivity of FTc was 0.76 (95% CI [0.68, 0.82]) with an I2 value of 44.6% (Fig. 2A). This was suggestive of low-to-moderate heterogeneity due to the non-threshold effect. The pooled specificity was 0.88 (95% CI [0.82, 0.93]) with an I2 value of 2.8% (Fig. 2B), suggesting low heterogeneity. Therefore, we used a random-effects model for our analysis. The pooled PLR, NLR, and diagnostic odds ratio (DOR) were 5.77 (95% CI [3.68, 9.05]), 0.3 (95% CI [0.23, 0.39]), and 28.13 (95% CI [13.80, 57.33]), respectively. The I2 value for the PLR, NLR, and DOR was 0.0%. The SROC curve for FTc had an AUC of 0.9092 with a Q value of 0.8412 (Fig. 3A). To assess for publication bias, we calculated the standard error using 95% CIs and used these along with the AUC values for assessment. No evidence of publication bias was found using Egger’s test (P = 0.4) or Begg’s test (P = 0.3).

(A) Pooled sensitivity and (B) specificity of carotid corrected flow time for diagnosing fluid responsiveness.
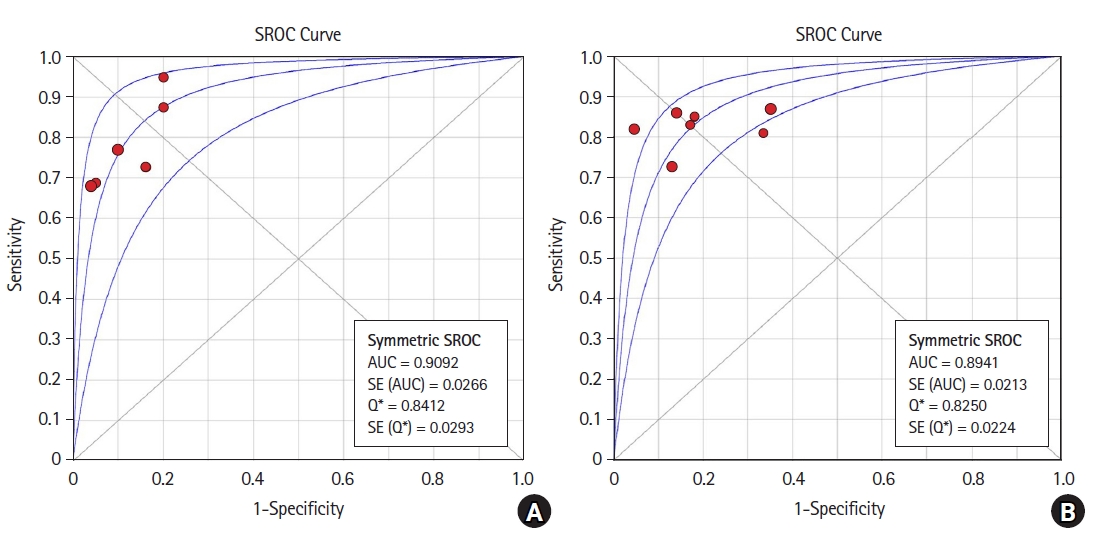
(A) SROC curve for carotid corrected flow time and (B) peak velocity variation. SROC: summary receiver operating characteristic, AUC: area under the curve, SE(AUC): standard error in AUC, Q*: Q* index, SE(Q*): standard error in Q* index.
Meta-analysis of ΔVpeak
Seven studies that assessed ΔVpeak were included in the analysis. The Spearman correlation coefficient was 0.464 (P = 0.294), suggesting an inability to reject the null hypothesis and no threshold effect. The pooled sensitivity for ΔVpeak was 0.83 (95% CI [0.76, 0.88]), with an I2 value of 0% (Fig. 4A). The pooled specificity was 0.81 (95% CI [0.74, 0.86]), with an I2 value of 50.5%, suggesting moderate heterogeneity (Fig. 4B). Therefore, in this case, the random-effects model was also applied. The pooled PLR, NLR, and DOR was 4.13 (95% CI [2.59, 6.59]), 0.22 (95% CI [0.16, 0.31]), and 20.85 (95% CI [11.44, 38.00]), respectively. The I2 values for the PLR, NLR, and DOR were 42.7%, 0%, and 0%, respectively. The SROC curve had an AUC of 0.8941 with a Q value of 0.8250 (Fig. 3B). The study by Pace et al. [13] only provided a P value (0.001) with the AUC and no standard error. We calculated the standard error for the P value from a study conducted by Altman and Bland [17] The standard error was very low (0.0221), and the analysis showed publication bias according to Egger’s test (P = 0.0061) but not Begg’s test (P = 0.1). However, since the actual standard error was not known, after excluding that study, both Egger’s (P = 0.1) and Begg’s test (P = 0.35) showed no publication bias.
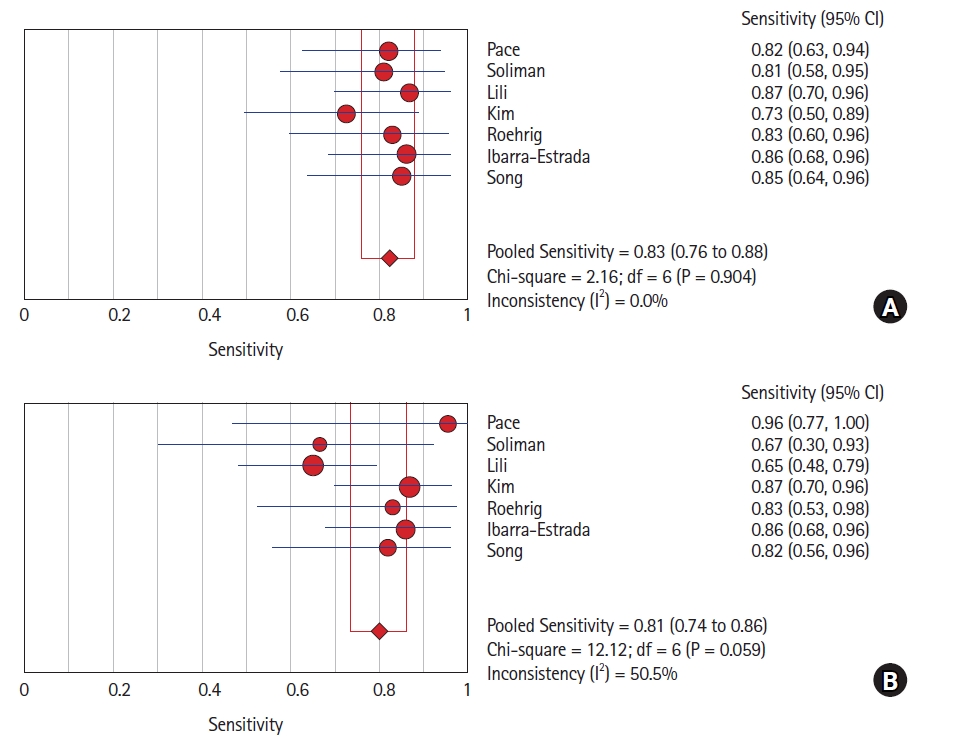
(A) Pooled sensitivity and (B) specificity of carotid peak velocity variation for diagnosing fluid responsiveness.
Subgroup analysis
Studies examining FTc provided either an absolute value [10,15,18], a percentage change [14], or an absolute change [16] in FTc as a cutoff. Therefore, we performed a subgroup analysis of the studies that analyzed the absolute value of FTc. The Spearman correlation coefficient was 0.8 (P = 0.200). The pooled sensitivity was 0.76 (95% CI [0.66, 0.85]) with an I2 value of 0.0%. The pooled specificity was 0.87 (95% CI [0.80, 0.930]) with an I2 value of 0.0%. The pooled PLR, NLR and DOR were 5.57 (95% CI [3.676, 9.17]), 0.28 (95% CI [0.19, 0.42]), and 23.60 (95% CI [10.72, 51.9]), respectively. The I2 value for the PLR, NLR, and DOR was 0.0%. The SROC curve for the FTc subgroup had an AUC of 0.8902 with a Q value of 0.8209.
Discussion
This study found that carotid ultrasound-derived FTc and ΔVpeak could be useful for predicting fluid responsiveness in anesthesia and critical care patients. Although mild-to-moderate heterogeneity was noted based on I2 values, both parameters were shown to predict fluid responsiveness with good sensitivity and specificity. We also performed a subgroup analysis using the absolute cutoff value of FTc, which showed a sensitivity of 0.76 (95% CI [0.66, 0.85]) and specificity of 0.87 (95% CI [0.80, 0.930]) for predicting fluid responsiveness, with an I2 value of 0.0%.
Assessing fluid responsiveness is essential for critically ill patients and patients undergoing major surgical procedures. Although we have gradually shifted from static parameters (such as central venous pressure and pulmonary capillary wedge pressure) to dynamic parameters (such as PPV, SVV, and inferior vena cava collapsibility), there are certain limitations to the use of these techniques in clinical practice [19]. Therefore, a growing interest in the use of carotid ultrasound parameters to predict fluid responsiveness has occurred recently [7,10–16,18,20–22]. These studies have assessed FTc [7,10,14–16,18,22], ΔVpeak [11–13,15,18,20,21], or carotid blood flow [22] to predict fluid responsiveness. Because most of the available studies used FTc or ΔVpeak, we decided to use these two parameters for our systematic review and meta-analysis.
A study by Abbasi et al. [23] showed that novice sonologists are unable to determine fluid responsiveness based on changes in FTc or carotid blood flow. Another study [24] showed that ΔVpeak could not accurately predict fluid responsiveness when evaluated by novice sonologists. These studies suggest that some level of expertise may be required to correctly evaluate carotid ultrasound-derived FTc and ΔVpeak to determine fluid responsiveness. Therefore, in our meta-analysis, we only included studies that had experts perform and interpret the carotid ultrasounds.
Previous studies have used either Bazett’s [10,18] or Wodey’s [10,14–16] formulas to assess FTc. Bazett’s formula is calculated by dividing the flow time with the square root of the cycle time while Wodey’s formula gives FTc as measured flow time + [1.25 (heart rate – 60)]. Wodey’s formula has been shown to be superior to Bazett’s formula, as the latter is still affected by heart rate in certain situations [25]. However, most studies calculating FTc using either formula found it to be a reliable indicator of fluid responsiveness. Jung et al. [10] used both the formulas (FTcB: Bazett’s, FTcW: Wodey’s) for calculating FTc in mechanically ventilated patients and found that both predicted fluid responsiveness with high sensitivity (FTcB: 68.8, 95% CI [41.3, 89.0] and FTcW: 87.5, 95% CI [61.7, 98.4]) and specificity (FTcB: 95.0, 95% CI [75.1, 99.9] and FTcW: 80.0, 95% CI [56.3, 94.3]) at a tidal volume of 6 ml/kg. We included all studies that calculated FTc using either Bazett’s or Wodey’s formula to predict fluid responsiveness. We found a pooled sensitivity of 0.758 and a pooled specificity of 0.883, with moderate-to-low heterogeneity. The SROC curve showed an AUC of 0.9092 with a Q value of 0.8412, which suggests that, as per the available evidence, FTc could be a good predictor of fluid responsiveness in both mechanically ventilated [10,14] and spontaneously breathing [15,18] patients.
Furthermore, studies have used either an absolute value of FTc or a change in FTc after a fluid challenge, as mentioned above. Therefore, we performed a subgroup analysis including only studies that used the absolute value of FTc as the cutoff. In the subgroup analysis, we obtained a pooled sensitivity of 0.76, a specificity of 0.87, and an I2 value of 0.0%, suggesting decent sensitivity and specificity, with no heterogeneity. A subgroup analysis with either absolute or percentage change in FTc could not be performed, as only one study was conducted in each case.
We also analyzed studies that used ΔVpeak to assess fluid responsiveness [11–13,15,18,20,21]. All studies included in our analysis used a percentage change in ΔVpeak, although the cutoff values varied among the studies. The cutoff for ΔVpeak was 9.1% in the studies by Xu et al. [15] and Kim et al. [18], while it was as high as 26% in the study by Soliman et al. [11]. We calculated a pooled sensitivity of 0.828 and pooled specificity of 0.805 (95% CI [0.736, 0.864]), with no-to-moderate heterogeneity. Our findings suggest that ΔVpeak is a good predictor of fluid responsiveness. Similar findings were reported in a meta-analysis conducted by Yao et al. [26], which included four studies assessing carotid ΔVpeak [12,21,27,28]. The authors found that ΔVpeak from both the carotid and brachial arteries could be used to predict fluid responsiveness; however, carotid ΔVpeak had a higher diagnostic value.
A systematic review by Beier et al. [29] examined the role of carotid ultrasound parameters for predicting fluid responsiveness in adults. The authors could not perform a meta-analysis because of the considerable heterogeneity among the studies. They found that FTc and ΔVpeak were the most frequently assessed parameters, the latter of which was the most well-defined parameter reported at that time. They further concluded that carotid ultrasound-derived parameters could be useful for predicting fluid responsiveness in conjunction with clinical data. We also found that both FTc and ΔVpeak could be used to predict fluid responsiveness.
Our meta-analysis had some limitations. First, we only included studies in English. This resulted in the exclusion of studies [27,28] that could have provided valuable data for our analysis. However, this was done to prevent the misinterpretation of the findings presented in those studies. Second, only two carotid artery parameters (FTc and ΔVpeak) were analyzed. Our analysis also did not consider other parameters such as carotid blood flow and carotid artery diameter since the available studies assessing these parameters for predicting fluid responsiveness are limited. Therefore, we restricted our analysis to FTc and ΔVpeak only. Lastly, our findings showed mild-to-moderate heterogeneity for both FTc and ΔVpeak due to the lack of a uniform cutoff value among the studies and the use of different criteria for assessing the same variable. Therefore, further studies are necessary to improve the diagnostic value of carotid ultrasound parameters for predicting fluid responsiveness.
In conclusion, our meta-analysis showed that both FTc and ΔVpeak could be useful methods for predicting fluid responsiveness in anesthesia and critical care settings with good specificity and sensitivity. However, a uniform cutoff value was not used for either parameter. Therefore, further studies are required to establish more consistent cutoff values and to improve the diagnostic accuracy of both parameters.
Notes
Funding
None.
Conflicts of Interest
No potential conflict of interest relevant to this article was reported.
Data Availability
All data used in this systemic review is obtained from full text of the studies mentioned in References. Appropriate citations have been provided.
Author Contributions
Deepak Singla (Conceptualization; Data curation; Investigation; Supervision; Writing – original draft; Writing – review & editing)
Bhavna Gupta (Formal analysis; Investigation; Software)
Pragya Varshney (Data curation; Formal analysis; Investigation)
Mishu Mangla (Conceptualization; Data curation; Investigation; Methodology)
Beeraling Ningappa Walikar (Data curation; Resources)
Tiajem Jamir (Data curation; Investigation)
Supplementary Materials
Search strategy.
Studies analyzing FTc.
Studies analyzing ΔVpeak.