Whole body ultrasound in the operating room and intensive care unit
Article information

Abstract
Whole body ultrasound can be used to improve the speed and accuracy of evaluation of an increasing number of organ systems in the critically ill. Cardiac and abdominal ultrasound can be used to identify the mechanisms and etiology of hemodynamic instability. In hypoxemia or hypercarbia, lung ultrasound can rapidly identify the etiology of the condition with an accuracy that is equivalent to that of computed tomography. For encephalopathy, ocular ultrasound and transcranial Doppler can identify elevated intracranial pressure and midline shift. Renal and bladder ultrasound can identify the mechanisms and etiology of renal failure. Ultrasound can also improve the accuracy and safety of percutaneous procedures and should be currently used routinely for central vein catheterization and percutaneous tracheostomy.
Introduction
Point-of-care ultrasound [1] has been considered the new fifth pillar of physical examination, building on inspection, palpation, percussion and auscultation [2]. The term ‘stethoscope,’ coined by Laënnec in 1819, originated from the Greek words ‘stetho’ (chest) and ‘scope’ (look into). Ultrasound devices are now as portable as the stethoscope and have the ability to look beyond the chest, therefore, the term whole body ultrasound (WHOBUS) would more appropriately describe the potential of bedside ultrasound [3]. WHOBUS does not imply that the whole body should be examined every time, but rather that ultrasound can be used to complement clinical evaluation where indicated. WHOBUS not only improves the diagnostic accuracy of standard bedside clinical assessment, but also helps to establish the pathophysiological link between different organ systems simultaneously altered in diseases such as the cardio-intestinal syndrome (Table 1).

Examples of Organ Interaction and Clinical Syndromes Diagnosed with WHOBUS
A vast majority of disease states can be rapidly identified by simple pattern recognition of two-dimensional ultrasound pictures, for example, the dilated heart with reduced ventricular movement in dilated cardiomyopathy; however, Doppler (colour and spectral) may be required to clarify hemodynamic pathophysiology and separate left ventricular systolic and diastolic dysfunctions. In this narrative review, we will present an up to date overview of how to integrate WHOBUS into clinical care, including specific clinical conditions that are common in the operating room (OR) and intensive care unit (ICU). Detailed description of all the ultrasound modalities useful in the OR and ICU is beyond the scope of this article, but can be found elsewhere [4].
WHOBUS in the Hemodynamically Unstable Patient
An outline of the evaluation of hemodynamic instability using WHOBUS involves a two-step approach [5,6]. The first step is to identify the mechanism of hemodynamic instability (hypovolemic, hemorrhagic or distributive, cardiogenic or resistive) and the second step is to identify the etiology (Fig. 1).
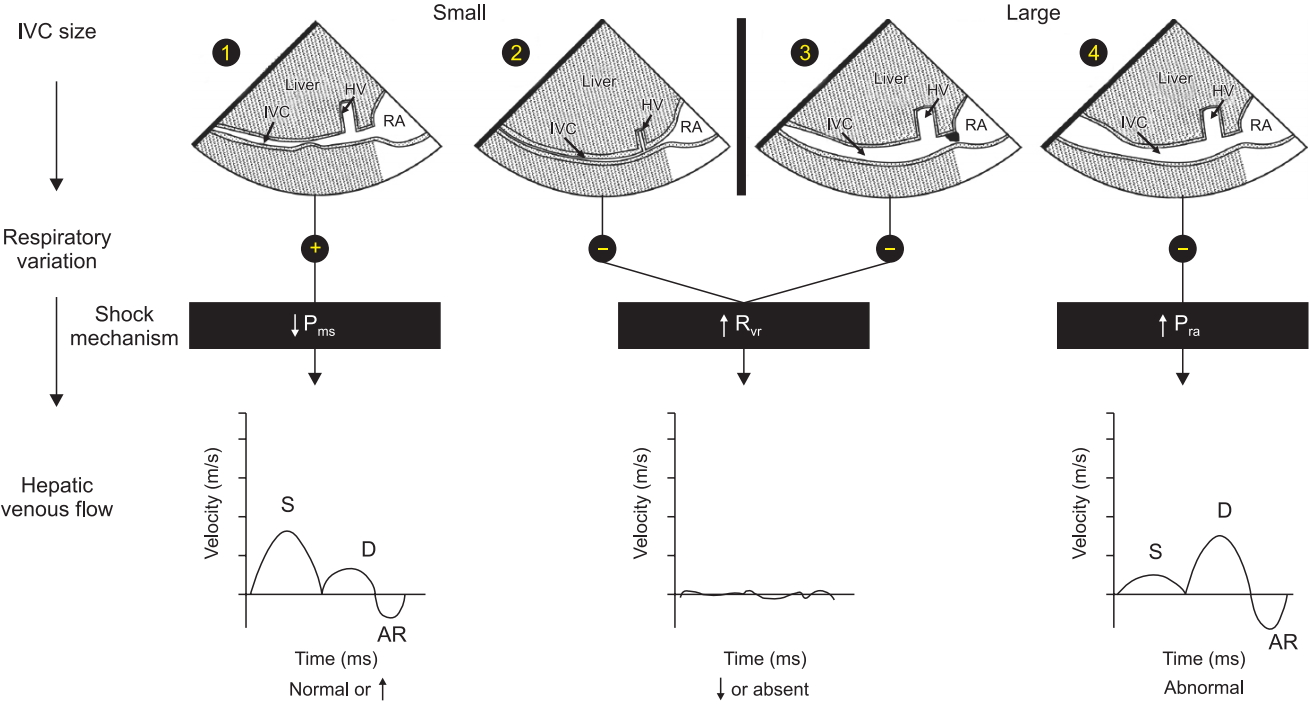
Shock Mechanism. Algorithm to determine shock mechanism by using IVC size, respiratory variation during spontaneous ventilation and HVF is shown. In patients with reduced mean systemic venous pressure (Pms), the IVC is small with respiratory variation (1) and the HVF is typically normal or increased due to the reduced dimension of the hepatic vein (HV). In patients with increased resistance to venous return (Rvr), the IVC can be collapsed from an abdominal compartment syndrome (2) or distended from a mechanical obstruction at the junction of the IVC and the right atrium (3). In both situations, the HVF signal is significantly reduced, monophasic or absent. In a situation where the right atrial pressure (Pra) is increased, the IVC is dilated without respiratory variation (4) and the HVF will be abnormal with reduced systolic to diastolic velocity ratio. AR: atrial reversal velocity of the HVF, D: diastolic HVF velocity, HV: hepatic vein, HVF: hepatic venous flow, IVC: inferior vena cava, Pms: mean systemic venous pressure, RA: right atrium, S: systolic HVF velocity. Reproduced from Denault et al. [4], with the permission of Taylor and Francis Group, LLC, a division of Informa plc.
The initial step, which is the identification of the mechanism of shock, can be determined by adapting the concept of venous return, which was popularized by Guyton et al. [7]. This is done by ultrasound assessment of blood flow in the inferior vena cava (IVC) and the hepatic vein (HV). Hypovolemic, hemorrhagic, and distributive shock are typically associated with reduced systemic venous pressure, identified as a small and hyper-collapsible IVC and a normal HV flow pattern (Fig. 1, pattern 1). Estimation of cardiac output with ultrasound is usually enough to discriminate between hypovolemic shock (low cardiac output) and distributive shock (increased cardiac output), unless there is concomitant cardiac dysfunction, which can occur in septic shock [8]. Cardiogenic shock or right ventricular dysfunction is associated with an increase in right atrial pressure, associated with a dilated and hypo-collapsible IVC and an abnormal HV flow pattern (Fig. 1, pattern 4). Resistance to venous return can result from either an obstruction above the diaphragm such as in cardiac tamponade or tension pneumothorax, or from below the diaphragm such as in abdominal compartment syndrome. In both situations, the HV flow profile will either be absent or monophasic (Fig. 1, patterns 2 and 3) [9], however, the IVC will be distended and hypo-collapsible in cardiac tamponade and tension pneumothorax but small and hyper-collapsible in abdominal compartment syndrome (Fig. 2A–2C). Rarely, IVC stenosis can occur after certain procedures, for example, upon IVC canula removal after cardiac surgery, Fontan procedure, heart and liver transplantation (Fig. 2D), and will be associated with a distended IVC with reduced ventricular cavities [10].
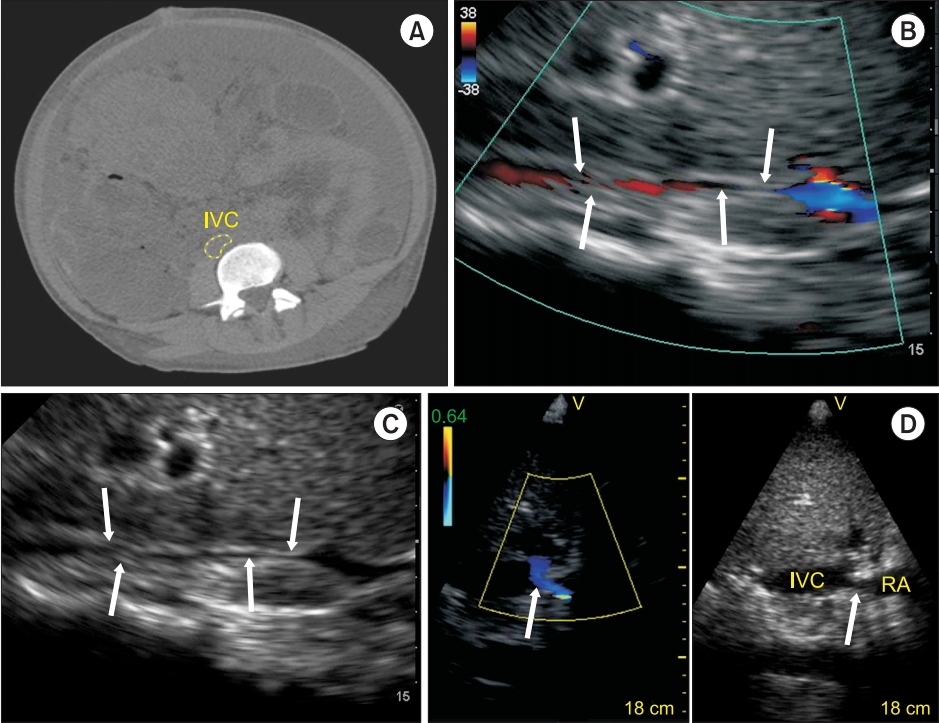
IVC flow. (A) Computed tomography of a patient with abdominal compartment syndrome. (B) Zoomed subxiphoid longitudinal view of the IVC using bedside ultrasound shows a reduced diameter of the IVC (arrows). (C) In some patients, the compressed IVC can only be identified using color Doppler (arrows). (D) Longitudinal subxiphoid view by ultrasound of a mechanical stenosis of the IVC (arrow) in a hemodynamically unstable patient after liver transplantation. Note the color flow acceleration (arrow) at the level of the IVC stenosis. IVC: inferior vena cava, RA: right atrium. Reproduced with the permission of Vegas et al. [5].
The second step, which is the identification of the etiology of disease, highlights the major advantage of WHOBUS over pressure and flow-based monitors. Usually, blood is readily detected in the pleural and abdominal cavities in the case of hypovolemia but retroperitoneal bleeding is more difficult to detect. In distributive shock, many infective causes are detectable with WHOBUS, including (but not limited to) pneumonia, empyema, cholecystitis, pyelonephritis, bacterial peritonitis, endocarditis, and abscess cavities in major body cavities or musculoskeletal system. Ultrasound may also be used to guide tissue sampling for microscopy and culture. Echocardiography is the gold standard for diagnosis of the etiology of cardiogenic shock. In resistive shock, cardiac tamponade is identified by pericardial effusion and cardiac chamber compression, and tension pneumothorax is identified by ipsilateral lack of lung sliding and localization of a lung point (as discussed in the next section). Finally, abdominal examination can reveal free air, fluid, or blood in abdominal compartment syndrome.
An important caveat is that two or more co-existing causes of hemodynamic instability may be present [11] and other associated conditions or additional complications in other organs can be present as well. An example is shown in Fig. 3, where a patient with subarachnoid hemorrhage has left ventricular outflow tract obstruction from the use of milrinone. In septic shock, both left and right-sided myocardial depression can be present [12–15], which if missed, may result in excessive fluid overload [16]. As discussed below, pulmonary edema because of cardiogenic shock is readily detected with WHOBUS [17]. In patients with right heart dysfunction after cardiac surgery, portal pulsatility (Fig. 4) predicts complications such as bleeding, re-intervention, and renal failure after cardiac surgery [18–20].

LVOT obstruction. A 31-yearold man with subarachnoid hemorrhage receiving intravenous milrinone develops LVOT obstruction. (A) Note the significant pressure gradient (252 mmHg) and velocities (7.9 m/s) across the LVOT obtained using an apical five-chamber view. (B) The associated transcranial Doppler velocities of the right middle cerebral artery (MCA) were 2.57 m/s. (C, D) Following a bolus of 500 ml of crystalloid, (C) the LVOT gradient drops to 72 mmHg and (D) the right MCA velocity decreases to 1.72 m/s. LVOT: left ventricular outflow tract. Reproduced from Denault et al. [4], with the permission of Taylor and Francis Group, LLC, a division of Informa plc.

Portal venous flow. (A) Portal venous flow (PoVF) assessment from a posterior axillary line coronal view. (B) Using the same view, the inferior vena cava (IVC), portal vein (PV), and hepatic vein (HV) can be seen. Note the increased echogenicity of the PV wall. (C) Normal portal vein pulsedwave Doppler has a monophasic signal indicating that blood is directed toward the transducer. Note the background pulsatile higher velocity of the hepatic artery, which is in the same direction. (D) Abnormal pulsatile portal flow with a pulsatility fraction of more than 50%. Reproduced with the permission of Beaubien-Souligny [17].
WHOBUS in the Hypoxemic Patient
In critically ill patients, lung ultrasound can be used to correctly diagnose the cause of hypoxemia, such as pulmonary edema, pneumothoraxes, acute respiratory distress syndrome, pulmonary embolus and pneumonia [21,22], reducing the need for chest radiography or computed tomography [23,24]. An algorithmic approach (Fig. 5) to the interpretation of key sonographic artifacts (Fig. 6) generated from air and fluid interactions with the pleura and parenchyma can help in evaluating patients with thoracic disease [22]. For example, the Blue Protocol [21] begins with an anterior chest examination in search of lung sliding. The presence of such a phenomenon allows the user to exclude the diagnosis of pneumothorax at that location. The detection of other artifacts, such as a lung pulse, generated from the pleura or from cardiogenic activity can rule out a pneumothorax (Fig. 6A), whereas only the identification of a “lung point” artifact can help to confirm its presence (Fig. 6B). This artifact represents the juxtaposition of a normal sliding lung with a zone of absent pleural movement [25]. The presence of numerous (three or greater) vertical projections from the pleural line called B lines represents alveolar interstitial syndrome (Fig. 6C). Should they be dispersed in all rib spaces in a dependent fashion, this can point the physician towards the diagnosis of pulmonary edema, whereas a more heterogeneous distribution with focal affected areas may represent interstitial disease or pneumonia. While vascular abnormalities in the chest are not always seen, the presence of sub-pleural infarcts and consolidations may indicate pulmonary embolus, especially if ultrasound reveals venous thrombosis [26]. Dependent lung regions are the common site for ultrasound identification of effusions (Fig. 6D), empyema (Fig. 6E), atelectasis and consolidation (Fig. 6F), which are easily identified, quantified and may be used to guide therapy [27–30]. For a lung ultrasound that appears normal, the clinician may suspect alternate diagnoses to explain hypoxemia, such as an intracardiac shunt or obstructive pulmonary disease. Bedside transthoracic ultrasound may yield poor results and may be rendered difficult by some clinical situations, for example, if the patient is obese or has lung pathology that does not affect pleural boundaries. In such situations where surface ultrasound is difficult, transesophagheal echocardiography [31,32] may be used for lung ultrasound instead. In spite of these limitations, the diagnostic value of WHOBUS remains high and is likely to experience increased growth. In only 5–10% of cases, hypoxemia is associated with a completely normal lung ultrasound; therefore it is not surprising that in some centers the popularity of lung ultrasound has grown tremendously, even beyond that of transthoracic echocardiography [33].


Lung ultrasound artifacts. (A) The lung pulse artifact is created by small fast rhythmic movements of the pleural interface synchronized with the heartbeat. This can be seen with 2D images but is better recognized using M-mode. In color M-mode, these lung pulse artifacts are more easily identified. (B) Lung ultrasound examination of the upper left lung shows a lung point using M-mode scanning. The lung point is the transition point between a normal pleural interface (sea-shore sign) and the separation of the visceral and parietal pleura by air from a pneumothorax. (C) Multiple B lines (arrows) in a patient with congestive heart failure. (D) Lung ultrasound 2D image using a phased array probe shows a complex pleural effusion containing particles and swirling artifacts giving an appearance of echotexture (yellow dotted line) suggestive of an exudate. (E) Lung ultrasound 2D image using a convex probe shows a heterogeneous pleural effusion with multiple septations suggesting an empyema. (F) A lung ultrasound 2D image obtained with a convex probe of the left lower lobe shows lung parenchyma that has the same appearance as normal hepatic parenchyma hence the name hepatisation of lung parenchyma seen in pneumonia. Reproduced from Denault et al. [4], with the permission of Taylor and Francis Group, LLC, a division of Informa plc.
WHOBUS and the Encephalopathic Patient
The approach to the patient with an altered mental status requires consideration of a broad expanse of differential diagnoses and rapid detection of neurologic- and life-threatening intracranial pathology. Point-of-care neurologic ultrasound as a diagnostic tool is an invaluable adjunct to the history, physical exam, and laboratory investigations in the encephalopathic patient, especially in those too unstable to be transported for diagnostic imaging. Several bedside sonographic techniques permit the critical care physician to detect the presence of raised intracranial pressure (ICP) [4,34,35], conditions such as midline shift of the cerebrum [4,36,37], or cerebral vasospasm [4,38]. Ability to detect these pathologies in a timely manner enables rapid institution of appropriate therapy.
Measurement of ICP can be obtained at the bedside by examining the optic nerve. The optic nerve lies in a sheath which is in continuity with the dura mater and intracranial contents; edema of this sheath is an indicator of raised ICP. Assessment of the optic nerve sheath diameter (ONSD) is a simple examination that can be performed using a high frequency linear probe placed on the orbit (Fig. 7). A recent systematic review and meta-analysis determined that ONSD > 4.80–6.30 mm predicts the presence of increased ICP with a pooled diagnostic odds ratio of 67.5, positive likelihood ratio of 5.35, negative likelihood ratio of 0.088 and area under the receiver operating curve of 0.938 [35]. Serial ONSD measurements can be used to follow the progression of ICP in the operating room or the intensive care unit. Vitreous hemorrhage or Terson syndrome can also be easily diagnosed using ocular ultrasound and is associated with poor prognosis in subarachnoid hemorrhage [39].

(A) Photo of high frequency ultrasound (US) probes which can be (B) gently positioned over the eyelid of a closed eye. (C) Aspect of the eye and optic nerve sheath for which the measurement is taken at 3 mm from the retina (D) Cross sectional view of the optic nerve. (E) Dilated optic nerve sheath and (F) papilledema (arrow). Adapted from Denault et al. [4] and [108].
Transcranial sonography (TCS) using 2D and Doppler is an advanced bedside technique that can provide the critical care physician important diagnostic information in the encephalopathic patient. Midline shift (MLS) of the cerebrum can occur in a variety of pathological states such as after stroke or traumatic brain injury, and in itself is an indicator of intracranial hypertension. Quantification of MLS by TCS correlates well with MLS as measured by gold-standard computed tomography imaging [36,37]. To obtain this data, a trans-temporal view of the third ventricle (Fig. 8) is acquired and the distance to the middle of the third ventricle from the ipsilateral and contralateral edges of the cranium are measured; a discrepancy between the measured distances indicates presence of a MLS [4]. An MLS > 4 mm after 32 h correlates closely with poor outcomes after stroke [36].

Temporal windows. (A, B) Using 2D imaging, anatomic reference points shown with these cut portions of the skull are the petrous bone, foramen lacerum, sphenoid wing and the opposite cranial wall (arrows). (C) Color Doppler (Nyquist 27 cm/s) showing blood flow in the petrous bone (arrows). The sphenoid wing is shown (triangles). (D) The display depth is initially adjusted in order to see the contralateral skull at the mesencephalic level. ACA: anterior cerebral artery, MCA: middle cerebral artery, PCA: posterior cerebral artery. Reproduced from Denault et al. [4], with the permission of Taylor and Francis Group, LLC, a division of Informa plc.
Transcranial colour-coded duplex sonography (TCCS) is a bedside method that can be used to detect intracranial hypertension [34], cerebral artery vasospasm after subarachnoid hemorrhage [4], or ultimately to diagnose brain death [40]. Using the same trans-temporal window described above, a sonographic image of the circle of Willis is obtained; using the principles of Doppler, one can analyse the arterial blood flow pattern in the middle cerebral artery to detect various pathologies. The pulsatility index (PI) is a measure of resistance to blood flow; it is calculated as the difference between the peak systolic flow velocity and end-diastolic flow velocity, divided by the mean velocity. An elevated PI correlates with increased ICP [41]; PI > 2.3 (normal PI value < 1.2) correlates with an ICP > 22 mmHg [34]. Progressive malignant intracranial hypertension leads to diminishing diastolic and then systolic blood flow patterns, and ultimately results in cerebral circulatory arrest (Fig. 9) and brain death [40]. Analysis of mean flow velocity can also be used to detect cerebral vasospasm after aneurysmal sub-arachnoid hemorrhage, a condition that can lead to delayed cerebral ischemia and poorer outcomes [4,38]; early detection enables early treatment, which may prevent a secondary ischemic insult.
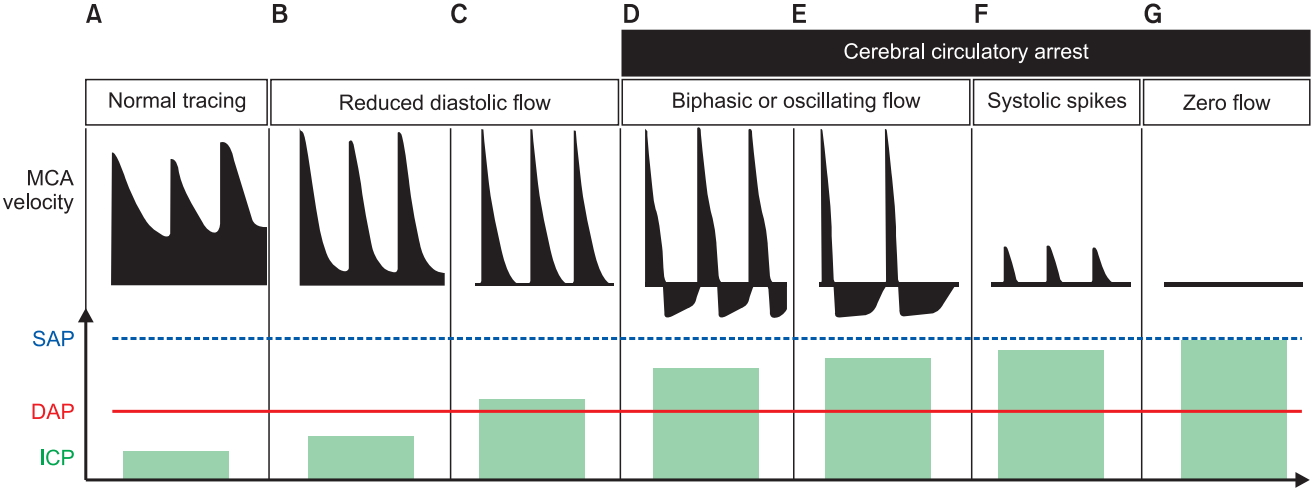
Intracranial hypertension and intracranial circulatory arrest. Transcranial Doppler changes in middle cerebral artery (MCA) mean flow velocity with progressive increase in intracranial pressure (ICP) are shown compared with (A) normal MCA flow trace and normal ICP. (B, C) The initial stage has a typical pattern of systolic peaks with progressive reduction in diastolic velocities. (D–G) The patterns that correspond to intracranial circulatory arrest are shown: biphasic oscillating flow, systolic spike flow and zero flow. DAP: diastolic arterial pressure, SAP: systolic arterial pressure. Adapted from Hassler et al. and Conti et al. [109,110] and reproduced from Denault et al. [4], with the permission of Taylor and Francis Group, LLC, a division of Informa plc.
WHOBUS in the Oligo-anuric Patient
Acute kidney injury (AKI) is frequently observed in the critical ill patient and is defined by the Kidney Diseases: Improving Global Outcomes Organization (KDIGO) based on an increase in serum creatinine and/or an acute reduction of urine output [42]. While markers such as creatinine may help to calculate the reduction in the glomerular filtration rate, an underlying and potentially reversible cause of AKI cannot be identified. Focused ultrasound offers a simple and rapid tool, increasing diagnostic certainty at the bedside with the potential to detect reversible causes of AKI and may therefore help to obviate the progression of AKI in certain patients [19]. The etiology of AKI can be assigned to three different mechanisms, consisting of prerenal, renal and postrenal causes of AKI. Fig. 10 presents a proposed approach for ultrasound assessment in the oligo-anuric patient. In our experience, we will rule out post-renal AKI first and then exclude renal venous congestion because both conditions can be rapidly diagnosed and treated.
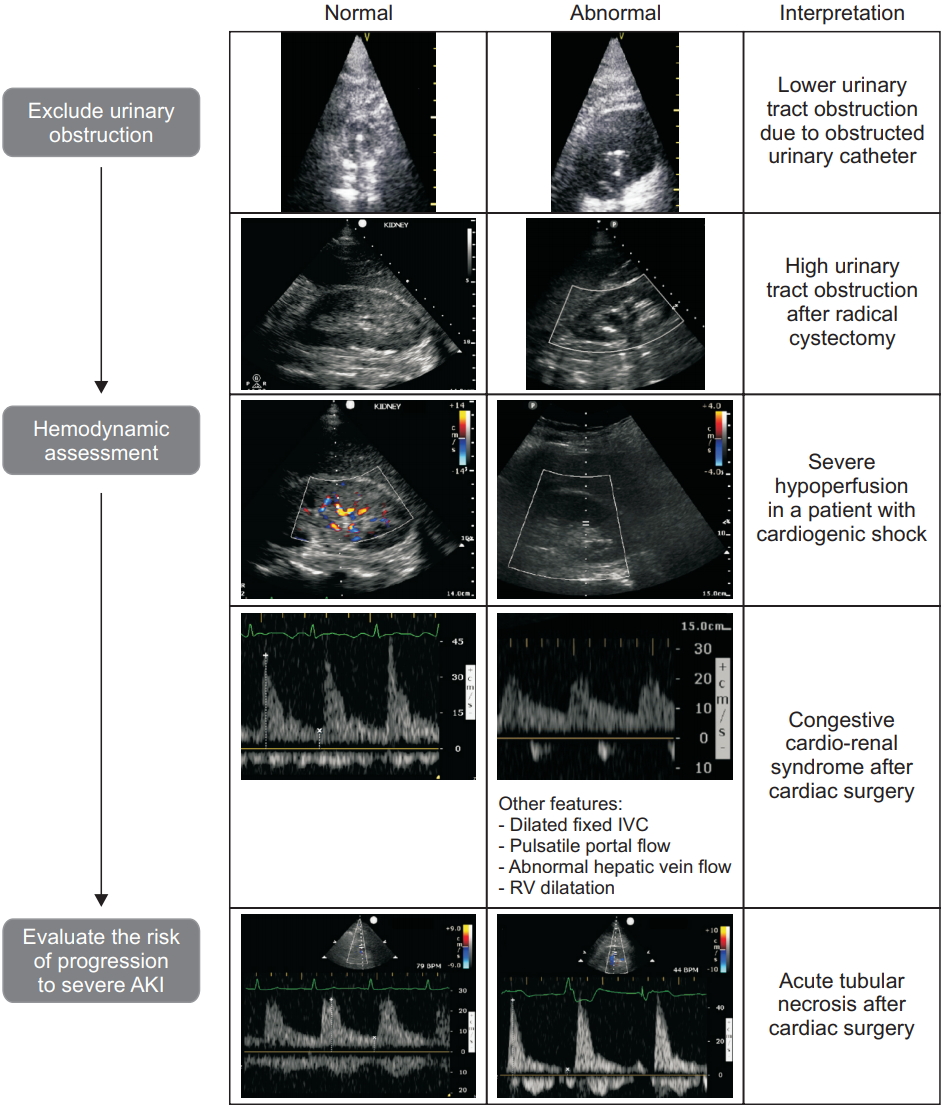
In postrenal AKI, focused ultrasound assessment using transthoracic echocardiogram or transesophageal echocardiogram [43] of the kidney and the bladder can contribute to the early management of AKI by identifying a lower (urinary catheter dysfunction, acute urinary retention, prostatic hyperplasia, ureteral stricture neurogenic bladder) or higher (urolithiasis, abdominal surgery [44] retroperitoneal hematoma [45]) urinary tract obstruction. When unilateral or bilateral urinary obstruction occurs leading to hydronephrosis, the collecting structures such as the renal pelvis, the major calyx, and the minor calyx will become visible (Fig. 11).
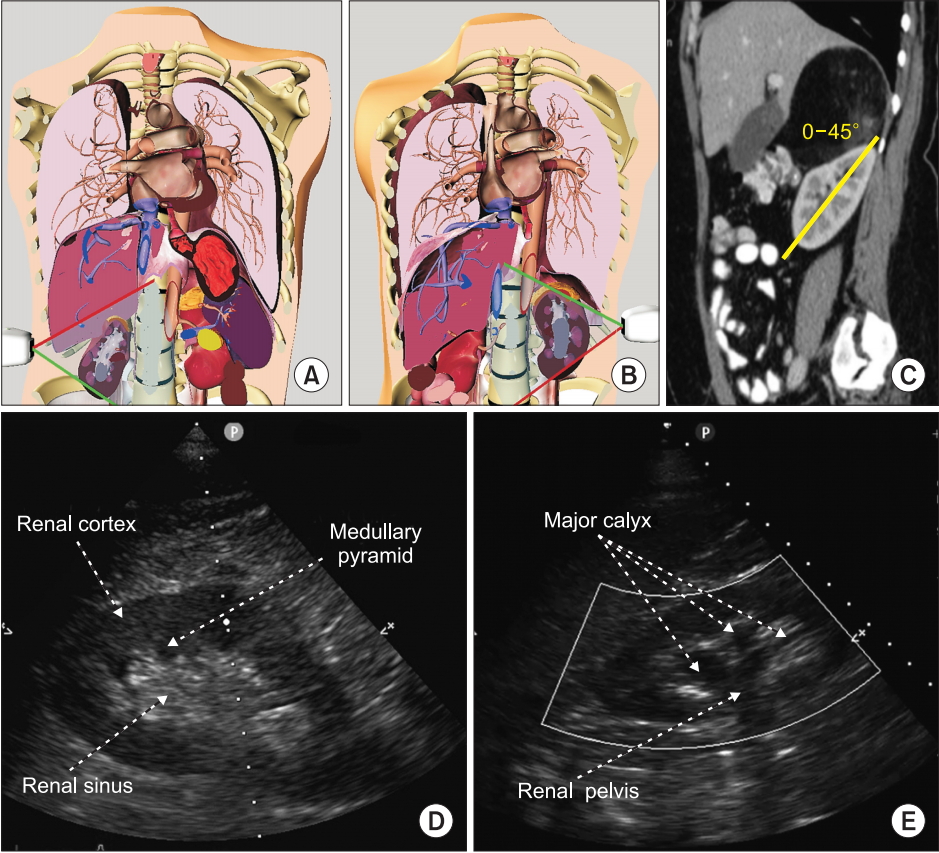
Renal ultrasound. (A, B) Probe position at the mid to posterior axillary line, illustrated using the Vimedix simulator (CAE Healthcare, Canada). (C) In order to obtain a longitudinal view of the kidney, a probe rotation of 0 to 45° is necessary as illustrated on this sagittal view of a tomography scan. (D) Normal appearance of the kidney on 2D ultrasound including the renal sinus within which the collecting system is not visible. (E) Moderate hydronephrosis which includes dilatation of the renal pelvis and major calyx. Adapted from Beaubien-Souligny et al. [52].
In prerenal AKI, the identification of hemodynamic mechanisms associated with renal hypoperfusion and assessment of fluid responsiveness by ultrasound examination is crucial. Hypovolemia can be absolute (as described above) or relative, for example an acute reduction in preload in the setting of chronically raised venous pressure from cardiac failure. Hence, a complete cardiac ultrasound is required to discriminate these two conditions before attempting treatment with intravascular volume replacement, as this could worsen renal venous congestion [46,47]. The use of color Doppler after appropriate scale adjustment offers a simple method to identify kidney hypoperfusion or venous congestion [48–50]. Pulsed-wave Doppler ultrasound can be used to assess arterial and venous blood flow velocities of the interlobar vessels (Fig. 12). The pattern of the interlobar vein Doppler signal is affected by central venous compliance [51,52]. A normal venous pattern is continuous (Fig. 12C). A biphasic venous signal (Fig. 12D) or a single diastolic venous flow is suggestive of venous hypertension. Those patients (Fig. 12E) will experience a rapid decrease in glomerular filtration rate [18,19,52] and a higher risk of death [51] (Fig. 12). The renal resistive index (RI) can be derived from the arterial Doppler signal of the interlobar artery (maximal velocity - the minimal velocity divided by the maximal velocity) with the arterial pulse pressure being the main determinant of the RI and therefore being dependent on hemodynamic changes and vascular compliance [53] (Fig. 12). Inappropriate vasoconstriction within the renal parenchyma due to acute tubular necrosis, thrombotic microangiopathy and acute rejection in renal transplants [54–56] can lead to an important increase in intrarenal resistance (RI > 0.70) [57]. Based on previous studies demonstrating an association between a high RI and progressive AKI in critical ill patients, measuring the RI in the oliguric patient may help to identify those at high risk for AKI [58]. Finally, the use of color Doppler after appropriate scale adjustment offers a rapid and instantaneous simple method to identify kidney global hypoperfusion [48–50].

Renal blood flow. (A) Color Doppler of the right kidney (B) Normal Doppler tracing of the interlobar vessels with a renal resistive index of 0.65. (C) Normal monophasic and continuous intra-renal venous. A brief interruption during atrial contraction as shown in panel D is also considered normal. (D) Discontinuous intra-renal venous flow with flow both in systole or S and diastole or D. (E) Discontinuous intrarenal venous flow with flow detectable only in diastole or D. Adapted from Beaubien-Souligny et al. [52].
WHOBUS Guided Percutaneous Procedures
Vascular access
Real-time use of ultrasound for internal jugular vein cannulation is probably the point-of-care application of ultrasound with the most evidence of the practicality of WHOBUS for guiding vascular access. In 2002, the National Institute for Clinical Excellence (NICE) published recommendations of a systematic review comparing procedural and patient outcomes of real-time, two-dimensional ultrasound guidance of internal jugular vein catheterization compared to the traditional landmark technique [59]. The authors recommended ultrasound as the preferred method for insertion in adults and children in elective situations, which had a profound influence on practice in the United Kingdom. A subsequent observational study published by Wigmore et al. [60] demonstrated a reduction in central venous catheter–related complications in 438 patients presenting for surgery since the implementation of the NICE recommendations at a single hospital. The complication rate was reduced from 10.5% prior to ultrasound to 4.6% after ultrasound, with an absolute risk reduction of 5.9% (95% CI; 0.5%–11.3%) [60]. In 2011, a combined task force of the American Society of Echocardiography and the Society of Cardiovascular Anesthesiologists published recommendations on ultrasound-guided vascular cannulation based on a systematic literature review [61]. They recommended the use of ultrasound to guide internal jugular vascular access “whenever possible” (based on 30 randomized controlled studies), and for the femoral vein in pediatric patients. The authors also recommended that ultrasound be used to for arterial cannulation as it increases the ‘first pass’ success rate. A meta-analysis Cochrane review which was published in 2015 [62], identified 35 randomized controlled trials comparing procedural and patient outcomes from ultrasound and landmark techniques for catheterization of the internal jugular vein. The authors also recommended ultrasound over the landmark technique. There was insufficient data to compare inexperienced and experienced operators for all adverse outcomes, low risk versus high risk patients or two-dimensional ultrasound versus Doppler. All authors also recommended the importance of training in the use of ultrasound-guided central venous catheter insertion.
Regional anesthesia
The use of ultrasound to guide regional blockade is probably as widely accepted as the use of ultrasound for vascular cannulation. The available literature demonstrates that compared to the standard technique (landmark and nerve stimulator), ultrasound-guided blockade of both upper and lower limb peripheral nerves results in shorter procedural time, fewer needle passes, less procedural pain, faster onset, increased success (less failures), and a longer block duration. Improved analgesia was reported with ultrasound-guided regional anesthesia in two recent meta-analyses [63,64]. There was insufficient evidence to draw conclusions on improved outcome, but a reduction in surrogate morbidity, including vascular puncture and diaphragmatic paralysis, was demonstrated in the meta-analysis by Neal et al. [64]. Importantly, there are no reports showing that ultrasound is inferior to blind techniques, and significant morbidity from peripheral nerve blockade is very rare. Adoption of ultrasound has without a doubt, led to a rapid expansion in regional blockade in acute and chronic pain medicine and to new techniques including a variety of vertebral (neuraxial), paravertebral, and truncal (e.g., transverses abdominus plane) blocks.
Airway cannulation
In anesthesiology practice, percutaneous subglottic ventilation is usually reserved for the “cannot intubate cannot oxygenate” scenario where rapid re-oxygenation is required. Ultrasound has been demonstrated to improve localization of the cricothyroid membrane and avoidance of blood vessels, which is likely to be very useful in this setting, which is earning a role in difficult airway algorithms [65]. Anesthesiologists practicing in the ICU may also find ultrasound useful when assisting in wire and cannula placement for percutaneous tracheostomy insertion, where ultrasound may also reduce potentially significant complications.
Drainage of pericardial and pleural effusions
There is sufficient evidence that ultrasound-guided drainage of pleural and pericardial effusion is more successful and less likely to result in a complication than the traditional method of using a landmark technique [66–68]. One of the important lessons learned include performing the ultrasound at the same time as the procedure, thus preventing the insertion of a drain into the wrong place due to changes in patient posture and movement of the fluid and/or diaphragm. The reason for delayed uptake despite agreement in the role of ultrasound, is likely to be a gap in education and training, and in the case of the anesthesiologist, a lack of exposure to patients requiring the procedure. However, this is a desirable skill for the anesthesiologist providing anesthesia for major trauma and cardiothoracic surgery.
Other Uses of WHOBUS
Other areas of potential clinical use for ultrasound are expanding and there are likely to be many more by the time this paper is published. Some examples of WHOBUS-guided procedures include additional regional anesthesia procedures, use of cardiac and lung ultrasound to help guide interventional cardiac catheterisation procedures, and for the confirmation of central venous catheter tip placement instead of using a chest radiograph. An example of WHOBUS-guided diagnosis includes screening for deep venous thrombosis [69,70].
In summary, WHOBUS applications are numerous in the OR and ICU. Promising outcomes studies in anesthesia have been reported [71–77]; in other critical care environments [71–73,75,76,78–92] and in several randomised trials, the advantage of WHOBUS has been demonstrated [77,90,92–98]. Training programs in WHOBUS are discussed from early medical school into numerous specialties and fellowship programs [99–107]. WHOBUS is becoming a part of the training and the practice of anesthesiologists and critical care physicians. Table 2 summarizes our approach to WHOBUS in the hemodynamically unstable, hypoxemic, encephalopathic and oligo-anuric patient.

WHOBUS Summary: Mechanism, Etiology, Consequence and Associated Findings
Notes
Funding Statement
The Richard I. Kaufman Endowment Fund in Anesthesia and Critical Care and the Montreal Heart Institute Foundation.
Conflicts of Interest
Dr. Denault is on Speakers Bureau and KOL for CAE Healthcare and Masimo, and has received research grant from Masimo and Edwards.
Author Contributions
André Denault (Conceptualization; Data curation; Formal analysis; Funding acquisition; Investigation; Methodology; Project administration; Supervision; Validation; Writing–original draft; Writing–review & editing)
David Canty (Conceptualization; Data curation; Formal analysis; Investigation; Methodology; Validation; Writing–original draft; Writing–review & editing)
Milène Azzam (Conceptualization; Data curation; Formal analysis; Investigation; Methodology; Validation; Writing–original draft; Writing–review & editing)
Alexander Amir (Conceptualization; Data curation; Formal analysis; Investigation; Methodology; Validation; Writing–original draft; Writing–review & editing)
Caroline E. Gebhard (Conceptualization; Data curation; Formal analysis; Investigation; Methodology; Validation; Writing–original draft; Writing–review & editing)