Effect of two- or four-hour oral intake restriction on intraoperative intravascular volume optimization using stroke volume variation analysis: a single-blinded randomized controlled trial
Article information

Fluid infusion is recommended during the early stage of intraoperative management to prevent induction-induced hypotension (references are shown in the UMIN-CTR supplement at www.umin.ac.jp/ctr/index.htm) [1,2]. Oral rehydration and infusion management during the perioperative period have been recommended for earlier recovery; however, preoperative management with more than 4 h of oral fluid restriction is not realistic [3]. The relationship between the duration of fluid intake restriction and the volume deficit is not fully understood. The stroke volume variation (SVV) is an index of circulating blood volume [4]. We hypothesized that the preoperative volume deficit associated with a 2 h oral intake restriction is smaller than that associated with a 4 h restriction. We tested this hypothesis using the SVV following anesthetic induction.
After approval of the study protocol and registration (UMIN000005696), we conducted an assessor-blinded randomized controlled trial from June 2011 to November 2012. All patients with American Society of Anesthesiologists physical status I or II undergoing elective otolaryngological or breast surgery were enrolled. Written informed consent was obtained from all patients. Using an envelope method, the patients were randomly assigned to restriction of clear liquid intake for either 2 h (short-period group [SG]) or 4 h (long-period group [LG]). Exclusion criteria are shown in the UMIN-CTR supplement.
Intake of solid foods was discontinued 6 h before anesthesia. Until 2 or 4 h before anesthetic induction, all patients were allowed unlimited oral fluids. Anesthesia management is described in the UMIN-CTR supplement. Anesthesia was maintained with propofol and remifentanil. The inspiratory pressure was adjusted to 12–15 cmH2O, with tidal volume 6–10 ml/kg to maintain an arterial carbon dioxide partial pressure of 35–40 mmHg. An arterial catheter was inserted and connected to a FloTrac sensor version 3.02 (Edwards Lifesciences, USA). When the SVV had stabilized, the patients received an infusion of 6% hydroxyl starch solution (Hespander; Fresenius Kabi, Japan) at a constant rate of 1,000 ml per 60 min using an infusion pump (Terufusion TE-161S; Terumo Corp., Japan). We chose a starch for fluid resuscitation in this study because of the volume remaining in the intravascular space. The cardiac index, stroke volume index, and SVV were recorded automatically until the end of anesthesia.
The next day, a blinded investigator estimated the required duration needed to decrease the SVV to < 13% with the collected data and calculated the required infusion amount. If the patients were already below the target SVV, the required volume was counted as 0 ml.
The primary outcome was the difference between the two groups in the volume required to achieve recovery to an SVV value of < 13%. The secondary outcome was the intergroup difference in the number of patients who exhibited a SVV < 13% at baseline before fluid resuscitation. Statistical analysis is described in the UMIN-CTR supplement.
Of 101 patients analyzed, 48 were in the SG group and 53 in the LG group. Patient preoperative profiles are summarized in Table 1. There were no significant differences in sex, age, height, weight, physical status, or amount of clear liquid intake between the two groups. Patient intraoperative profiles are summarized in Table 1. With respect to the primary outcome, a greater amount of infusion was required in the LG (2.2 ml/kg) than in the SG (1.7 ml/kg), without statistical significance (P = 0.378). With respect to the secondary outcome, 11 (22.9%) patients in the SG and 2 (3.8%) in the LG had an SVV of < 13% before infusion (P = 0.006). The SVV at baseline was 16 in the SG and 17 in the LG (P = 0.023).

Patient's Characteristics
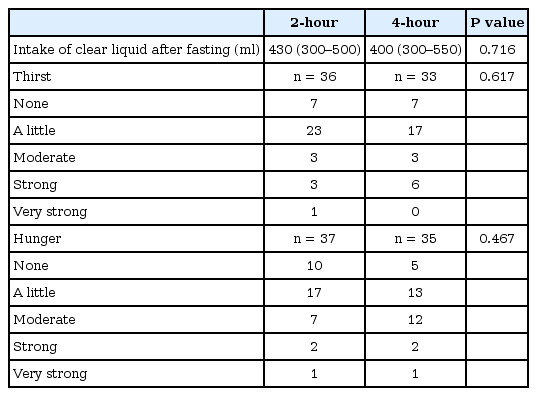
Degree of Thirst and Hunger

Changes in Hemodynamic Parameters according to Volume Infusion
The present study demonstrated that the preoperative volume deficit after a 2-h liquid-intake restriction was not different compared to that after a 4-h restriction. We believe that these data will be helpful for establishing a fluid management strategy after preoperative clear liquid restriction.
There are possible explanations for the lack of differences in the intravascular volume between the 2- and 4-h restriction periods in this cohort. First, our study might have been too underpowered to detect a statistically significant difference. The difference was only 0.5 ml/kg; this is much smaller than 1.6 ml/kg, which was the value expected based on our sample size calculation. Our result of 1.7 ml/kg for the 2-h deficit is consistent with that of previous studies that determined a functional deficit of about 200 ml by estimating SV with esophageal Doppler [5]. That may indicate that fluid resuscitation to an optimal intravascular volume shows only a small difference between 2- and 4-h fluid restriction periods.
Second, we did not determine the amount of clear liquid ingested preoperatively and allowed patients to drink clear liquid according to thirst. This might have induced considerable individual variation in the requisite volume. However, the preoperative guideline regulates the amount of clear liquid intake before oral restriction. We do not believe that it is necessarily beneficial to compel patients to drink a specified amount of liquid.
Our study had several other limitations. First, we chose otolaryngological and breast surgery because little blood loss occurred and both surgeries were weak surgical stimuli. Second, we chose a starch instead of a crystalloid because starches remain in the intravascular space. Further study is needed.
Our study demonstrated that the preoperative volume deficit after a 2 h liquid intake restriction is comparable to that after a 4 h restriction. The variation in the requisite volume deficit should be carefully considered for clear liquid restriction.
Acknowledgements
We thank Dr. Kazuma Fujikake, Dr. Naoko Takeuchi, Dr. Min-Hye So, Dr. Shinichiro Yoshimura, Dr. Yoshiki Sento, Dr. Satoshi Aoki, Dr. Yukiko Mori, Dr. Taiki Kojima, Dr. Kentaro Miyake, and Dr. Haruko Ota for helping to collect atrial samples and acquire data