Correlation between regional tissue perfusion saturation and lactate level during cardiopulmonary bypass
Article information

Abstract
Background
Cardiopulmonary bypass (CPB) can cause systemic hypoperfusion, which remains undetected by routine monitoring of physiological parameters. Noninvasive tissue perfusion monitoring offers a clinical benefit by detecting low systemic perfusion. In this study, we tried to evaluate whether regional tissue perfusion saturation reflects systemic hypoperfusion during CPB.
Methods
This retrospective study included 29 patients with American Society of Anesthesiologists physical status II–III, who required cardiac surgery with CPB. We evaluated the correlations of serum lactate and delivery oxygen with organ perfusion values of peripheral tissue oxygen saturation and cerebral oxygen saturation. Data were recorded at different stages of CPB: T1 (pre-CPB), T2 (cooling), T3 (hypothermia), T4 (rewarming), and T5 (post-CPB).
Results
Lactate levels were elevated after CPB and up to weaning (P < 0.05). The levels of peripheral and tissue oxygen saturation decreased after the start of CPB (P < 0.05). Lactate levels were negatively correlated with peripheral tissue oxygen saturation levels at T4 (R = −0.384) and T5 (R = −0.370) and positively correlated with cerebral oxygen saturation at T3 (R = 0.445). Additionally, delivery oxygen was positively correlated with peripheral tissue oxygen saturation at T4 (R = 0.466).
Conclusions
In this study, we demonstrated that peripheral tissue oxygen saturation can be a reliable tool for monitoring systemic hypoperfusion during CPB period. We also believe that peripheral tissue oxygen saturation is a valuable marker for detecting early stages of hypoperfusion during cardiac surgery.
Introduction
Cardiopulmonary bypass (CPB) is a technique in which an external system temporarily takes over the function of the heart and lungs during cardiac surgery, maintaining the circulation of blood and the oxygen content of the body. Cardiac and major vascular surgeries require CPB. The procedure results in the deterioration of normal vascular physiology, as well as the release of a variety of debris into the bloodstream, including fragments of blood cells, tubing, and plaques. For example, when surgeons clamp and connect the aorta to tubing, the resulting emboli may block blood flow and cause mini strokes [1]. Despite its importance, the monitoring of tissue perfusion during CPB is challenging because mixed venous oxygen saturation (SvO2) cannot be measured during CPB, and pulse oximetry does not function correctly in a hypothermic state. Therefore, conventional methods, such as mean blood pressure measurement, blood gas analysis, and intake/output, are commonly used during CPB. However, these conventional methods often fail to detect occult hypoperfusion. Abou-Khalil et al. [2] reported that conventional methods could not detect occult hypoperfusion in traumatic patients and recommended early invasive monitoring methods, such as serum lactate sampling and pulmonary catheterization, in critically ill patients.
Measurement of serum lactate, which is the most commonly used biomarker for detecting hypoperfusion, provides valuable clinical information during CPB. However, the procedure for monitoring serum lactate levels is limited by the delay in obtaining results, which renders continuous monitoring challenging. SvO2, which is mostly used for monitoring tissue perfusion in critical patients, cannot be measured during CPB because the pulmonary artery catheter is retracted before cardiotomy. Therefore, a continuous and noninvasive method for monitoring perfusion during CPB is required.
Near-infrared spectroscopy (NIRS) is a spectroscopic method that uses the near-infrared region of the electromagnetic spectrum (from about 700 to 2500 nm). This technique was initially applied for detecting the state of regional tissue perfusion by attaching electrodes at specific parts of the body, such as the frontal head, abdomen, thenar muscle, or thigh. However, the concept that small areas of tissue perfusion can be representative of whole-body perfusion has been suggested [3].
Therefore, in this study, we attempted to validate the clinical utility of regional perfusion saturation for detecting whole body hypoperfusion during CPB. We analyzed the correlation of skeletal muscle (StO2) and cerebral (SctO2) tissue oxygen saturation with levels of serum lactate and delivery oxygen (DO2).
Materials and Methods
Study participants
Twenty-nine patients (male, 18; female, 11; mean age, 55 [14] years) were included in this study. This retrospective study was conducted with the approval of the Institutional Review Board. We collected the data of 29 patients (age range, 18–75 years) with American Society of Anesthesiologists physical status II–III, who required elective or emergency cardiac surgery with CPB (Table 1). Data were collected in cases of both elective and emergency surgeries. All CPB perfusions were non-pulsatile. We excluded patients who were undergoing reoperation within 1 year of previous surgery and those with preoperative serum lactic acid concentration > 3.0 mM, or preoperative cerebrocortical oxygen saturation < 50% [4]. Three patients were excluded because their intraoperative StO2 data could not be obtained.
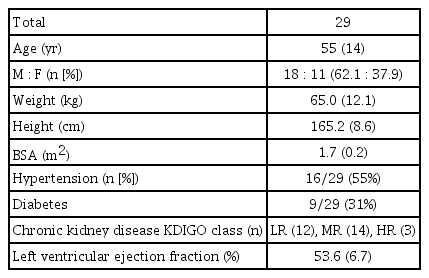
Patients’ Demographics
Protocol
We obtained measurements of the relevant parameters at five specific stages of CPB: before sternotomy (T1, pre-CPB), after 20 min of CPB (T2, cooling), after cardiotomy (T3, hypothermia), at the start of rewarming (T4, rewarming), and 10 min after protamine injection (T5, post-CPB).
All patients underwent preoperative evaluation on the day before the operation and were given midazolam (0.05 mg/kg intramuscularly) for premedication. In the operation room, patients were given O2 at a rate of 4 L/min. The cerebral NIRS amplifier, electrocardiogram leads II and V5, pulse oximeter, and external defibrillation pad were applied. Patients were subsequently anesthetized while in the supine position. We administered 1% propofol (1.5–2 mg/kg intravenously [IV]) and fentanyl (0.05–0.1 μg/kg IV). After the loss of consciousness, patients were administered cisatracurium (0.15 mg/kg IV) and ventilated by mask bagging for 3 min with O2 at 6 L/min. Once the maximal muscle relaxation state was reached, we performed intubation, connected the anesthesia machine circuit (PrimusⓇ; Draeger, Germany), and initiated semi-closed machine ventilation. Sevoflurane (1–1.5 vol%) and remifentanil (0.05–2 μg/kg/min) were used to maintain anesthesia. We maintained a fractional inspired oxygen tension of 0.5 (O2 1 L/min, air 2 L/min), tidal volume of 8–10 ml/kg, respiration rate of 10–12 per minute, and partial pressure of CO2 of 35–40 mmHg. Continuous infusion of cisatracurium (1–2 μg/kg/min) was performed to maintain muscle relaxation during the operation. During CPB, total intravenous anesthesia was applied with propofol and remifentanil.
Collateral circulation in the ulnar artery was evaluated using the modified Allen test. A 20-gauge catheter was inserted into the left or right radial artery for blood pressure monitoring. We then inserted a vascular access catheter (9.0 Fr.; AVATM; Edward Lifesciences LLC, USA) into the internal jugular vein for proper transfusion, fluid resuscitation, drug administration, and monitoring of central venous pressure and pulmonary capillary wedge pressure. We additionally inserted rectal and oropharyngeal temperature probes with a 12-Fr temperature sensor to monitor body temperature. For perfusion monitoring, we applied bilateral near-infrared ray cerebral oximetry probes (INVOS 5100TM; Somanetics/Covidien Ltd., Ireland) 5 mm above the eyebrows. A bispectral index sensor (BIS-QuatroⓇ, Covidien Ltd., Ireland) was placed on the forehead to evaluate the depth of anesthesia according to changes in the electroencephalogram and electromyogram readings. Further, an StO2-thenar clip (InSpectraTM, Model 300; Hutchinson Technology, Hutchinson, USA) was attached to the thenar muscle contralateral to the radial artery cannulation site to detect peripheral StO2.
Several cardiopulmonary parameters, including systolic, diastolic, and mean arterial pressure, heart rate, StO2 (%), SctO2 (%), mean right/left, and temperature (rectal/esophageal) were evaluated every 5 min. Arterial blood gas sampling was performed via radial artery cannulation, as well as measurements of plasma lactate, hematocrit, pH, and plasma partial pressures of oxygen (PAO2) and carbon dioxide (PACO2). Serum lactate was sampled 109 min later after other parameters had been measured. We maintained a mean blood pressure of 70–100 mmHg before and after CPB; during CPB, a mean blood pressure of 50–80 mmHg was maintained with a pump flow of 1.9–2.6 L/min/m2. Mild hypothermia (28 to 34°C) was induced during CPB. We manipulated acid-base balance and pH during cardiopulmonary bypass with the gradual change of temperature. We maintained a blood pH of 7.40 (0.05), PACO2 of 35–45 mmHg, and PAO2 of 150–200 mmHg.
After cardiac surgery, all patients were admitted to the intensive care unit (ICU) for postoperative care.
Statistical analysis
All data are presented as mean (SD). The value of StO2 was the major target value. Repeated measures analysis of variance (ANOVA) was performed to confirm the changes in each group according to the sampling time of each parameter. These changes were corrected using the Bonferroni method. Correlations between various parameters were evaluated using Pearson’s correlation analysis. All statistical analyses were performed using SPSS version 11.0 for Windows (SPSS Inc., USA); we considered a P value < 0.05 to indicate statistical significance.
Results
The mean durations of operation and CPB were 453.5 (107.8) min and 162.7 (47.5) min, respectively (Table 2). The analysis of the monitoring data revealed a periodic increase in serum lactate levels (P < 0.05) at all stages of CPB (Fig. 1A). In addition, both StO2 and SctO2 were decreased during CPB compared to pre-CPB values (Figs. 1B and 1C). Although the pre-CPB values of DO2 could not be obtained, the DO2 levels at T3 and T4 were found to be lower compared to those at T2 (Fig. 2). The results of correlation analysis revealed that the serum lactate levels were negatively correlated with the StO2 levels at T4 (R = −0.384) and T5 (R = −0.370) and positively correlated with the SctO2 levels at T3 (R = 0.445), with the correlations exhibiting statistical significance (P < 0.05; Fig. 3). Additionally, StO2 was positively correlated with DO2 at T4 (R = 0.466, P < 0.05; Fig. 4).

Characteristics of Surgeries
Graphs showing the changes in serum lactate levels, peripheral tissue (StO2), and cerebral (SctO2) oxygen saturation levels, as compared to preCPB values. Fig. 1A also shows periodic changes in serum lactate levels during CPB. CPB: cardiopulmonary bypass. *P < 0.05 compared with pre-CPB (T1) values. †P < 0.05 compared with the values at cooling (T2). ‡P < 0.05 compared with the values at hypothermia (T3). §P < 0.05 compared with the values at rewarming (T4).

Graph showing the changes in serum oxygen delivery (DO2) during cardiopulmonary bypass (CPB) as compared to cooling state values (T2). *P < 0.05 compared with cooling (T2) values.

(A) Graph showing the correlation between serum lactate levels and cerebral oxygen saturation (SctO2) levels. (B, C) Graphs showing the correlation between serum lactate levels and tissue oxygen saturation (StO2) levels. (D) Graph showing the variations of StO2, SctO2, and serum lactate levels. Values are expressed as correlation coefficient R and P values. CPB: cardiopulmonary bypass. *P < 0.05 compared with serum lactate.
(A) Graph showing the correlation between oxygen delivery (DO2) and tissue oxygen saturations (StO2). (B) Graph showing the variation of StO2, cerebral oxygen saturation (SctO2), and DO2. Values are expressed as correlation coefficient (R) and P values. CPB: cardiopulmonary bypass. *P < 0.05 compared with serum lactate.
Discussion
C-reactive protein, interleukin-8, CD64, and lactate are currently used as biomarkers for detecting poor organ perfusion [5], while lactate is the most commonly used biomarker for evaluating hypoxic tissue state. Many studies have reported that blood lactate levels are highly correlated with prognosis in critically ill patients [6–9]. Vitek and Cowley [6] reported that blood lactate levels were helpful for predicting the prognosis of various forms of shock. Bakker et al. [7] confirmed that blood lactate levels are superior to oxygen-derived variables, such as DO2 and oxygen consumption, for predicting outcomes in human septic shock. In addition, Marecaux et al. [9] showed that blood lactate levels are better prognostic indicators than levels of tumor necrosis factor and interleukin-6 in patients with septic shock. Moreover, according to the recently published Surviving Sepsis Campaign guidelines (2012) for sepsis treatment, the monitoring of serum lactate is recommended over that of other biological markers in the early sepsis state [10]. Initial serum lactate levels had been found to be correlated with mortality rates, with up to 75% mortality in critically ill patients who had lactate levels > 4.4 mM [11]. Abramson et al. [12] also reported that trauma patients with 48-hour serum lactate levels > 2 mM exhibited greater mortality and morbidity than those with serum lactate levels < 2 mM. In the present study, serum lactate levels were over 2 mM from cooling state (2.5 [1.0] mM) to post-CPB (3.9 [1.5] mM). Considering the duration of CPB (162.7 [47.5] min), serum lactate levels were high enough to suggest the occurrence of occult hypoperfusion during CPB. Park et al. [13] reported that pediatric cardiac patients who had major adverse events showed mean serum lactate levels of 4.2 mM at weaning from CPB, whereas pediatric cardiac patients who did not have major adverse events showed mean levels of 2.1 mM. In our study, the mean serum lactate level during the weaning period was 3.1 (1.1) mM.
Although blood lactate level is a good biomarker for tissue hypoperfusion, it has some limitations. Lactate level monitoring entails intermittent blood sampling and a time delay until results are obtained; however, continuous perfusion monitoring has been advocated for clinically ill patients. Sakr et al. [14] reported the development of multi-organ failure, as well as increases in lethality and mortality, consequent to increased tissue hypoxia, which had been caused by a continuous in vivo perfusion deficit. Therefore, we consider that lactate level monitoring does not provide sufficient information to prevent occult hypoperfusion during CPB.
NIRS was introduced into clinical practice for the continuous and noninvasive monitoring of tissue perfusion. This technique was first applied in the cerebral regions [15,16] and the value of cerebral perfusion was expressed as the oxygen saturation value, SctO2. SctO2 is commonly used to detect cerebral hypoperfusion during CPB and has become one of the essential values in cardiac anesthetic monitoring, but its purpose was limited to the protection of the cerebral region. Recently, the purpose of cerebral-NIRS was extended to detect systemic perfusion. Murkin et al. [3] showed that management of SctO2 could reduce the duration of stay in the ICU, as well as the occurrence of renal failure and myocardial ischemia, and suggested that SctO2 is correlated with whole-body perfusion. Moreover, Mittnacht [17] reported that that cerebral-NIRS reflects the systemic hypoperfusion in high-risk pediatric patients. Recently, NIRS was developed to include the skeletal muscles. This device measures oxygen saturation in peripheral tissues as a means of estimating systemic perfusion [18]. McKinley et al. [19] evaluated the oxygen saturation levels of peripheral tissues, including the thenar and biceps muscles, in 24 patients under ventilator care and found that oxygen saturation data collected from the thenar muscle exhibited greater accuracy compared to those collected from the biceps. Skarda et al. [20] also reported that the value of thenar muscle saturation provides appropriate information about the systemic perfusion state in patients with severe sepsis. Following this line of reasoning, we applied NIRS sensors to the thenar muscles in the present study. Crookes et al. [21] validated the StO2 of the thenar muscle in 707 healthy, ambulatory volunteers and 150 traumatic patients. The authors recommended 87% (6%) as the normal range of StO2 and concluded that a decreased thenar StO2 reflects the presence of severe systemic hypoperfusion. The mean pre-CPB value of StO2 in our patients was 81% (6%). Cohn et al. [22], in a study that included 151 patients with trauma, also evaluated whether the oxygen saturation of the thenar muscle could predict multiple organ failure. The authors reported that StO2 predicted multiple organ failure with a sensitivity of 78% and a specificity of 39%, and it also exhibited an efficacy similar to that of other parameters, such as base deficit and blood pressure, in the prediction of multiple organ failure or death. In this study, we were able to confirm that serum lactate levels increased, while StO2, SctO2, and DO2 simultaneously decreased during CPB. We also observed that StO2 was negatively correlated with lactate concentration during the rewarming and reperfusion stages of CPB and was positively correlated with DO2 in the rewarming stage of CPB; these findings, we believe, suggest that StO2 is reliable in the detection of systemic hypoperfusion during CPB. Although SctO2 decreased significantly during CPB, we could not observe a negative correlation between SctO2 and lactate levels. Instead, we observed a positive correlation between lactate and SctO2 in the hypothermic stage of CPB. At our cardiac surgical center, we control the acid-base balance during CPB in a pH-stat manner. We add carbon dioxide to the oxygenator gas inflow to maintain pH-stat content during the hypothermic stage of CPB. Under these conditions, cerebral blood flow becomes more dependent on PACO2. Consequently, additional carbon dioxide could increase the total blood flow in the brain [23]. These vulnerabilities of cerebral flow due to PACO2 might have masked the systemic value of SctO2 in the present study. However, the value of StO2 reflected the serum lactate level during the hypothermic period of CPB. Thus, we believe that StO2 could reflect systemic hypoperfusion in the hypothermic stage of CPB because the hypothermia caused microcirculation disturbances.
This retrospective study has several limitations. First, the study was conducted at a single center, which renders its reproducibility at other hospitals uncertain. Second, we did not limit the inclusion criteria to a single type of surgery; instead, we analyzed various types of cardiac surgery. In addition, we analyzed only data obtained during surgery because we did not routinely monitor tissue oxygen saturation in the ICU. Third, the relatively small sample size limited this study in terms of the performance of a more categorized analysis and significance testing of some variables, although we proved the significance of the study by increasing our sample size to above 80%, the generally accepted standard. Fourth, patients’ predisposing diseases, such as chronic kidney disease, hypertension, and diabetes, might affect their blood flow reserve. Therefore, these conditions make patients more vulnerable to occult hypoperfusion during CPB. In this study, the demographic data showed 55% of patients had hypertension and 31% had diabetes. However, the purpose of this study was to evaluate the correlation between serum lactate levels and StO2 during CPB, not to estimate the absolute values of lactate level. We assumed that hypertension and diabetes would only have a minimal effect on our results.
In conclusion, in this study, we found a significant correlation between StO2 and serum lactate levels during CPB, which may indicate the reliability of StO2 for the detection of systemic hypoperfusion during CPB. Therefore, we suggest that StO2 is a valuable parameter for detecting a systemic hypoperfusion state during CPB.