Influence of electrocautery-induced electromagnetic interference on quantitative electroencephalographic monitoring of hypnosis during general anesthesia: comparison between the ADMS® and the BIS VISTATM
Article information

Abstract
Background
Hypnosis monitors analyze small-amplitude electrical signals transmitted from the brain that could be exposed to the electromagnetic field that occurs around the body during electrocautery (ECT). We investigated the influence of ECT on hypnosis monitoring during anesthesia.
Methods
We simultaneously monitored BIS and uCON during 50 gynecologic oncology surgeries. During the episodes of ECT, we compared the absolute difference (a-Diff) between the baseline index and the most deviated index after ECT over either 30–60 s (ECT30–60) or more than 60 s (ECT > 60) between the monitors. We also investigated the bias and the limits of agreement between the monitors.
Results
Between the two monitors, the a-Diff of ECT30–60 was 1.4 ± 1.1 for the BIS, which was significantly greater than 0.6 ± 0.9 for the uCON (P = 0.003), and the a-Diff of ECT > 60 was 16.5 ± 8.2 for the BIS, which was also significantly greater than 1.4 ± 1.3 for uCON (P < 0.001). The intra-monitor index differences showed that the BIS during ECT > 60 was significantly greater than that during ECT30–60 (P < 0.001), but the uCON showed no significant difference between ECT30–60 and ECT > 60 (P = 0.056). The estimated bias between the monitors was 6.3 ± 9.8 and 95% limits agreement was –12.3 to 25.0.
Conclusions
Prolonged ECT intervention might lead to spurious estimations of quantitative EEG indexes. Therefore, hypnosis should be clinically assessed in combination with scrutinized judgment of relevant clinical symptoms and signs for hypnosis.
Introduction
To prevent intraoperative awareness and assess patients’ hypnotic states, various measures and indicators such as eyeball movement, pupillary reflex, arterial pressure, and sweating have traditionally been used during anesthesia [1,2]. However, it has been reported that these symptoms and signs do not assess the overall depth of anesthesia [3,4].
Since the early 1990s, owing to advances in modern computer technology and complex statistical modeling techniques, raw electroencephalogram (EEG) signals have been easily analyzed and processed to be transformed as quantitative, dimensionless numbers that range from 0 to 99 or 100 that indicate the quantitative EEG indexes (qEEGi) used for hypnosis status during anesthesia. A bispectral index (BIS) monitor (BIS VISTATM, Aspect Medical Systems, Inc., USA) provides clinicians with a qEEGi of the BIS using bispectrum power analysis and nonlinear mixed-effects modeling [5], and maintaining a BIS between 40 and 60 has been reported to decrease the incidence of intraoperative awareness [6–8].
Recently, the ADMS® (Unimedics CO., Korea) monitor has been developed and introduced into clinical settings. This monitor provides a uCON of the qEEGi using mono-spectral power analysis and an Adaptive Neural Fuzzy Inference System (ANFIS), identical to the qCON index (Quantium Medical, Spain). Moreover, the ADMS® was made to be more stable while minimizing electrical interference and offering a more convenient graphical user interface, which the qCON has been reported to maintain acceptable correlation with the BIS [9].
However, as with any monitor, special issues affect these qEEG monitoring processes, and many factors have been reported as artifacts that could mislead the qEEGi [10]. During anesthesia, various electrical devices that produce direct electrical disturbance or electromagnetic interference have been reported to result in qEEGis that indicate incorrect hypnotic status. In particular, electrocautery (ECT), which is frequently used for surgical procedures such as cutting and coagulation, produces an electromagnetic field around the body and is reported to indicate paradoxically high BIS values [11]. It has also been reported that the BIS is not proportional to the effect-site concentration of propofol during ECT [12].
The purpose of this study was to determine the influence of ECT on the qEEGis from both monitors and their different behaviors by ECT duration for surgical procedures. We also investigated the bias and the agreement between the indexes during anesthesia.
Materials and Methods
After we obtained approval from the Institutional Review Board and written informed consent from the patients, we enrolled 50 adult female patients with American Society of Anesthesiologists physical status 1–3, who were scheduled for gynecologic oncology surgeries in this study. The surgeries were extensive-multidisciplinary, combined with urologic and/or colorectal surgery, and expected to frequently use ECT. We excluded patients under age 16 or over age 80, patients with neurologic, psychiatric, or endocrine disorders, and patients who were taking psychoactive drugs.
We simultaneously employed two monitors, BIS VISTATM (Aspect Medical Systems, Inc., USA) for the bispectral index (BIS) and ADMS® (Unimedics CO., Korea) for the unicon index (uCON). We set the current clocks of the monitors to synchronize to permit discrepancies of 1 s or less between two monitors. We set both the BIS smoothing rate and the uCON data averaging processing time to 15 s, and we saved real-time data at every second for the post hoc analysis. Before we induced anesthesia, we attached each monitor’s electric sensors to the patients’ foreheads as described in their package inserts; we placed the two sensors opposite to each other (Fig. 1), randomly attaching them in one of four positions, contralateral and upper or lower.
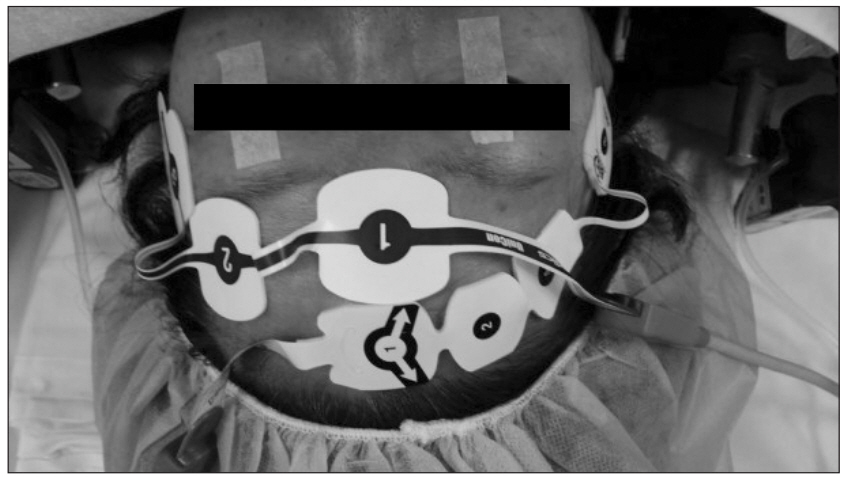
Placement of the BIS and uCON sensors on a patient’s forehead.
We monitored all patients for standard anesthesia measures including electrocardiography, pulse oximetry, end-tidal gas, temperature, invasive blood pressure, and noninvasive cardiac output. After acquiring the pass to check the sensor’s impedance, we induced anesthesia with 1.5–2.0 mg/kg boluses of propofol and targeted remifentanil effect-site concentrations of 3.0–4.0 ng/ml. For neuromuscular blockade, we administered 0.6 mg/kg of rocuronium and performed tracheal intubation. We ventilated the lungs with 50% air in oxygen and maintained anesthesia with 1.0–3.0% sevoflurane and target-controlled remifentanil infusions, which were titrated to maintain BIS between 40 and 60. When the BIS decreased to be below 35 or increased above 65 more than 5 min, the sevoflurane concentration was changed accordingly.
During the surgeries, the surgeon used electrocautery (FXTM Electrosurgical Generator, Valleylab Inc., USA) in unipolar (monopolar) mode for the surgical procedures of coagulation or cutting; we applied the grounding plate to the left buttock and set the ECT output power to 50 W. The ECT starting and ending times were saved in the ADMS® monitor’s memory using the event-mark function. When dose of sevoflurane and remifentanil changed, we excluded from the data analysis the episodes of ECT applied 10 min before and after these dosage changes. We also excluded ECT episodes that used output power at other than 50 W from the post hoc analysis.
The primary outcome measures of the study were the index differences during ECT between the two monitors and the intramonitor differences between the durations of ECT. After the end of anesthesia, we conducted postoperative data analysis. We defined the index at the moment ECT began as “pre-ECT” and defined the maximally deviated index from pre-ECT until 30 s after the ECT ceased as “post-ECT.” We compared the absolute differences (a-Diff = | pre-ECT - post-ECT |) between the monitors. Pilot analysis and our clinical experience showed occasional obscure and abnormal qEEGis when ECT continued for more than 1 min. Therefore, we designed this study to investigate the different aspect changes in both indexes during 30–60 s of ECT (ECT30–60) and more than 1 min of ECT (ECT > 60).
To analyze estimated bias and paired-index agreement between the two qEEGis during surgery, we compared BIS and uCON using the Bland-Altman plot of (BIS + uCON)/2 for BIS – uCON with estimated bias and standard deviation (SD). The 95% limits of agreement are expressed as estimated bias ± 1.96 × SD [13]. We selected the paired-point indexes during the surgery, from skin incision to skin closure, and we also chose the data that had signal quality indexes (SQIs) more than 90 on both monitors and had the BIS artifact value of 0 as convincing signals for the analysis.
All data are expressed as mean ± standard deviation (SD). We used SPSS 13.0 for Windows (SPSS Inc., USA) for the statistical analyses. We compared the ECT30-60 and ECT > 60 between the monitors using the paired sample t test and analyzed the intra-monitor differences between ECT30–60 and ECT > 60 using the independent-sample t test, and we considered P < 0.05 to be statistically significant.
Results
The mean anesthesia duration was 5.2 ± 2.1 h, and the mean patient age was 54.7 ± 12.6 yr separately. The mean height was 152.2 ± 5.3 cm and the weight was 59.3 ± 7.6 kg. There was no statistically significant difference in the position of each sensor: there were 11 cases for the Rt upper BIS/Lt lower ADMS, 12 cases for the Rt lower BIS/Lt lower ADMS, 14 cases for the Lt upper BIS/Rt lower ADMS, and 13 cases for the Lt lower BIS/Rt upper ADMS.
Most duration of ECT lasted less than 30 s. We observed 55 ECT30–60 episodes in 35 of the surgeries, and the mean duration of ECT30–60 was 47.0 ± 8.1 s. We also observed 38 episodes of ECT > 60 in 24 surgeries, and the mean duration of ECT > 60 was 135.0 ± 49.7 s.
During ECT30–60, the BIS a-Diff was 1.4 ± 1.13, and this was significantly greater than the 0.6 ± 0.9 for uCON (P = 0.003), but the mean a-Diff between BIS and ECT was only 0.79 (Table 1). During ECT > 60, the a-Diff was 16.5 ± 8.2 for BIS, and this was significantly greater than the 1.4 ± 1.3 for uCON (P < 0.001). The ECT > 60 BIS was also significantly greater than the ECT30-60 (P < 0.001), but uCON showed no significant difference between ECT30–60 and ECT > 60 (P = 0.056). We observed the maximal difference in the ECT > 60 of BIS, where the BIS had been stable at 32 before the ECT, but it increased to 76 after the ECT.

Absolute Differences (a-Diff) in BIS and uCON between before and after Electrocautery (ECT)
In particular, the abrupt abnormal BIS index variations in the 38 episodes of ECT > 60 showed three different patterns. First, the BIS abruptly increased after we used ECT (22 of 38 episodes, 58.9%). Second, the BIS abruptly decreased after we used ECT (13 of 38 episodes, 34.2%). Third, the BIS abruptly increased and decreased or decreased and increased after we used ECT (3 of 38 episodes, 7.9%). Fig. 2 shows three examples of actual snapshots of BIS and SQI time courses in each abnormal pattern.
Snapshots of the BIS (white spline graph) and SQI (gray spline graph) time courses show three typical abnormal BIS be haviors during ECT > 60 that are highlighted in the white circles. The BIS index showed an abnormal rapid increase (upper snapshot), a rapid decrease (middle snapshot), and rapid increase and decrease or decrease and increase (lower snapshot) during ECT > 60.
Fig. 3 presents the Bland-Altman plots for (BIS + uCON)/2 vs. (BIS - uCON), which contained 99,215 points of index pairs. The estimated bias was 6.3, and the SD was 9.52. The 95% limits of agreement (estimated bias ± 1.96 × SD) were –12.3 to 25.0.
The Bland-Altman plot for (BIS + uCON)/2 vs. (BIS – uCON) contains 99,215 paired-index points recorded for the 50 patients, reflecting the agreement between BIS and uCON. The thin solid line indicates the similarity of the two indexes, the thick solid line indicates the estimated bias of the two indexes, and the dotted lines show the 95% limits of agreement.
Discussion
Short employments of ECT less than 1 min have shown minimal qEEGi differences in BIS and uCON between before and after ECT, and prolonged employments longer than 1 min also had minimal index uCON differences. However, under ECT longer than 1 min, the BIS showed different patterns of abrupt change, and the difference in BIS was significantly greater than the uCON.
The two monitors do have common features: they provide the suppression ratios and SQIs from the time domain, and both perform power analyses from the frequency domain following fast Fourier transforms. However, there are also differences between the two monitors. BIS provides relative-β ratios in the mono-spectral domain and SynchFastSlow in the bi-spectral domain, and these parameters are translated to qEEGi using non-linear mixed-effects modeling. However, uCON is based on mono-spectral power analysis, and four EEG spectral ratios at four different ranges frequencies are translated using ANFIS modeling. Both monitors also calculate EMG power expressed as dB, but the reference power values and target frequency ranges for EMG differ. The EMG bar graph of the BIS displays the power (in decibels) in the frequency range of 70–110 Hz, but the target frequency range EMG in the uCON is 30–45 Hz. The precise algorithms for both modeling techniques are not open source or disclosed to the public, and for this reason we could not interpret the abnormal BIS behavior after the SQI fell to 0 following prolonged ECT and the subsequent SQI increased even though the artifacts from the ECT remained.
During anesthesia, many artifacts are known to influence qEEGi. Based on the original artifact sites, they are classified into three major categories: (1) artifacts from outside the head; (2) artifacts from within the head but outside the brain, EMG; and (3) artifacts from within the brain, atypical or pathologic EEGs [14]. Artifacts from outside the head have been reported to result from atrial pacers [15], warming blanket/convective air-warming systems [16–18], endoscopic shavers [19], electromagnetic systems [11], and laryngeal electromyography monitoring with an EMG endotracheal tube [20]. Most of these papers reported increased BIS during or after ECT and are clinical case reports of one or two patients’ findings. The manufacturer’s guidebook for the BIS VISTATM monitor also shows abrupt BIS increases. However, we could not find any study that reported abnormal decreases and combined increases and decreases during ECT. During pilot study, we just encountered abnormal increases in qEEGi during ECT. However, during the main study of 50 patients, some abnormal decreases or combined increases and decreases of BIS were encountered without any manifestations of changes in patients’ hypnotic status.
Low-voltage small-amplitude EEG signals (voltage range unit: μV) are highly vulnerable and easily contaminated by the high-frequency electromagnetic noise during ECT (voltage range unit: mV). Thus, as soon as ECT begins, the SQI begins to fall. The SQI indicates the percentage of time during which the pure EEG signals vs. other abnormal noise caused by various signals during a recent time interval, which is commonly set to be 1 min in most monitors. Therefore, the SQIs from both monitors fell to 0 after more than one minute of ECT. Inspection of the real-time saved data file showed that after SQI had fallen to zero, the ADMS algorithm was not likely to estimate any additional indexes, and the SQI was maintained at 0 until the ECT ceased. However, 3–4 s after the SQI had fallen to zero, the BIS showed abrupt increases or decreases, and the SQI alone began to increase, but the interference from ECT artifacts continued.
The details of versions of BIS monitor that we used in this study was hardware revision 4.00, platform 2.03, application 3.22. The BIS algorithm and hardware have been continuously developed and upgraded through a number of revisions [21]. The first version was released in 1992, and the most recently available version is BIS hardware platform v4.1; the upgraded versions of BIS that show a close correspondence with this study are v4.0 and 4.1. These versions were revised to make the BIS more resistant to ECT and EMG artifacts and to enhance the recognition and rejection of artifacts. However, when electromagnetic interference continues, the algorithm seems to continue processing the index while elevating the SQI. This forced BIS processing algorithm is difficult to understand and seems to be unreasonable to assess hypnosis during ECT.
In the Bland-Altman analysis of qEEGi data during anesthesia, although the BIS and the uCON were not identical, they did show good agreement. Jensen et al. [9] found that the bias between BIS and qCON was –2, the SD was 12, and the 95% of limits of agreement were calculated as –26 to 22, whereas our study showed positive bias of difference. However, visual inspection of the Bland-Altman plots from that study might indicate a positive bias during a moderate hypnosis range of 40 to 60 on the mean axis. In their study, Jensen et al. performed their comparisons throughout the full range of hypnosis from alert state to deep hypnosis to recovery. In contrast, we only analyzed the paired-qEEGi data for the anesthesia maintenance period, excluding the induction and recovery periods because the monitors showed different time delays in providing the indexes during these periods.
There are two limitations of this study. First, we only used one kind of electrosurgical device, and we conducted our analyses at 50 W of fixed output power for ECT. We presumed that different ECT models or different output power could influence abnormal qEEGi behaviors, but in pilot experiments, a few applications of different ECT blend models or unipolar ECT modes at output power of 30 W and 70 W showed the same BIS patterns after more than 1 min of ECT. Second, the two sensors can be attached to patients’ foreheads in eight combinations of contralateral and ipsilateral and upper and lower locations, and for this study, we randomly used the four contralateral combinations. Niedhart et al. [22] reported the influence of various placements of BIS sensors on BIS monitor bias and agreement, and BIS monitoring failed to provide consistent intra-patient reproducibility when the sensors were placed in different locations. However, this limitation could only concern the agreement between different sensor application methods apart from the influence of ECT on hypnosis monitors.
Conclusively, the electromagnetic interference of ECT during anesthesia could lead to spurious qEEGi monitoring, and this could provide incorrect hypnotic status values and could result in inadvertent titration of anesthetics. Therefore, it is highly recommended that scrutinized clinical judgment be used when interpreting the qEEGi in combination with other available clinical hypnosis information.