Acid/base alterations during major abdominal surgery: 6% hydroxyethyl starch infusion versus 5% albumin
Article information

Abstract
Background
To compare the effects of intraoperative infusions of balanced electrolyte solution (BES)-based hydroxyethyl starch (HES) and saline-based albumin on metabolic acidosis and acid/base changes during major abdominal surgery conducted using Stewart’s approach.
Methods
Forty patients, aged 20-65 years, undergoing major abdominal surgery, were randomly assigned to the HES group (n = 20; received 500 ml of BES-based 6% HES 130/0.4) or the albumin group (n = 20; received 500 ml of normal saline-based 5% albumin). Acid-base parameters were measured and calculated using results obtained from arterial blood samples taken after anesthesia induction (T1), 2 hours after surgery commencement (T2), immediately after surgery (T3), and 1 hour after arriving at a postanesthetic care unit (T4).
Results
Arterial pH in the HES group was significantly higher than that in the albumin group at T3 (7.40 ± 0.04 vs. 7.38 ± 0.04, P = 0.043), and pH values exhibited significant intergroup difference over time (P = 0.002). Arterial pH was significantly lower at T3 and T4 in the HES group and at T2, T3, and T4 in the albumin group than at T1. Apparent strong ion difference (SIDa) was significantly lower at T2, T3, and T4 than at T1 in both groups. Total plasma weak nonvolatile acid (ATOT) was significantly lower in the HES group than in the albumin group at T2, T3 and T4 and exhibited a significant intergroup difference over time (P < 0.001).
Conclusions
BES-based 6% HES infusion was associated with lower arterial pH values at the end of surgery than saline-based 5% albumin infusion, but neither colloid caused clinically significant metabolic acidosis (defined as an arterial pH < 7.35).
Introduction
Major abdominal surgery often requires large volumes of intravenous fluid infusion due to blood and third space losses. Inadequate volume resuscitation might lead to lactic acidosis, whereas water excess might aggravate metabolic acidosis and induce a decline of apparent strong ion difference (SIDa) and hyperchloremia [1].
Colloids like albumin and hydroxyethyl starch (HES) are used for volume resuscitation due to their prolonged intravascular volume sparing effects as compared with crystalloids [2]. According to previous clinical studies, different components in colloids influence acid-base status after fluid resuscitation. Hetastarch solution (6%) at 15 ml/kg reduces base excess, pH, and strong ion difference (SID), while the same volume of 5% albumin preserves pH, base excess (BE), and SID [3]. A comparative study conducted during major urologic procedures showed that serum bicarbonate (HCO3−) levels decreased significantly more in patients infused with saline-based HES than in those infused with balanced electrolyte solution (BES)-based 6% HES 130/0.4 [4]. Furthermore, in patients with acute normovolemic hemodilution, 6% HES containing chloride (Cl−) at 154 mmol/L induced a three times greater decrease in SID than 5% albumin containing Cl− at 150 mmol/L, despite similar pH changes [5].
Normal saline-based human albumin is considered the reference colloid solution, and theoretically, saline-based albumin resuscitation can increase serum albumin concentration and increase total plasma weak nonvolatile acid (ATOT) and concomitantly reduce SIDa [6]. Furthermore, BES-based HES had been reported to aggravate metabolic acidosis significantly less than saline-based HES in patients undergoing cardiac surgery [7].
We hypothesized that intraoperative infusion of BES-based HES might attenuate metabolic acidosis more so than salinebased albumin during major abdominal surgery. Accordingly, we investigated and compared acid/base changes caused by BESbased 6% HES 130/0.4 infusion and saline-based 5% albumin infusion during major abdominal surgeries conducted using Stewart’s approach.
Materials and Methods
Approval was obtained from the ethics committee of our institution (GCIRB2017-273) prior to study commencement, and all study subjects provided informed consent. Forty patients (aged 20 to 65) of American Society of Anesthesiologists (ASA) physical status 1 or 2 scheduled for elective major abdominal surgery were enrolled in this prospective study. The major abdominal surgeries were open gastrectomy, colectomy, and low anterior resection. Patients with active pulmonary disease, uncontrolled cardiovascular disorder, renal insufficiency, coagulopathy, anemia, pre-existing metabolic disorder, pre-existing electrolyte abnormality, and those taking laxatives or diuretics were excluded. Patients were randomly assigned to receive 500 ml of BES-based 6% HES 130/0.4 (HES group, n = 20) or 500 ml of normal saline-based 5% albumin (Human serum albumin injection 5%, Greencross, Korea) (albumin group, n = 20) during surgery using an Excel 2007 (Microsoft Office, USA) generated randomized list without stratification. BES-based 6% HES 130/0.4 (VolulyteTM, Fresenius Kabi, Germany) contains HES 60 g/L, sodium (Na+) 137 mmol/L, potassium (K+) 4 mmol/L, magnesium (Mg2+) 1.5 mmol/L, Cl– 110 mmol/L, and acetate 34 mmol/L, and normal saline-based 5% albumin (human serum albumin injection 5%, Greencross, Yongin, Korea) contains albumin 50 g/L, Na+ 154 mmol/L and Cl– 154 mmol/L.
Patients were pre-medicated 30 min before anesthesia induction with intramuscular glycopyrrolate 0.2 mg and midazolam 2 mg. In the operating room, pulse oximetry, electrocardiogram, and non-invasive blood pressure monitoring were applied. For anesthetic induction, lidocaine 0.5 mg/kg, remifentanil 0.5–1 μg/kg, propofol 1.5–2 mg/kg and rocuronium 0.8 mg/kg were administered, and for anesthetic maintenance, sevoflurane 1.5–2 vol%, and remifentanil 0.1–0.2 μg/kg/min were used to maintain a bispectral index (BIS) of 40–55. A 20 G radial arterial catheter, a 14 Fr two-lumen internal jugular catheter, a urinary catheter, and an esophageal temperature probe were inserted after anesthetic induction. Using a S/5 Avance anesthetic machine (GE Healthcare, USA), mechanical ventilation was set at a tidal volume of 8 ml/kg of ideal body weight (0.919 × [height in cm − 152.4] + 50 for males or 45.5 for females) at an inspiratory: expiratory (I : E) ratio of 1 : 2 and a positive end-expiratory pressure of 5 cmH2O. Respiratory rate was set at 8–12 breaths/min to maintain end-tidal carbon dioxide tension at 35–40 mmHg. In both the HES and albumin groups, Plasmalyte (Plasma solution A, CJ Pharmaceutical, Korea), containing Na+ 140 mmol/L, Cl− 98 mmol/L, K+ 5 mmol/L, Mg2+ 3 mmol/L, acetate 27 mmol/L, and gluconate 23 mmol/L, was administered at a rate of 7–8 ml/kg/h. After abdominal exploration, 500 ml of 6% HES or 5% albumin were infused for 2 hours (250 ml/h). Packed red blood cells were transfused when hematocrit fell below 25%. Arterial blood was sampled at 10 min after anesthesia induction (T1; before the start of HES or albumin administration), 2 hours after starting surgery (T2; after completing HES or albumin administration), at the end of surgery (T3), and 1 hour after arriving in a postanesthetic care unit (T4). Arterial blood gas analysis (GEM Premier 3000, Instrumentation Laboratory, USA) included pH, arterial partial pressures of oxygen (PaO2) and carbon dioxide (PaCO2), BE, and HCO3−. Concentrations of serum albumin (determined by colorimetry using bromocresol complex), Na+, K+, Mg2+, Ca2+, Cl− (determined using ion selective electrodes), phosphate (P−; ultraviolet photometry of a phosphomolybdate complex), hemoglobin, hematocrit, prothrombin time (PT), activated partial thromboplastin time (aPTT), and platelet counts were measured.
The negative charges displayed by inorganic phosphate (Pi−) and serum albumin (Alb−), ATOT, effective SID (SIDe), SIDa, strong ion gap (SIG), and anion gap (AG) were calculated using the following equations:
i. Alb− (mmol/L) = serum albumin concentration (g/L) × (0.123 × pH − 0.631)
ii. Pi− (mmol/L) = P− × (0.309 × pH − 0.469)
iii. ATOT (mmol/L) = Alb− + Pi−
iv. SIDa (mmol/L) = Na+ + K+ + Mg2+ + Ca2+ − Cl− − lactate−
v. SIDe (mmol/L) = HCO3− + Alb− + Pi−, SIG (mmol/L) = SIDa − SIDe
vi. AGobserved (mmol/L) = Na+ + K+ − Cl− − HCO3−
vii. AGcorrected (mmol/L) = AGobserved + 0.25 × (42 [g/L] − observed albumin concentration [g/L]).
Statistical analysis was performed using PASW Statistics for Windows, ver. 18.0 (SPSS Inc., USA). Based on the results of a previous study [8], which reported a mean AGcorrected (standard deviation) of 17.0 (3.2) after administering normal saline based 5% albumin, 19 patients were needed per group to detect an intergroup AGcorrected difference of 20% with an α-error of 0.05 and a β-error of 0.8. To account for possible drop out, 20 patients were enrolled per group. The Kolmogorov-Smirnov test was used to assess the normalities of continuous variable distributions. Normally distributed parametric data are presented as mean ± SD, and skewed data as median [interquartile ranges]. Parametric data were analyzed using student’s t test and non-parametric data using the Mann-Whitney U test to examine intergroup differences. Categorical data were analyzed with the chi-square test or Fisher’s exact test. ANOVA and Kruskal-Wallis test were used to analyze intergroup difference over time for parametric and non-parametric data, respectively. Statistical significance was accepted for P values < 0.05.
Results
No significant intergroup difference was observed between patient characteristics or intraoperative data in the HES and albumin groups (Table 1) or between group hemodynamic variables or body temperatures (Table 2). Furthermore, estimated blood loss, pre- and postoperative hemoglobin/hematocrit, platelet counts, and PT and aPTT values were similar in the two groups. No patient required transfusion of blood components.
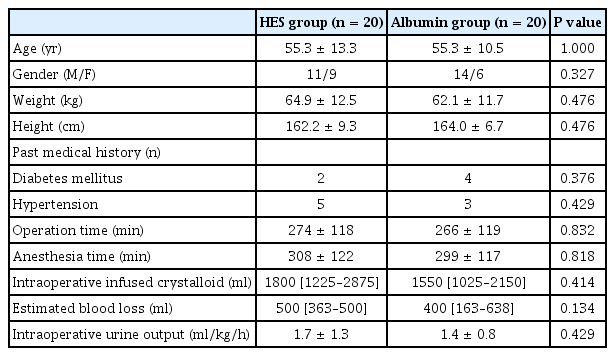
Patient Characteristics and Intraoperative Data

Changes in Hemodynamic Variables and Body Temperature during Major Abdominal Surgery
Measured variables from arterial blood gas and laboratory analyses are summarized in Table 3. With the exception of serum albumin, no intergroup difference was observed for any variable at any time point. Serum albumin concentrations were significantly higher in the albumin group than in the HES group at T2, T3, and T4 (all P values < 0.001). In the HES group, K+ was lower at T4 (P = 0.015) and base deficits were lower at T4 than at T1 (P = 0.019). In the albumin group, Ca2+ was lower at T3 and T4 (P = 0.001 and 0.032, respectively), HCO3− was lower at T4 (P = 0.048), and base deficits were lower at T2, T3 and T4 than at T1 (P = 0.024, < 0.001, < 0.001, respectively). In both groups, albumin was significantly lower at T2, T3 and T4 than at T1 (all P values < 0.001 in the HES group and P < 0.001, < 0.001 and 0.004, respectively, in the albumin group) and lactate was lower at T4 than at T1 (P = 0.001 in the HES group and P = 0.011 in the albumin group).
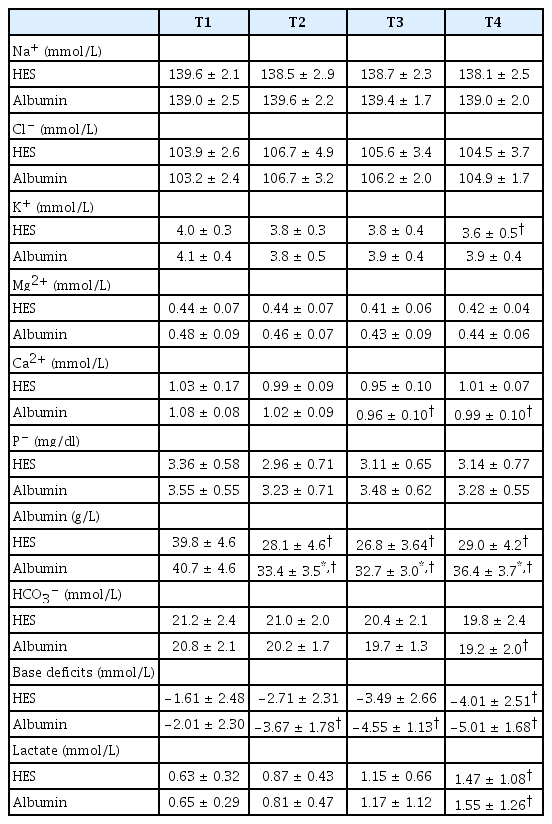
Arterial Blood Gas Analysis and Laboratory Blood Test Results
Observed acid/base changes during the surgery are summarized in Fig. 1. Changes in pH, PaCO2, SIDa, and ATOT over time were significant (all P values < 0.001), but no intergroup difference over time was observed for pH, PaCO2, SIDa, or ATOT (P = 0.090, 0.537, 0.756 and 0.091, respectively). Arterial pH was significantly higher in the HES group than in the albumin group at T3 (P = 0.043), and arterial pH decreased significantly at T3 and T4 in the HES group (P = 0.002 and < 0.001, respectively) and at T2, T3, and T4 in the albumin group versus T1 (P = 0.011, < 0.001 and < 0.001, respectively). PaCO2 was significantly higher at T3 than at T1 in the albumin group (P = 0.024), and SIDa was significantly lower at T2, T3, and T4 than at T1 in both groups (P < 0.001, 0.007 and 0.008, respectively, in the HES group and all P values < 0.001 in the albumin group). ATOT was significantly lower in the HES group than in the albumin group at T2, T3, and T4 (P = 0.001, < 0.001 and < 0.001, respectively) and was significantly lower at these times than at T1 in both groups (all P < 0.001). SIDe was significantly lower in the HES group than in the albumin group at T2, T3 and T4 (P = 0.018, 0.002 and 0.011, respectively).

Changes in acid-base status during major abdominal surgery in patients that received 6% hydroxyethyl starch (the HES group, ○) or 5% albumin (the albumin group, ●). Error bars represent standard deviations. Numbers in the parenthesis are standard deviations. T1: 10 min after induction of anesthesia (before the start of HES or albumin administration), T2: 2 hours after starting surgery (after completing HES or albumin administration), T3: immediately after surgery, T4: 1 hour after arriving at a postanesthetic care unit. *P < 0.05, HES group vs. the albumin group; †P < 0.05 vs. T1.
Changes in the concentrations of unmeasured anions are summarized in Table 4. AGobserved, AGcorrected, and SIG exhibited no significant intergroup difference over time (P = 0.725, 0.335, and 0.297, respectively). AGobserved was significantly lower at T2 than at T1 in the HES and albumin groups (P = 0.001 and 0.002, respectively), but AGcorrected and SIG did not change significantly in either group.

Changes in Unmeasured Anions during Major Abdominal Surgery
Discussion
In this study, though we observed statistically lower arterial pH values at the end of surgery in the saline-based albumin group than in the BES-based HES group, neither colloid caused clinically significant metabolic acidosis (defined as an arterial pH of < 7.35).
The Stewart physicochemical approach suggests that HCO3− and hydrogen ion concentrations are dependent on three independent variables, that is, PaCO2, SID, and ATOT [9]. Changes in PaCO2 and/or SID lead to acute acid/base derangements, and hypoalbuminemia is associated with increases in pH and HCO3− concentration [10]. Of the colloids available for fluid resuscitation, starch and dextran have no intrinsic acidity, whereas gelatin and albumin are weakly acidic, and thus, acid/base derangements related to administered colloid type should be considered. Albumin-containing colloid is less likely to dilute serum albumin or reduce ATOT than HES. Thus, the administration of albumin presents higher risk of metabolic acidosis with a relatively higher ATOT as compared with the administration of HES [11], which is consistent with our results. In the present study, acid/base derangement and ATOT reduction were lower in the HES group than in the albumin group.
BES contains buffers that produce bicarbonate in vivo, and thus, reduces the risk of acidosis [12]. Earlier studies reported BES produces a more favorable acid/base balance than normal saline [13–15], and demonstrated higher Cl− loading achieved by large volume infusions of normal saline might aggravate hyperchloremic metabolic acidosis more so than BES infusion [14,15]. Normal saline has zero SID, which is lower than that of plasma, and thus, induces metabolic acidosis by reducing SID and metabolic alkalosis by diluting ATOT [16]. In the present study, salinebased 5% albumin caused metabolic acidosis, which concurs with previous reports [16,17], and although the ATOT decrease was significantly smaller in the albumin group than in the HES group, pH decreased significantly in both groups after surgery, which suggests that metabolic acidosis caused by a decrease in SIDa overrides the effect of ATOT dilutional alkalosis. In the present study, despite significant intergroup pH and ATOT differences, no intergroup difference was observed for SIDa. We infused ~2000 ml of the same crystalloid (Plasmalyte) and only 500 ml of colloids in both study groups. Differences in Cl− loading and buffer dilution by only 500 ml of colloid may have limited effects in view of the distribution volume of colloids in adults.
A previous clinical study demonstrated that cardiopulmonary bypass pump priming using 1500 ml of Plasmalyte did not change SIDa or Cl− [18]. However, in contrast to our expectations, SIDa significantly decreased at T2 versus T1 in both study groups, possibly because we observed downward trends in Na+, K+, Mg2+, and Ca2+, but upward trends in Cl− and lactate during surgery. Kim et al. [13] also reported an increase in Cl– during Plasmalyte infusion and showed a change in SIDa might result from complex changes in the concentrations of strong ions in plasma rather than changes in a specific ion.
In the present study, no significant group differences in AGobserved, AGcorrected, or SIG were observed at any time point. SIG is more sensitive at detecting unmeasured anions than AG when serum albumin and phosphate concentrations fluctuate, because anionic albumin and phosphate concentrations are included in its calculation [19]. In patients with hypoalbuminemia, albumincorrected AG, but not AGobserved, has been reported to be a good estimator of unmeasured anions [20,21]. Nevertheless, AGcorrected also provides a better approximation of acid-base status than SIG, because it does not count ions such as Mg2+, Ca2+, lactate−, and Pi− [22]. In view of the lack of data regarding the correlation among AGobserved, AGcorrected, and SIG during surgeries, clinical data from large cohort might help identify correlations between intraoperative AGobserved, AGcorrected, and SIG.
The present study has some limitations that warrant consideration. First, we did not consider the effects of bowel clearing agents. Only patients with preoperative serum creatinine and electrolyte levels in the normal range were included and those that took diuretics or laxatives were excluded. Although preoperative bowel preparation per se causes electrolyte abnormalities, we used polyethylene glycol, which is a nonabsorbable osmotic agent known to be safe even in patients with renal insufficiency that does not draw water osmotically into colon lumen like sodium phosphate solution [23]. Second, we limited colloid volume to 500 ml, which means infused colloid volume was < 1 ml/kg. Previous comparative clinical studies on the effects of different colloids on acid/base changes used 1,000–4,000 ml of colloids and observed remarkable differences [3,4,24]. We suggest further studies be conducted to determine volumes that minimize acid/base changes. Third, we adjusted respiratory rate according to end-tidal carbon dioxide tension but observed a significant change in PaCO2 in the albumin group. Accordingly, strict control of PaCO2 rather than end-tidal carbon dioxide tension may be necessary to enable the proper interpretation of arterial blood gases or estimate the metabolic component of acid-base imbalances. Lastly, although calculated using AGcorrected, the sample size of the present study was too small to elucidate acid-base changes in patients receiving much larger volume of colloids. Further larger-scale study might be needed to enable generalizations of results with greater precision and power. In addition, although the changes of the two study groups in PaCO2 and SIDa were not parallel and even crossed over time, no significant interactions between group and time were observed for pH, PaCO2, or SIDa. Further large-scale study might elucidate time and group interactions for these variables.
In conclusion, BES-based 6% HES infusion was found to be associated with lower arterial pH at the end of the surgery than saline-based 5% albumin infusion, but neither colloid caused clinically significant metabolic acidosis.