Introduction to systematic review and meta-analysis
Article information

Abstract
Systematic reviews and meta-analyses present results by combining and analyzing data from different studies conducted on similar research topics. In recent years, systematic reviews and meta-analyses have been actively performed in various fields including anesthesiology. These research methods are powerful tools that can overcome the difficulties in performing large-scale randomized controlled trials. However, the inclusion of studies with any biases or improperly assessed quality of evidence in systematic reviews and meta-analyses could yield misleading results. Therefore, various guidelines have been suggested for conducting systematic reviews and meta-analyses to help standardize them and improve their quality. Nonetheless, accepting the conclusions of many studies without understanding the meta-analysis can be dangerous. Therefore, this article provides an easy introduction to clinicians on performing and understanding meta-analyses.
Introduction
A systematic review collects all possible studies related to a given topic and design, and reviews and analyzes their results [1]. During the systematic review process, the quality of studies is evaluated, and a statistical meta-analysis of the study results is conducted on the basis of their quality. A meta-analysis is a valid, objective, and scientific method of analyzing and combining different results. Usually, in order to obtain more reliable results, a meta-analysis is mainly conducted on randomized controlled trials (RCTs), which have a high level of evidence [2] (Fig. 1). Since 1999, various papers have presented guidelines for reporting meta-analyses of RCTs. Following the Quality of Reporting of Meta-analyses (QUORUM) statement [3], and the appearance of registers such as Cochrane Library’s Methodology Register, a large number of systematic literature reviews have been registered. In 2009, the Preferred Reporting Items for Systematic Reviews and Meta-Analyses (PRISMA) statement [4] was published, and it greatly helped standardize and improve the quality of systematic reviews and meta-analyses [5].

Levels of evidence.
In anesthesiology, the importance of systematic reviews and meta-analyses has been highlighted, and they provide diagnostic and therapeutic value to various areas, including not only perioperative management but also intensive care and outpatient anesthesia [6–13]. Systematic reviews and meta-analyses include various topics, such as comparing various treatments of postoperative nausea and vomiting [14,15], comparing general anesthesia and regional anesthesia [16–18], comparing airway maintenance devices [8,19], comparing various methods of postoperative pain control (e.g., patient-controlled analgesia pumps, nerve block, or analgesics) [20–23], comparing the precision of various monitoring instruments [7], and meta-analysis of dose-response in various drugs [12].
Thus, literature reviews and meta-analyses are being conducted in diverse medical fields, and the aim of highlighting their importance is to help better extract accurate, good quality data from the flood of data being produced. However, a lack of understanding about systematic reviews and meta-analyses can lead to incorrect outcomes being derived from the review and analysis processes. If readers indiscriminately accept the results of the many meta-analyses that are published, incorrect data may be obtained. Therefore, in this review, we aim to describe the contents and methods used in systematic reviews and meta-analyses in a way that is easy to understand for future authors and readers of systematic review and meta-analysis.
Study Planning
It is easy to confuse systematic reviews and meta-analyses. A systematic review is an objective, reproducible method to find answers to a certain research question, by collecting all available studies related to that question and reviewing and analyzing their results. A meta-analysis differs from a systematic review in that it uses statistical methods on estimates from two or more different studies to form a pooled estimate [1]. Following a systematic review, if it is not possible to form a pooled estimate, it can be published as is without progressing to a meta-analysis; however, if it is possible to form a pooled estimate from the extracted data, a meta-analysis can be attempted. Systematic reviews and meta-analyses usually proceed according to the flowchart presented in Fig. 2. We explain each of the stages below.
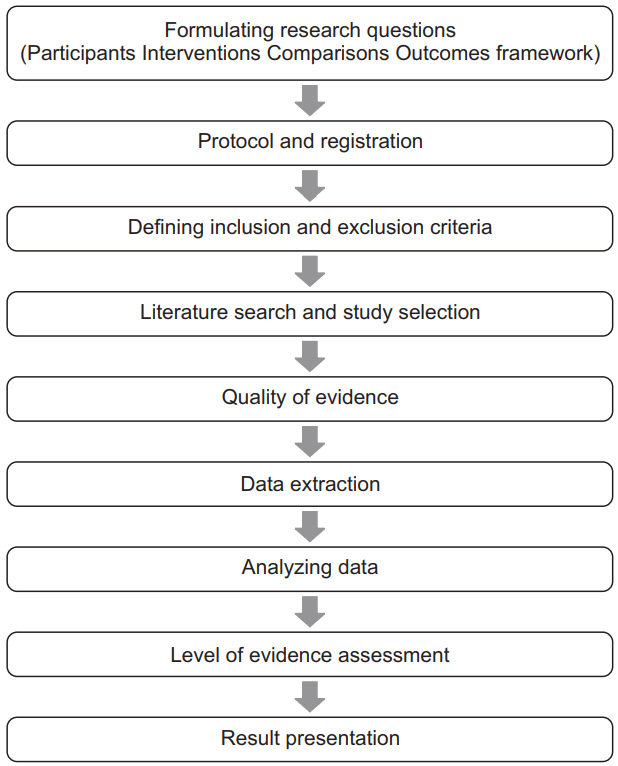
Flowchart illustrating a systematic review.
Formulating research questions
A systematic review attempts to gather all available empirical research by using clearly defined, systematic methods to obtain answers to a specific question. A meta-analysis is the statistical process of analyzing and combining results from several similar studies. Here, the definition of the word “similar” is not made clear, but when selecting a topic for the meta-analysis, it is essential to ensure that the different studies present data that can be combined. If the studies contain data on the same topic that can be combined, a meta-analysis can even be performed using data from only two studies. However, study selection via a systematic review is a precondition for performing a meta-analysis, and it is important to clearly define the Population, Intervention, Comparison, Outcomes (PICO) parameters that are central to evidence-based research. In addition, selection of the research topic is based on logical evidence, and it is important to select a topic that is familiar to readers without clearly confirmed the evidence [24].
Protocols and registration
In systematic reviews, prior registration of a detailed research plan is very important. In order to make the research process transparent, primary/secondary outcomes and methods are set in advance, and in the event of changes to the method, other researchers and readers are informed when, how, and why. Many studies are registered with an organization like PROSPERO (http://www.crd.york.ac.uk/PROSPERO/), and the registration number is recorded when reporting the study, in order to share the protocol at the time of planning.
Defining inclusion and exclusion criteria
Information is included on the study design, patient characteristics, publication status (published or unpublished), language used, and research period. If there is a discrepancy between the number of patients included in the study and the number of patients included in the analysis, this needs to be clearly explained while describing the patient characteristics, to avoid confusing the reader.
Literature search and study selection
In order to secure proper basis for evidence-based research, it is essential to perform a broad search that includes as many studies as possible that meet the inclusion and exclusion criteria. Typically, the three bibliographic databases Medline, Embase, and Cochrane Central Register of Controlled Trials (CENTRAL) are used. In domestic studies, the Korean databases KoreaMed, KMBASE, and RISS4U may be included. Effort is required to identify not only published studies but also abstracts, ongoing studies, and studies awaiting publication. Among the studies retrieved in the search, the researchers remove duplicate studies, select studies that meet the inclusion/exclusion criteria based on the abstracts, and then make the final selection of studies based on their full text. In order to maintain transparency and objectivity throughout this process, study selection is conducted independently by at least two investigators. When there is a inconsistency in opinions, intervention is required via debate or by a third reviewer. The methods for this process also need to be planned in advance. It is essential to ensure the reproducibility of the literature selection process [25].
Quality of evidence
However, well planned the systematic review or meta-analysis is, if the quality of evidence in the studies is low, the quality of the meta-analysis decreases and incorrect results can be obtained [26]. Even when using randomized studies with a high quality of evidence, evaluating the quality of evidence precisely helps determine the strength of recommendations in the meta-analysis. One method of evaluating the quality of evidence in non-randomized studies is the Newcastle-Ottawa Scale, provided by the Ottawa Hospital Research Institute1). However, we are mostly focusing on meta-analyses that use randomized studies.
If the Grading of Recommendations, Assessment, Development and Evaluations (GRADE) system (http://www.gradeworkinggroup.org/) is used, the quality of evidence is evaluated on the basis of the study limitations, inaccuracies, incompleteness of outcome data, indirectness of evidence, and risk of publication bias, and this is used to determine the strength of recommendations [27]. As shown in Table 1, the study limitations are evaluated using the “risk of bias” method proposed by Cochrane2). This method classifies bias in randomized studies as “low,” “high,” or “unclear” on the basis of the presence or absence of six processes (random sequence generation, allocation concealment, blinding participants or investigators, incomplete outcome data, selective reporting, and other biases) [28].

Data extraction
Two different investigators extract data based on the objectives and form of the study; thereafter, the extracted data are reviewed. Since the size and format of each variable are different, the size and format of the outcomes are also different, and slight changes may be required when combining the data [29]. If there are differences in the size and format of the outcome variables that cause difficulties combining the data, such as the use of different evaluation instruments or different evaluation timepoints, the analysis may be limited to a systematic review. The investigators resolve differences of opinion by debate, and if they fail to reach a consensus, a third-reviewer is consulted.
Data Analysis
The aim of a meta-analysis is to derive a conclusion with increased power and accuracy than what could not be able to achieve in individual studies. Therefore, before analysis, it is crucial to evaluate the direction of effect, size of effect, homogeneity of effects among studies, and strength of evidence [30]. Thereafter, the data are reviewed qualitatively and quantitatively. If it is determined that the different research outcomes cannot be combined, all the results and characteristics of the individual studies are displayed in a table or in a descriptive form; this is referred to as a qualitative review. A meta-analysis is a quantitative review, in which the clinical effectiveness is evaluated by calculating the weighted pooled estimate for the interventions in at least two separate studies.
The pooled estimate is the outcome of the meta-analysis, and is typically explained using a forest plot (Figs. 3 and 4). The black squares in the forest plot are the odds ratios (ORs) and 95% confidence intervals in each study. The area of the squares represents the weight reflected in the meta-analysis. The black diamond represents the OR and 95% confidence interval calculated across all the included studies. The bold vertical line represents a lack of therapeutic effect (OR = 1); if the confidence interval includes OR = 1, it means no significant difference was found between the treatment and control groups.
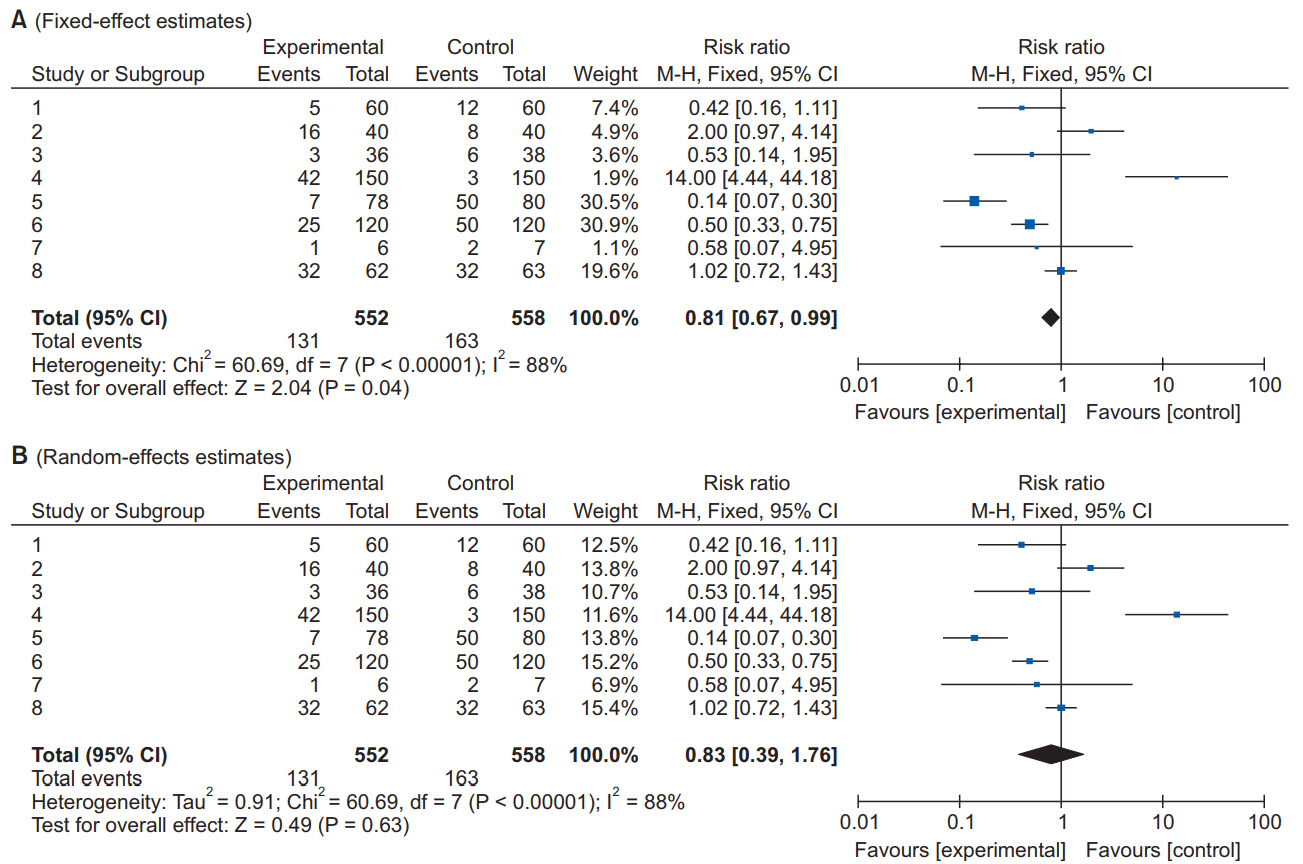
Forest plot analyzed by two different models using the same data. (A) Fixed-effect model. (B) Random-effect model. The figure depicts individual trials as filled squares with the relative sample size and the solid line as the 95% confidence interval of the difference. The diamond shape indicates the pooled estimate and uncertainty for the combined effect. The vertical line indicates the treatment group shows no effect (OR = 1). Moreover, if the confidence interval includes 1, then the result shows no evidence of difference between the treatment and control groups.

Forest plot representing homogeneous data.
Dichotomous variables and continuous variables
In data analysis, outcome variables can be considered broadly in terms of dichotomous variables and continuous variables. When combining data from continuous variables, the mean difference (MD) and standardized mean difference (SMD) are used (Table 2).

The MD is the absolute difference in mean values between the groups, and the SMD is the mean difference between groups divided by the standard deviation. When results are presented in the same units, the MD can be used, but when results are presented in different units, the SMD should be used. When the MD is used, the combined units must be shown. A value of “0” for the MD or SMD indicates that the effects of the new treatment method and the existing treatment method are the same. A value lower than “0” means the new treatment method is less effective than the existing method, and a value greater than “0” means the new treatment is more effective than the existing method.
When combining data for dichotomous variables, the OR, risk ratio (RR), or risk difference (RD) can be used. The RR and RD can be used for RCTs, quasi-experimental studies, or cohort studies, and the OR can be used for other case-control studies or cross-sectional studies. However, because the OR is difficult to interpret, using the RR and RD, if possible, is recommended. If the outcome variable is a dichotomous variable, it can be presented as the number needed to treat (NNT), which is the minimum number of patients who need to be treated in the intervention group, compared to the control group, for a given event to occur in at least one patient. Based on Table 3, in an RCT, if x is the probability of the event occurring in the control group and y is the probability of the event occurring in the intervention group, then x = c/(c + d), y = a/(a + b), and the absolute risk reduction (ARR) = x − y. NNT can be obtained as the reciprocal, 1/ARR.

Calculation of the Number Needed to Treat in the Dichotomous table
Fixed-effect models and random-effect models
In order to analyze effect size, two types of models can be used: a fixed-effect model or a random-effect model. A fixed-effect model assumes that the effect of treatment is the same, and that variation between results in different studies is due to random error. Thus, a fixed-effect model can be used when the studies are considered to have the same design and methodology, or when the variability in results within a study is small, and the variance is thought to be due to random error. Three common methods are used for weighted estimation in a fixed-effect model: 1) inverse variance-weighted estimation3), 2) Mantel-Haenszel estimation4), and 3) Peto estimation5).
A random-effect model assumes heterogeneity between the studies being combined, and these models are used when the studies are assumed different, even if a heterogeneity test does not show a significant result. Unlike a fixed-effect model, a random-effect model assumes that the size of the effect of treatment differs among studies. Thus, differences in variation among studies are thought to be due to not only random error but also between-study variability in results. Therefore, weight does not decrease greatly for studies with a small number of patients. Among methods for weighted estimation in a random-effect model, the DerSimonian and Laird method6) is mostly used for dichotomous variables, as the simplest method, while inverse variance-weighted estimation is used for continuous variables, as with fixed-effect models. These four methods are all used in Review Manager software (The Cochrane Collaboration, UK), and are described in a study by Deeks et al. [31] (Table 2). However, when the number of studies included in the analysis is less than 10, the Hartung-Knapp-Sidik-Jonkman method7) can better reduce the risk of type 1 error than does the DerSimonian and Laird method [32].
Fig. 3 shows the results of analyzing outcome data using a fixed-effect model (A) and a random-effect model (B). As shown in Fig. 3, while the results from large studies are weighted more heavily in the fixed-effect model, studies are given relatively similar weights irrespective of study size in the random-effect model. Although identical data were being analyzed, as shown in Fig. 3, the significant result in the fixed-effect model was no longer significant in the random-effect model. One representative example of the small study effect in a random-effect model is the meta-analysis by Li et al. [33]. In a large-scale study, intravenous injection of magnesium was unrelated to acute myocardial infarction, but in the random-effect model, which included numerous small studies, the small study effect resulted in an association being found between intravenous injection of magnesium and myocardial infarction. This small study effect can be controlled for by using a sensitivity analysis, which is performed to examine the contribution of each of the included studies to the final meta-analysis result. In particular, when heterogeneity is suspected in the study methods or results, by changing certain data or analytical methods, this method makes it possible to verify whether the changes affect the robustness of the results, and to examine the causes of such effects [34].
Heterogeneity
Homogeneity test is a method whether the degree of heterogeneity is greater than would be expected to occur naturally when the effect size calculated from several studies is higher than the sampling error. This makes it possible to test whether the effect size calculated from several studies is the same. Three types of homogeneity tests can be used: 1) forest plot, 2) Cochrane’s Q test (chi-squared), and 3) Higgins I2 statistics. In the forest plot, as shown in Fig. 4, greater overlap between the confidence intervals indicates greater homogeneity. For the Q statistic, when the P value of the chi-squared test, calculated from the forest plot in Fig. 4, is less than 0.1, it is considered to show statistical heterogeneity and a random-effect can be used. Finally, I2 can be used [35].
I2, calculated as shown above, returns a value between 0 and 100%. A value less than 25% is considered to show strong homogeneity, a value of 50% is average, and a value greater than 75% indicates strong heterogeneity.
Even when the data cannot be shown to be homogeneous, a fixed-effect model can be used, ignoring the heterogeneity, and all the study results can be presented individually, without combining them. However, in many cases, a random-effect model is applied, as described above, and a subgroup analysis or meta-regression analysis is performed to explain the heterogeneity. In a subgroup analysis, the data are divided into subgroups that are expected to be homogeneous, and these subgroups are analyzed. This needs to be planned in the predetermined protocol before starting the meta-analysis. A meta-regression analysis is similar to a normal regression analysis, except that the heterogeneity between studies is modeled. This process involves performing a regression analysis of the pooled estimate for covariance at the study level, and so it is usually not considered when the number of studies is less than 10. Here, univariate and multivariate regression analyses can both be considered.
Publication bias
Publication bias is the most common type of reporting bias in meta-analyses. This refers to the distortion of meta-analysis outcomes due to the higher likelihood of publication of statistically significant studies rather than non-significant studies. In order to test the presence or absence of publication bias, first, a funnel plot can be used (Fig. 5). Studies are plotted on a scatter plot with effect size on the x-axis and precision or total sample size on the y-axis. If the points form an upside-down funnel shape, with a broad base that narrows towards the top of the plot, this indicates the absence of a publication bias (Fig. 5A) [29,36]. On the other hand, if the plot shows an asymmetric shape, with no points on one side of the graph, then publication bias can be suspected (Fig. 5B). Second, to test publication bias statistically, Begg and Mazumdar’s rank correlation test8) [37] or Egger’s test9) [29] can be used. If publication bias is detected, the trim-and-fill method10) can be used to correct the bias [38]. Fig. 6 displays results that show publication bias in Egger’s test, which has then been corrected using the trim-and-fill method using Comprehensive Meta-Analysis software (Biostat, USA).
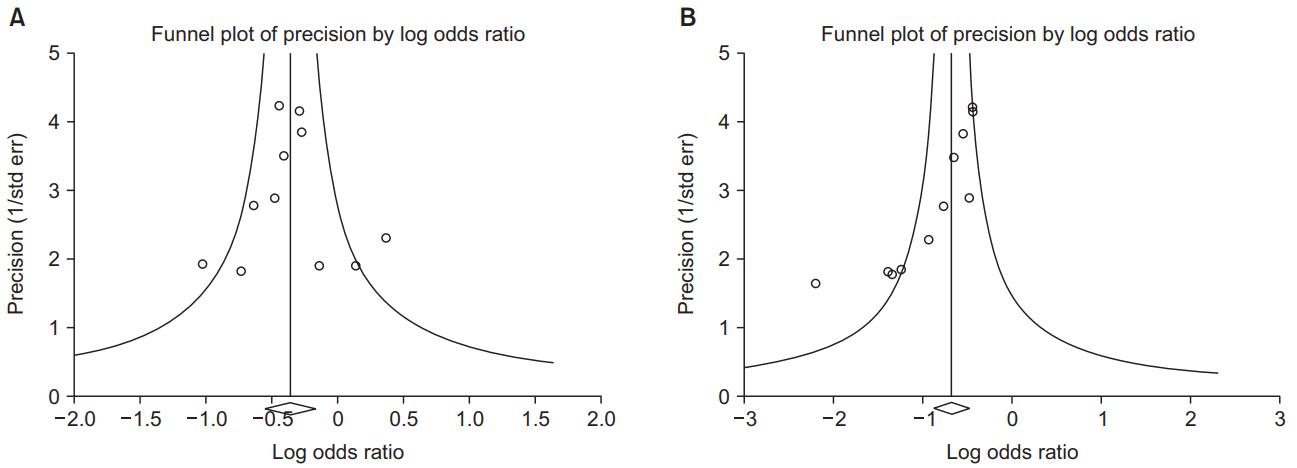
Funnel plot showing the effect size on the x-axis and sample size on the y-axis as a scatter plot. (A) Funnel plot without publication bias. The individual plots are broader at the bottom and narrower at the top. (B) Funnel plot with publication bias. The individual plots are located asymmetrically.
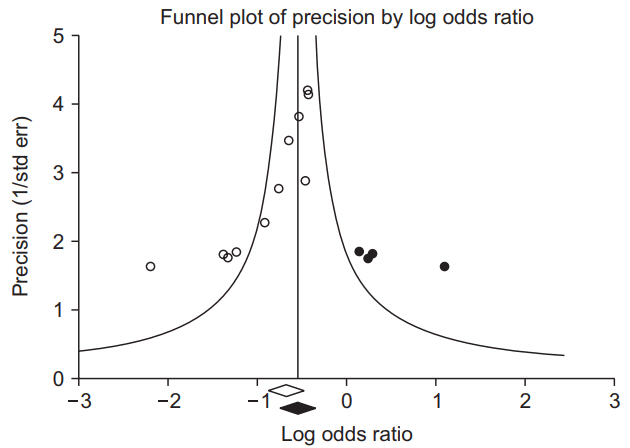
Funnel plot adjusted using the trim-and-fill method. White circles: comparisons included. Black circles: inputted comparisons using the trim-and-fill method. White diamond: pooled observed log risk ratio. Black diamond: pooled inputted log risk ratio.
Result Presentation
When reporting the results of a systematic review or meta-analysis, the analytical content and methods should be described in detail. First, a flowchart is displayed with the literature search and selection process according to the inclusion/exclusion criteria. Second, a table is shown with the characteristics of the included studies. A table should also be included with information related to the quality of evidence, such as GRADE (Table 4). Third, the results of data analysis are shown in a forest plot and funnel plot. Fourth, if the results use dichotomous data, the NNT values can be reported, as described above.

The GRADE Evidence Quality for Each Outcome
When Review Manager software (The Cochrane Collaboration, UK) is used for the analysis, two types of P values are given. The first is the P value from the z-test, which tests the null hypothesis that the intervention has no effect. The second P value is from the chi-squared test, which tests the null hypothesis for a lack of heterogeneity. The statistical result for the intervention effect, which is generally considered the most important result in meta-analyses, is the z-test P value.
A common mistake when reporting results is, given a z-test P value greater than 0.05, to say there was “no statistical significance” or “no difference.” When evaluating statistical significance in a meta-analysis, a P value lower than 0.05 can be explained as “a significant difference in the effects of the two treatment methods.” However, the P value may appear non-significant whether or not there is a difference between the two treatment methods. In such a situation, it is better to announce “there was no strong evidence for an effect,” and to present the P value and confidence intervals. Another common mistake is to think that a smaller P value is indicative of a more significant effect. In meta-analyses of large-scale studies, the P value is more greatly affected by the number of studies and patients included, rather than by the significance of the results; therefore, care should be taken when interpreting the results of a meta-analysis.
Conclusion
When performing a systematic literature review or meta-analysis, if the quality of studies is not properly evaluated or if proper methodology is not strictly applied, the results can be biased and the outcomes can be incorrect. However, when systematic reviews and meta-analyses are properly implemented, they can yield powerful results that could usually only be achieved using large-scale RCTs, which are difficult to perform in individual studies. As our understanding of evidence-based medicine increases and its importance is better appreciated, the number of systematic reviews and meta-analyses will keep increasing. However, indiscriminate acceptance of the results of all these meta-analyses can be dangerous, and hence, we recommend that their results be received critically on the basis of a more accurate understanding.
Notes
The inverse variance-weighted estimation method is useful if the number of studies is small with large sample sizes.
The Mantel-Haenszel estimation method is useful if the number of studies is large with small sample sizes.
The Peto estimation method is useful if the event rate is low or one of the two groups shows zero incidence.
The most popular and simplest statistical method used in Review Manager and Comprehensive Meta-analysis software.
Alternative random-effect model meta-analysis that has more adequate error rates than does the common DerSimonian and Laird method, especially when the number of studies is small. However, even with the Hartung-Knapp-Sidik-Jonkman method, when there are less than five studies with very unequal sizes, extra caution is needed.
The Begg and Mazumdar rank correlation test uses the correlation between the ranks of effect sizes and the ranks of their variances [37].
The degree of funnel plot asymmetry as measured by the intercept from the regression of standard normal deviates against precision [29].
If there are more small studies on one side, we expect the suppression of studies on the other side. Trimming yields the adjusted effect size and reduces the variance of the effects by adding the original studies back into the analysis as a mirror image of each study.