Introduction
Postoperative hyperbilirubinemia occurs frequently following surgery and is associated with a poor outcome [1]. Total bilirubin consists of direct bilirubin (D-Bil) and indirect bilirubin (I-Bil). Increased D-Bil is associated with hepatocyte excretory dysfunction, including hypoxic hepatocyte injury, sepsis-associated cholestasis, and drug-induced liver injury [2]. In contrast, increased I-Bil is related to various other conditions, including hemolysis and blood transfusion reaction [3]. These different pathophysiologies suggest that D-Bil and I-Bil may have different associations with clinical outcome [4,5].
Postoperative organ dysfunction is a significant outcome in patients requiring surgery, and anesthesiologists should therefore take steps to prevent and treat this. Definitions of different types of acute organ dysfunction have been proposed and are widely used, including postoperative acute kidney injury [6], acute respiratory dysfunction [7], and delirium [8]. A number of interventional studies have been conducted regarding the prevention and treatment of these clearly defined types of acute organ dysfunction. However, there is still no clear definition of postoperative liver dysfunction. Bilirubin level has been considered as a surrogate marker of liver dysfunction. However, there have been few studies regarding the associations of postoperative D-Bil and I-Bil with outcome. Therefore, we conducted a retrospective study to compare the associations of postoperative D-Bil and I-Bil with outcomes in postoperative critically ill patients.
Materials and Methods
This was a single-center retrospective observational study comparing the associations between D-Bil and I-Bil measured at postoperative days (POD) 1 and 2 and clinical outcomes in postoperative critically ill patients. The Kobe University Hospital Ethics Committee approved this study and waived the need for informed consent for studies involving the use of the database. The study was performed in accordance with the principles outlined in the Declaration of Helsinki.
Participants and patient characteristics
We screened all adult patients that underwent surgery under general anesthesia at our institution between 2008 and 2013. Our inclusion criterion was the requirement for postoperative intensive care for more than 48 hours. To eliminate the confounding effect of higher preoperative bilirubin levels, we excluded patients with preoperative T-Bil level > 1 mg/dl, as this is considered the upper normal limit at our institution. We also excluded patients undergoing hepatic surgery and those with an American Society of Anesthesiologists-Physical Status (ASA-PS) score Ōēź 5. Patient characteristics, including age, sex, ASA-PS score, length of intensive care unit (ICU) stay, length of hospital stay, elective or emergency surgery, and type of surgery, were obtained. Preoperative T-Bil and hepatic enzyme levels [alanine transaminase (ALT) and aspartate transaminase (AST)] were obtained. We also obtained the Acute Physiology and Chronic Health Evaluation (APACHE) II score for patients in whom reliable information was available for its calculation.
Measurement of postoperative bilirubin levels
We obtained D-Bil and I-Bil levels measured at 06:00 on PODs 1 and 2. D-Bil and I-Bil levels at our institution are measured by enzymatic assay of bilirubin oxidase (IATRO T-BILŌäó and IATRO D-BILŌäó, respectively; LSI Medience Corp., Tokyo, Japan). The normal ranges of D-Bil and I-Bil are Ōēż 0.2 mg/dl and Ōēż 0.7 mg/dl, respectively.
Outcomes
The primary outcome was defined as postoperative hospital mortality, with the number of ICU-free survival days (IFSD) at POD 28 as the secondary outcome. Discharge from ICU was at the discretion of the attending physician when the patient's physiological status had stabilized and the patient was free from the following: 1) the requirement for mechanical ventilation or risk of reintubation; 2) hemodynamic instability; and 3) the requirement for renal replacement therapy.
We obtained information on the proximate cause of death. In accordance with a previous study [9], we used five cause-of-death categories: (1) neurological (traumatic and nontraumatic brain injury, both with and without brain death); (2) cardiovascular (arrhythmia, cardiogenic shock, distributive [septic] shock, and hypovolemic shock); (3) respiratory (hypoxic respiratory failure); (4) liver-related (liver failure); and (5) other.
Statistical analysis
Data are presented as percentages (n/valid cases) or as the median (25% quartile, 75% quartile). Comparisons between two groups were performed using the Mann-Whitney U test and chi-square test.
For primary comparisons, we compared D-Bil and I-Bil levels at PODs 1 and 2 between survivors and non-survivors. To calculate the sample size for the present study, we considered a difference of 40% in the standard deviation for D-Bil and I-Bil levels to be meaningful. Assuming a postoperative hospital mortality rate of 2.5%, a power of 0.90, and an ╬▒ level of 0.05, approximately 1,900 participants were required. As approximately 13% of adult postoperative patients require postoperative intensive care for more than 48 hours, and 40% of patients were at risk of exclusion according to our exclusion criteria, we planned to screen approximately 23,000 adult postoperative patients. As the study site performed 4,000 operations requiring general anesthesia per year, and a reliable dataset was available before 2013, the study period was set from 2008 to 2013.
To confirm the independent associations between D-Bil and I-Bil levels and mortality, we performed multivariate logistic analysis using postoperative mortality as a dependent variable, and age, ASA-PS, operation category, emergency operation, D-Bil, and I-Bil levels as independent variables. Adjusted odds ratios (ORs) are presented with 95% CI.
As the relationship between postoperative bilirubin level and outcome may not be linear, we further subdivided patients according to the upper limits of the bilirubin level and compared outcomes among the following subgroups: Normal, within the normal range (D-Bil Ōēż 0.2 mg/dl, I-Bil Ōēż 0.7 mg/dl); Mild hyper D-Bil or I-Bil, 1*upper limitŌĆō2*upper limit (0.2 mg/dl < D-Bil Ōēż 0.4 mg/dl, 0.7 mg/dl < I-Bil Ōēż 1.4 mg/dl); and Moderate hyper D-Bil or I-Bil, > 2*upper limit (0.4 mg/dl < D-Bil, 1.4 mg/dl < I-Bil). We also performed a multivariate logistic analysis of hospital mortality using mild and moderate hyper D-Bil or I-Bil as dependent variables, and a multivariate linear regression analysis using IFSD at POD 28 days as the dependent variable.
Statistical analyses were performed using R software (ver. 3.2.2; R Development Core Team, Vienna, Austria). In all analyses, P < 0.05 was taken to indicate statistical significance. Data are reported in accordance with the Strengthening the Reporting of Observational Studies in Epidemiology (STROBE) guidelines.
Results
Study flow
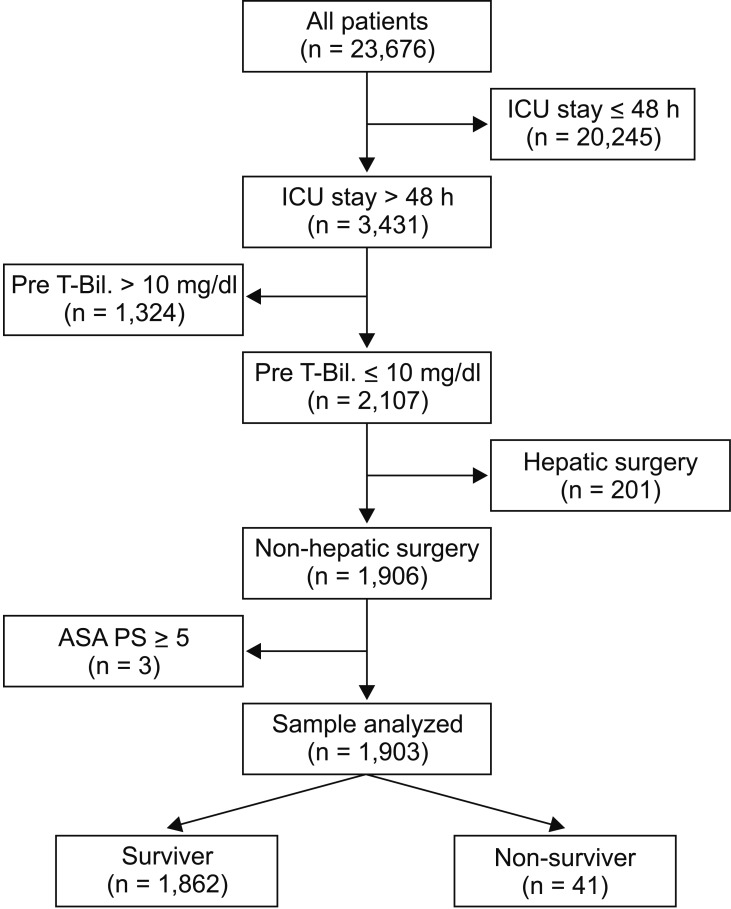
A total of 23,676 adult patients underwent surgery under general anesthesia during the study period. Among them, 3,431 patients remained in the ICU for more than 48 hours. Patients with a preoperative T-Bil level > 1 mg/dl (n = 1,324), those undergoing hepatic surgery (n = 201), and patients with an ASA-PS Ōēź 5 were excluded. The remaining 1,903 patients were included in the study (Fig. 1).
Possible confounders
Among the 1,903 patients included in the study, 41 did not survive (mortality = 2.2%). Table 1 shows the proximate cause of death in non-survivors. Table 2 shows a comparison of patient characteristics between survivors and non-survivors. Non-survivors had significantly higher ASA-PS scores and a greater likelihood of emergency surgery compared with survivors. There was no significant difference in age, gender, or operation site between the two groups. The preoperative T-Bil level in non-survivors had a median value of 0.6 (0.4, 0.7) mg/dl, which was not significantly different from the value of 0.6 (0.4, 0.7) mg/dl observed in survivors (P = 0.481). Preoperative AST and ALT levels were not significantly different between non-survivors and survivors (AST, 19 [15, 25] vs. 20 [14, 30] unit/l, P = 0.731; ALT, 15 [10, 24] vs. 15 [8, 25] unit/l, P = 0.799). The APACHE II score was obtained in 1,072 of 1,903 patients, including 1,031 patients among the 1,862 survivors (55.4%) and all 41 of the 41 non-survivors (100%). The APACHE II score was significantly higher in non-survivors than survivors (P = 0.009).
Comparison of D-Bil and I-Bil levels between survivors and non-survivors
Table 3 shows a comparison of the D-Bil and I-Bil levels between survivors and non-survivors. D-Bil at POD 1 in non-survivors was significantly higher than in survivors (P = 0.001), but no such relation was observed for I-Bil at POD 1 (P = 0.209). D-Bil and I-Bil at POD 2 were significantly higher in non-survivors than survivors (D-Bi: P < 0.001, I-Bil: P = 0.013).
After adjusting for predefined confounders in multivariate logistic analysis, we found that a higher D-Bil was independently associated with an increase in postoperative mortality (POD 1: adjusted OR = 2.32 (1.61, 3.34), P < 0.001; POD 2: 1.95 (1.45, 2.62), P < 0.001), but no such relation was observed for I-Bil (POD 1: P = 0.913; POD 2: P = 0.209) (Table 4). These results did not change even after adjusting for the APACHE II score.
We also performed a categorical analysis. At POD 1, mild increases in D-Bil and I-Bil levels were observed in 175 (9.2%) and 839 (44.1%) patients, respectively. Moderate increases in D-Bil and I-Bil levels at POD 1 were seen in 202 (10.6%) and 287 (15.1%) patients, respectively. The numbers of patients with mild or moderate hyper D-Bil and I-Bil decreased at POD 2 (D-Bil: mild, n = 136 [7.1%]; moderate, n = 143 [7.5%]; I-Bil: mild, n = 676 [35.5%]; moderate, n = 134 [7.0%]). Table 5 shows the adjusted ORs of mild and moderate hyper D-Bil and I-Bil for postoperative mortality. Mild and moderate increases in D-Bil levels were independently associated with increased postoperative mortality compared to D-Bil levels within the normal range (Mild at POD 1: adjusted OR = 2.62 [1.00, 6.84], P = 0.049; Mild at POD 2: 3.25 [1.23, 8.56], P = 0.017; Moderate at POD 1: 3.86 [1.70, 8.74], P = 0.001; Moderate at POD 2: 4.53 [1.92, 10.7], P < 0.001), but no such relations were observed for I-Bil (Mild: POD 1, P = 0.986; POD 2, P = 0.251; Moderate: POD 1, P = 0.729; POD 2, P = 0.137).
We further performed a multivariate linear regression analysis using IFSD as the dependent variable. The increase in D-Bil level was independently associated with decreased IFSD (POD 1: adjusted coefficient = ŌłÆ1.54, P < 0.001; POD 2: ŌłÆ1.84, P < 0.001). In contrast, the increase in I-Bil at POD 1 was independently associated with increased IFSD (adjusted coefficient = 0.39, P = 0.021) (Table 6).
Discussion
Key findings
In this retrospective observational study comparing the associations between D-Bil and I-Bil levels and postoperative outcomes, we found that the D-Bil level had a more robust association with poorer outcomes (increased postoperative mortality and decreased IFSD) than I-Bil. This study is novel as there have been no previous reports regarding the associations between increases in D-Bil and I-Bil levels in the early postoperative period and postoperative outcomes.
Comparison with previous studies
In the critical care setting, there have been few studies comparing the associations of D-Bil and I-Bil levels with outcomes. Pineda et al. [5] performed a prospective observational study to assess the associations of total and D-Bil levels with the clinical presentation and outcomes in 743 patients hospitalized with ischemic stroke. They concluded that a higher D-Bil level was associated with greater stroke severity. Wu et al. [4] performed a prospective observational study to assess the associations between D-Bil and I-Bil levels and mortality in 162 patients with enteric fistula-related abdominal sepsis. They reported that the ability of D-Bil, on day 7 after admission, to predict a poor outcome was superior to that of I-Bil. Although our findings were consistent with previous studies, this was the first analysis conducted in critically ill postoperative patients to assess the associations between early increases in D-Bil and I-Bil levels during the ICU stay and outcome.
Implications
Hyperbilirubinemia, or jaundice, is commonly seen in the ICU, with incidence rates of up to 40% among critically ill patients [10]. A higher total bilirubin level is associated with greater severity of illness, and therefore also with poorer outcomes. Bilirubin is the breakdown product of hemoglobin [11]. Within hepatocytes, I-Bil becomes D-Bil and flows into the bile across the hepatocyte canalicular membrane. Thus, elevation of I-Bil is related to various conditions, including hemolysis and blood transfusion reaction [11]. In the present study, increased I-Bil was common, with a rate of 59.2% at POD 1. However, even a moderate increase in I-Bil was not independently associated with postoperative mortality. Furthermore, I-Bil at POD 1 was independently associated with increased IFSD. As this was a retrospective observational study, we could not assess causality. Therefore, our findings regarding the association of I-Bil with IFSD do not imply a protective role of I-Bil. Indeed, I-Bil should be considered as the more toxic form of bilirubin [12], and less protective than D-Bil [13]. As the main focus of the present study was to compare the associations of postoperative I-Bil and D-Bil levels with the clinical outcome, we were not able to assess the etiologies of increased I-Bil in detail. Further studies are necessary to confirm or refute our findings regarding the association between the postoperative I-Bil level and outcome.
Postoperative hepatic dysfunction or bile duct occlusion may be one reason for an elevated D-Bil level. In the present study, even a mild increase in D-Bil at POD 1 was independently associated with a poorer outcome. As mentioned above, our findings do not imply a harmful role of D-Bil. Kim et al. [13] reported that bilirubin nanoparticles consisting of polyethylene glycol-conjugated bilirubin protected against hepatic ischemia-reperfusion injury in the liver by preventing oxidative stress. Our findings suggest that for prediction of poor outcomes in postoperative critically ill patients, D-Bil may have higher predictive capability than I-Bil, as shown by previous studies done in various settings, and including neonates [14] and acute liver disease [15,16], cardiac transplantation [17], stroke [5], and sepsis patients [4].
Strengths and limitations
This is the first study to assess the associations between D-Bil and I-Bil levels and the clinical outcome in critically ill postoperative patients. However, our study had several limitations. First, it used a retrospective design and was therefore potentially subject to systematic error and bias. However, D-Bil and I-Bil levels can be measured objectively and stored electronically at the time of collection, and are also verifiable. Furthermore, the outcome was robust (death) and unlikely to have been entered incorrectly. Second, the study was conducted in one center and the results may not be generalizable. Third, as the mortality was low, the study may have been underpowered. However, we determined the number of patients required using a power calculation, and therefore the risk of type I error was low. Finally, we could not obtain information on the patients' demographics. These characteristics are likely to modulate the predictive capability of bilirubin indices and future studies should focus on their associations. Nonetheless, it is important to note that we focused on a relative comparison between D-Bil and I-Bil levels, rather than on their absolute impact on the outcome.
The present study indicated that the D-Bil level has a more robust association with poor outcome (increased postoperative mortality and decreased IFSD compared with the I-Bil level. Future studies are required to refute or confirm our findings.