Ultrasound measurement of the vertebral level of Tuffier's line in elderly women
Article information

Abstract
Background
It would be imprecise to generalize the vertebral level determined by palpation to patients of all ages. The purpose of this study was to compare the vertebral level passed by Tuffier's line in elderly women with that passed in adult women using ultrasound in the left lateral decubitus flexed position.
Methods
We enrolled 50 female patients over the age of 65 (elderly group) and 50 female patients between ages 20 and 50 (control group) who had been scheduled to undergo spinal anesthesia. Using ultrasound, we marked the L2–5 lumbar spinous processes and intervertebral spaces. The most cephalad part was labeled 1 and the most caudal part was labeled 11. We then identified which line of these vertebral levels Tuffier's line crossed.
Results
The median value of the numbers signifying the vertebral level of Tuffier's line was 3 (the L2–3 intervertebral space) in the elderly group, while it was 8 (the lower part of the L4 vertebra) in the control group. The vertebral level of Tuffier's line had statistically significant correlations with age, body mass index, and weight in the elderly group (P < 0.001).
Conclusions
The vertebral level of Tuffier's line determined with ultrasound measurement in the left lateral decubitus flexed position was more cephalad in the elderly women than in those of the control group. Therefore, we should consider that the needle could be inserted at a higher level than expected, and use care in determining the level of needle insertion during spinal anesthesia in elderly women.
Introduction
As life expectancy increases, the number of elderly patients undergoing surgical procedures is growing. For urological or orthopedic surgeries, spinal anesthesia is widely used. In order to safely conduct spinal anesthesia, it is important to identify the appropriate points for needle insertion. Tuffier's line, which is a horizontal line that connects the highest points of the iliac crests, is an important marker to determine the puncture level. In adults, it is commonly known as a hypothetical line that passes through the L4 spinous process or the L4–5 intervertebral space.
The traditional method of determining the vertebral level of Tuffier's line, manual palpation of the vertebral body, is the most widely used. Although this method is convenient, it may also be inaccurate. Van Gessel et al. [1] have reported that the vertebral level of Tuffier's line determined by palpation is higher than the actual vertebral level measured by spinal imaging. It has also been reported that the concordance rate between clinical examination and assessment of intervertebral space identification for lumbar puncture is only 64% [2].
Older patients undergo various kinds of physical changes as a result of aging. These may include bone density loss, changes in the height of vertebral bodies, and reduction of skeletal muscles, and resulting spinal degeneration. These changes are manifested clearly in postmenopausal women [3]. Due to this aging process of the skeletal system, the vertebral level through which Tuffier's line passes may be measured higher or lower than the usual level, which hints at the possibility of inaccuracy. Therefore, it would be imprecise to generalize the vertebral level determined by palpation to patients of all ages [4].
The most commonly used position for administering spinal anesthesia is the left lateral decubitus position, in which the patient flexes his or her neck, back, and knees. Although it would be possible to obtain an accurate measurement of the vertebral level if X-ray is used for spinal anesthesia, due to the radiation exposure, it is difficult to apply this method in every case in which spinal anesthesia is administered. Moreover, it is not easy to identify the precise vertebral level because the spine overlaps with patients' femurs or iliac bones in the lateral decubitus flexed position. Recently, the use of ultrasound for regional anesthesia has increased [56]. The benefit of ultrasound is that it is free of radiation exposure. In addition, it is even suitable for examination of the vertebral level from a patient's back in the left lateral decubitus flexed position. Thus, the use of ultrasound could play an important role in preventing any complications that may arise from inaccurate prediction of the vertebral level.
The purpose of this study was to compare the vertebral level crossed by Tuffier's line in elderly women with that in adult women using ultrasound in the left lateral decubitus flexed position. Furthermore, we also evaluated the correlation between the vertebral level measured by ultrasound and variables including patient characteristics.
Materials and Methods
This study was conducted after obtaining the approval of the local Institutional Ethics Review Board. We sequentially enrolled 50 female patients over the age of 65 (elderly group) who had been scheduled to undergo spinal anesthesia for surgery. Fifty female patients between the ages of 20 and 50 (control group) who had been scheduled to undergo spinal anesthesia for surgery were also sequentially enrolled. All patients who had been scheduled for spinal anesthesia underwent lumbar spine X-rays. Exclusion criteria included patients who had received spinal surgery, patients with spondylolisthesis, compression fractures, scoliosis, or transitional vertebrae, and those with any known spinal deformities.
After the patient entered the operating room, she turned onto her left side and flexed her neck, back, buttocks, and knees as much as possible. An experienced assistant stood by the patient's side and helped her maintain the optimal position. Using a 2–5 MHz curved array probe (M-Turbo™; SonoSite Canada Inc., Markham, ON, Canada), we first placed the probe 3 cm away from the midline of the vertebra in the longitudinal plane. Next, we tilted the probe slightly toward the spinal midline and placed the probe in the paramedian longitudinal plane. While gradually moving the probe cephalad from the patient's sacrum, we scanned the L2–5 lumbar spinous processes and marked the intervertebral spaces between each of them. We considered the intervertebral spaces as one segment, and equally divided each spinous process into two parts, labeling the upper half as "upper" and the lower half as "lower." The intervertebral spaces were labeled as L1–2, L2–3, L3–4, and L4–5, respectively. Beginning from the L5 lower part to the L2 upper part, consecutive numbers were assigned: the most caudal part was labeled 11, and the most cephalad part was labeled 1. This method utilized arbitrary labeling (Fig. 1). After palpating the superior aspects of the iliac crests, we drew a straight line connecting the points. We then identified which vertebral level was crossed by Tuffier's line. The patients' age, height, weight, and body mass index (BMI; kg/m2) were recorded.
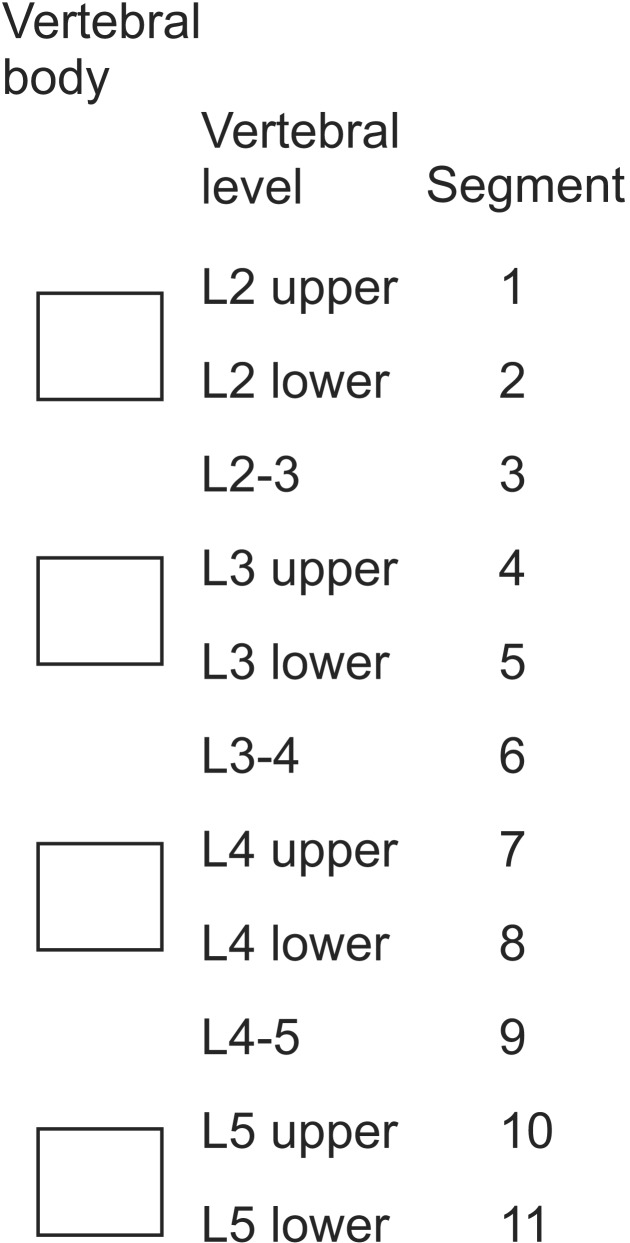
Arbitrary labeling of the vertebral level.
Using Cohen's effect size d = (mean2-mean1)/(pooled standard deviation) as 0.67, at a significance level of 0.05 with a power of 0.9, 49 patients per group were needed to detect a sufficient effect size in Student's t-test, and 51 patients per group were needed in the Mann-Whitney U test. We planned the study with 50 patients per group. The demographic data were presented as mean ± standard deviation (SD). Statistical analysis was conducted with IBM SPSS Statistics (ver. 20.0, IBM Corp., Armonk, NY, USA). Student's t-test, the Mann-Whitney U test, and Spearman's correlation analysis were used. The results were considered significant if the P value was less than 0.05.
Results
One hundred patients were enrolled in this study, 50 patients in the elderly group and 50 patients in the control group, and all of the data were analyzed. There were significant differences in age and height between the two groups (P < 0.001, Table 1), while there were no differences in weight and BMI.
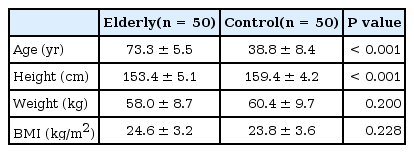
Patients' Characteristics
The median value of the arbitrary numbers signifying the vertebral level of Tuffier's line was 3 in the elderly group, which corresponds to the L2–3 intervertebral space. In the control group, the median value of the arbitrary numbers was 8, which corresponds to the lower part of the L4 vertebra. The difference between these two values was statistically significant (P < 0.001). In the elderly group, the vertebral levels of 38 subjects (76%) were located in the L2–3 or L3 vertebra; in the control group, the vertebral levels of 36 subjects (72%) were located in the L4 or L4–5 vertebra. The vertebral levels of Tuffier's line were located below L2 in all participants (Fig. 2).
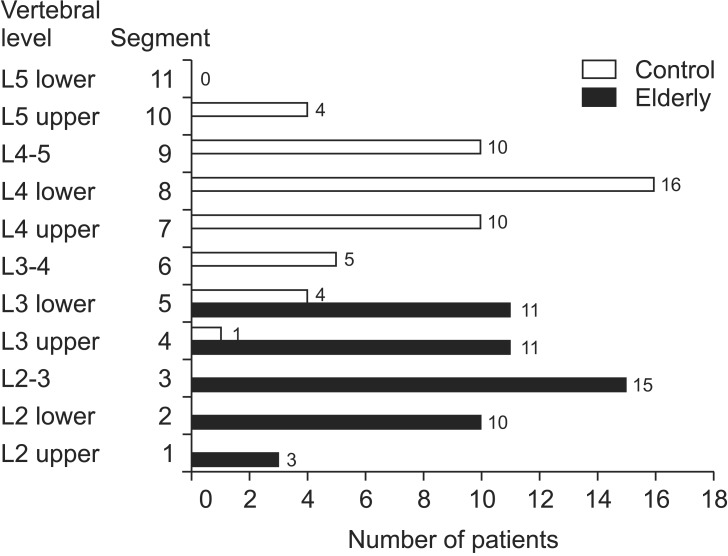
Distribution of the vertebral level of Tuffier's line measured by ultrasound.
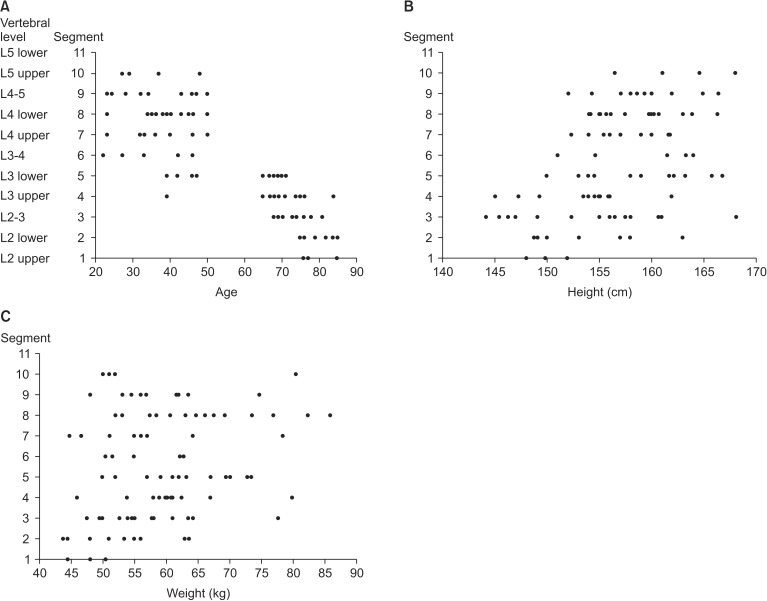
The vertebral level of Tuffier's line had statistically significant correlations with age, BMI, and weight in the elderly group (P < 0.001, Fig. 3). In this group, there was a positive correlation between the vertebral level of Tuffier's line and BMI and weight, while there was a negative correlation between the vertebral level of Tuffier's line and age. However, there were no significant correlations with any of these factors in the control group (Table 2). When the analysis was conducted on the total study group, the correlations between the vertebral level of Tuffier's line and age, height, and weight were shown to be significant (Table 2, Fig. 4).
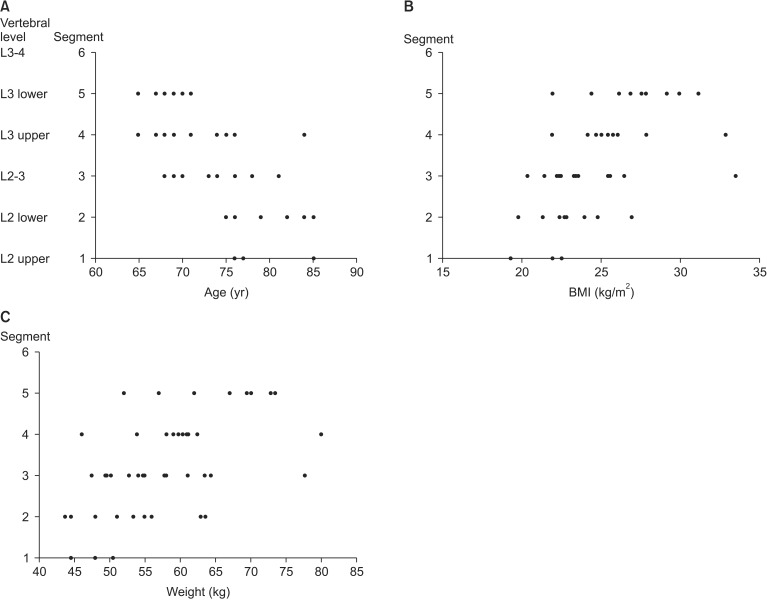
Scatter diagram of age (A), body mass index (BMI) (B), weight (C) and segment in the elderly group.
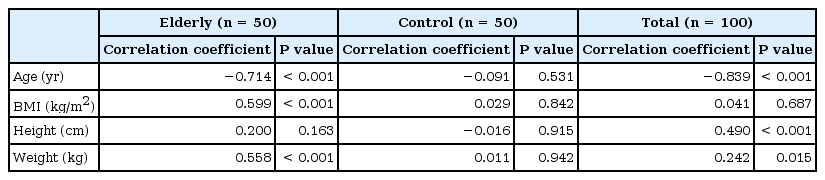
Spearman's Correlation Analysis of the Vertebral Level of the Tuffier's Line and Variables
Scatter diagram of age (A), height (B), weight (C) and segment in the total patients.
Discussion
We demonstrated that the vertebral level of Tuffier's line was more cephalad in the elderly group than that of the control group in the left lateral decubitus flexed position using ultrasound. In the elderly group, the vertebral level of Tuffier's line was located more cephalad as age increased, while it was located more caudad as BMI and weight increased, and these findings were statistically significant.
To estimate the accurate vertebral level is essential to determine the appropriate lumbar puncture level. Usually, the lumbar puncture point is determined based on Tuffier's line, an imaginary line connecting the superior aspects of the iliac crests. Anatomically, an adult's conus medullaris is known to end at the L1 or L2 vertebral level, and in order to prevent the risk of spinal cord injury, the needle should be inserted below the conus medullaris when conducting spinal anesthesia. If the vertebral level based on Tuffier's line is inaccurate and the needle is inserted above the end of the conus medullaris, it could result indirect injury to the spinal cord.
Generally, Tuffier's line is known to cross the L4 or L4–5 vertebral level [7]. It has been reported that these points of intersection in the supine position are mostly located at L4–5 (50.4%) or L4 (28.6%), and that they tend to be lower in a sitting position, usually at L4–5 (44%) or L5 (38.8%) in the Korean population [8]. Moreover, in the Korean population, the vertebral level determined by Tuffier's line was most commonly found at L4–5 (69.6%) and L5 (20%) in the jack-knife position [9]. Therefore, the vertebral level of Tuffier's line in the lateral decubitus flexed position with both legs flexed and the spine flexed as much as possible may be different from that in the supine position. In the present study, the participants' vertebral levels were measured in the lateral decubitus flexed position with both legs flexed and the spine flexed as much as possible, the most commonly used position when administering spinal anesthesia.
Many studies have suggested that the vertebral level of Tuffier's line identified by manual palpation and that shown in radiographic images do not coincide with each other [10]. Chakraverty et al. [11] reported that while Tuffier's line confirmed by palpation tended to be the L3 or L3–4 vertebral levels, Tuffier's line confirmed by imaging tended to be the L4 or L4–5 levels, demonstrating the possibility of inconsistency. The use of fluoroscopy for spinal procedures definitely reduces errors in determining the vertebral level. Nevertheless, considering the preparation of equipment and the radiation exposure, this is not suitable for actual clinical practice. Therefore, the use of ultrasound, which is not only easy to provide, but also does not entail the risk of radiation exposure, is currently increasing [12]. In the current study, we used ultrasound to assess the vertebral levels of patients from their backs, and this also contributed to the accuracy of our results. Manual palpation is more accurate in the left lateral decubitus flexed position than in the sitting or prone position because gravity pulls down the soft tissue including skin, fat tissue, and muscles, so the hard bones such as the iliac crests can be easily identified in the left lateral decubitus position. Manual palpation of the iliac crests may be inaccurate to some degree, and this detail is the limitation of the present study. However, we accurately assessed the vertebral levels of Tuffier's line using ultrasound.
Rahmani et al. [13] used magnetic resonance imaging to assess the vertebral level of the conus medullaris and calculate the distance between the end of the conus medullaris and Tuffier's line. The conus medullaris was located more caudad in women compared to men over the age of 50. The distance between the end of the conus medullaris and Tuffier's line was also shorter in women compared to men over the age of 50. However, no difference between women and men existed in the age group below 50, which demonstrated that this difference existed only among the older individuals. In the case of men, the bone mineral density (BMD) of their spines decreases at a constant rate in all age groups after they pass the age of 20. In contrast, in the case of women, spine BMD decreases at a rate four times faster than that of males, which has been reported to be the result of changes in female hormones after menopause [14]. However, whether hormone therapy after menopause is truly effective is still controversial [15]. We conducted this study with elderly women, who were expected to have more obvious spinal degeneration than elderly men.
As age increases, Tuffier's line is located at a higher vertebral level. This correlation existed only in the elderly group in the current study. In the control group, no correlation was found between age and the vertebral level of Tuffier's line. The vertebral level of Tuffier's line was also more cephalad in the elderly group compared with the control group. This finding can be explained by the fact that the elderly women were undergoing the aging process. Decreased BMD, reduced amount of skeletal muscle, deterioration of ligaments, and diminution in flexibility of body structures have developed in the elderly female patients. These factors can affect decreases in the vertebral body height and the intervertebral space. Therefore, these may influence the vertebral level of Tuffier's line. A significant difference existed between the heights of the two groups, which is also attributable to the aging process. However, when the statistical analysis was conducted separately within each group, the results were not significant in either group.
This study demonstrated that Tuffier's line passed through a higher vertebral level located more cephalad in the elderly group. This finding means that we could actually provide lumbar puncture at a higher vertebral level than expected in the lateral position. Therefore, if we determine the vertebral level through palpation in elderly patients, it is possible that the blockade could spread to a higher vertebral level than that which was intended. Moreover, since spinal cord injury and other side effects could occasionally occur, extra precautions are required.
In conclusion, we demonstrated that the vertebral level of Tuffier's line was more cephalad in the elderly women than that in the control group using ultrasound in the left lateral decubitus flexed position. This vertebral level was found to be significantly correlated with age, BMI, and weight in the elderly group. Therefore, we should consider that the needle could be inserted at a higher level than expected, and use caution in determining the level of needle insertion during spinal anesthesia for elderly women.