Introduction
Total hip arthroplasty (THA) is one of the most common orthopedic surgeries and causes considerable blood loss during both the intra- and post-operative periods [1]. One survey on the transfusion rate reported that 37-90% of patients who underwent a total hip replacement were transfused, with a mean of 2 units of red blood cells (RBCs) [2]. Therefore, it is important to maintain hemodynamic stability with adequate fluid therapy. Hydroxyethyl starch (HES) compounds are effective volume supplements for plasma volume replacement therapy during major surgical procedures that have a high risk of bleeding.
However, administration of a large volume of colloid may result in clinical coagulation derangements and renal impairment. Lower molecular weight and lower molar substitution ratio HES are associated with fewer negative blood coagulation effects in vivo and in vitro [3,4]. It has also been suggested that coagulation parameters are better preserved with HES suspended in balanced electrolyte solutions than with saline-based HES solutions [3]. A recent review by Mutter et al. [5] demonstrated that there are no differences in the risk of renal failure among various types of HES.
The purpose of this study was to assess the effects of in vivo administration of three HES solutions on blood coagulation: 10% pentastarch 260/0.45 (molecular weight in kDa/degree of substitution) in 0.9% saline (Pentaspan®, Bristol-Myers Squibb, Yongin-si, Korea), 6% tetrastarch 130/0.4 in 0.9% saline (Voluven®, Fresenius Kabi, Bad Homburg, Germany), and 6% tetrastarch 130/0.4 in balanced electrolyte solution (Volulyte®, Fresenius Kabi). No clinical studies have compared coagulation changes among these three commercially available colloid solutions in patients undergoing THA.
We hypothesized that low-molecular-weight HES suspended in balanced electrolyte solution would maintain blood coagulation better than high-molecular-weight HES in a saline-based carrier solution. We also performed laboratory tests, including assessments of hematological and hemostatic parameters and electrolytes, and a rotational thromboelastometry analysis.
Materials and Methods
After obtaining approval from the Institutional Review Board (B-1111/140-010, December 8, 2011), this study was registered at www.clinicaltrials.gov (NCT01512628). All subjects provided written informed consent before participating.
This randomized trial was conducted in patients with an American Society of Anesthesiologists physical status 1 or 2 who were scheduled for THA under spinal anesthesia. Pre-operative exclusion criteria included pre-existing hematological disease, recent medications interfering with hemostasis (e.g., aspirin, warfarin etc.), allergies to HES, hepatic disease or increased plasma concentrations of aspartate aminotransferase (AST > 40 IU/l) or alanine aminotransferase (ALT > 40 IU/l), renal disease or increased plasma creatinine concentration (Cr > 1.2 mg/dl), pre-operative hemoglobin < 10 g/dl, pulmonary diseases such as pulmonary edema/effusion, and cardiovascular diseases such as coronary artery disease, atherosclerosis obliterans, or myocardial infarction.
Before entering the operating room, patients were randomized to receive one of three colloids during the operation: 10% pentastarch 260/0.45 in 0.9% saline (Pentaspan®, Group-PEN), 6% tetrastarch 130/0.4 in 0.9% saline (Voluven®, Group-TETS), or 6% tetrastarch 130/0.4 in balanced electrolyte solution (Volulyte®, Group-TETB). The 81 subjects were randomized using a web-based randomization system. An anesthesiologist who did not participate in this study inserted the group allocations into an opaque envelope and sealed it.
Upon arrival in the operating room, standard monitoring-including of pulse oximetry, electrocardiogram, and non-invasive arterial blood pressure-was applied before induction of anesthesia. In all groups, spinal anesthesia was induced with 2.5-3 ml (12.5-15 mg) of 0.5% hyperbaric bupivacaine (Marcaine®, Astra-Zeneca, Stockholm, Sweden). We treated hypotension caused by spinal anesthesia with vasoactive drugs (ephedrine or phenylephrine) when systolic arterial pressure was < 20% of baseline or < 90 mmHg. Patients were kept warm with a forced-air warming blanket (Bair Hugger™ 52200, Arizant Healthcare Inc., Eden Prairie, MN, USA) covering all areas of the body except for the operated hip. A temperature probe was placed at the nondependent axilla to monitor body temperature during the operation.
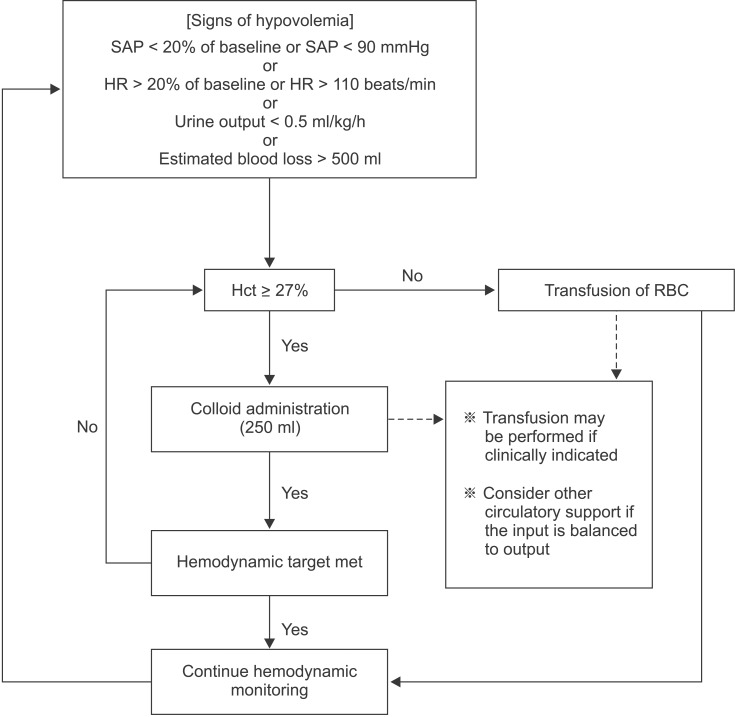
All patients received a colloid to treat hypovolemia according to a volume replacement algorithm based on the method described by Gan et al. [3] (Fig. 1). If the intra-operative hematocrit value fell below 27%, packed RBCs were transfused as necessary. Fresh frozen plasma (FFP) was administered post-operatively to patients who had both a FIBTEM-MCF value < 5 mm and prolonged coagulation test results (PT-INR > 1.30, aPTT > 50 s). Ringer's lactate solution was used to maintain fluid volume during the operation at a rate of 5 ml/kg/h. When the hemodynamic target was not attained despite adequate intravascular volume replacement, we considered circulatory support with vasopressors. In the present study, the maximum allowable dose of HES was 20 ml/kg to prevent the adverse effects of HES solution.
Venous blood samples were taken during additional peripheral venous catheter cannulation after checking the sensory block level to obtain the baseline values (before surgery), and after surgery upon arrival in the recovery room to obtain the immediate post-operative values (within 30 minutes after the end of the operation). We measured the hemoglobin and hematocrit values every 30 min during the operation. Test blood was drawn using the standard two-syringe technique to avoid contamination by tissue factors. The initial blood sample (~5 ml) was discarded, and the test blood sample was drawn immediately thereafter. Blood samples were collected in EDTA-containing bottles (Becton Dickinson, Plymouth, UK) to measure hemoglobin, hematocrit, and platelet counts, and in serum separator tubes to analyze electrolytes. To determine the international normalized ratio of prothrombin time (PT-INR) and the activated partial thromboplastin time (aPTT) and to conduct the rotational thromboelastometry analysis (ROTEM®; Pentapharm, Munich, Germany), the blood samples were placed into citrate-containing bottles. PT and aPTT were determined using a STA-R Evolution® analyzer (Diagnostica Stago Inc., Asnieres, France) using STA® Neoplastine® CI Plus and STA® PTT AUTOMATE reagents (Diagnostica Stago Inc., Asnieres, France). Hemoglobin, hematocrit, and platelet counts were followed up on the post-operative 2nd day and 7th day (discharge hemoglobin).
The ROTEM® analysis was carried out according to the manufacturer's recommendations by an investigator blinded to the type of HES used. After the analysis, the following parameters were obtained: clotting time (CT), clot formation time (CFT), α-angle, maximum clot firmness (MCF), and maximum lysis (ML). INTEM and EXTEM tests were used to assess the intrinsic and extrinsic coagulation pathways, respectively, with the recommended reagents (in-TEM®: 20 µl of 0.2 M CaCl2 and 20 µl thromboplastin-phospholipid; ex-TEM®: 20 µl of 0.2 M CaCl2 and 20 µl tissue factor). Changes in fibrin polymerization and fibrinogen concentration were determined using the FIBTEM test with fib-TEM® reagent (20 µl of 0.2 M CaCl2 with cytochalasin D and 20 µl tissue factor). Each test required 300 µl citrated whole blood, and all ROTEM® parameters were analyzed within 10 min after obtaining the blood sample.
Intra-operative estimated blood loss was calculated using the method described by Choi et al. [6]; (volume in suction bottle - amount of irrigation fluid) + amount of blood on the surgical field + amount of blood on surgical pads (fully soaked: 20 ml; half soaked: 10 ml). Post-operative blood loss was measured 48 h after the surgery from the amount of wound-drained blood in the collecting bag (ID-VAC®, Insung Medical Co., Yangpyung, Korea).
The primary outcomes of this study were the ROTEM® parameters, including INTEM, EXTEM and FIBTEM analyses. Secondary outcomes were the hematological and hemostatic parameters, including hemoglobin, hematocrit, platelet counts, PT-INR and aPTT values. A power analysis was conducted beforehand using ROTEM® data (MCF of FIBTEM) from a previous study [7]. With the assumption of a 30% difference in means and a standard deviation (SD) of 4.3, and aiming for a power of 80% and a risk of 0.025 for type-1 errors, 24 patients were required in each group. We selected 27 patients per group considering the potential dropout rate of 10%.
Data are expressed as means ± SD or number. All variables were tested for normality using the Shapiro-Wilk test. Statistical analyses were performed using one-way analysis of variance or the Kruskal-Wallis test, as appropriate. Post hoc comparisons (less significant difference method for normally distributed data or Bonferroni correction for non-normally distributed data) were performed in cases of significant differences. Baseline (pre-operative) and post-operative values in the same group were compared using the repeatedly measured ANOVA (hemoglobin, hematocrit, and platelet count) or were compared with the paired t-test (ROTEM parameters). Data were analyzed using SPSS ver. 18.0 (SPSS Inc., Chicago, IL, USA), and a P value < 0.05 was considered to indicate significance.
Results
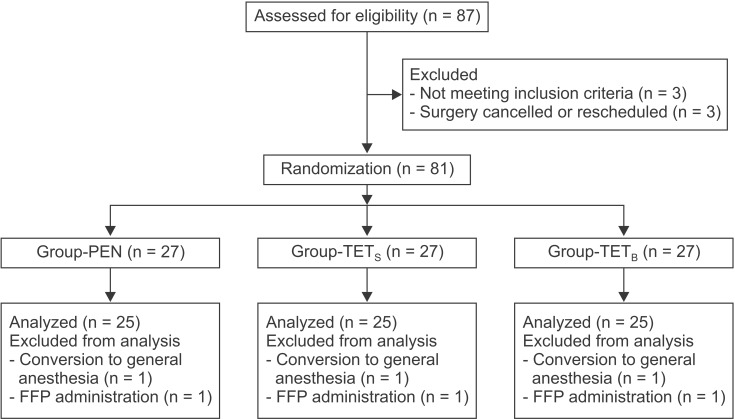
A total of 87 patients were evaluated for eligibility, of which 81 were each assigned to one of the three groups. Six of the randomized patients were excluded from the analysis (Fig. 2). Three patients (one patient from each group) were excluded as a result of conversion to general anesthesia because of a prolonged operation time due to unexpected surgical difficulty. Three patients (one patient from each group) required FFP transfusions during the operation at the surgeon's discretion (observed blood oozing in the operative field). Characteristics of the patients, surgery, and anesthesia were not significantly different among the three groups (Table 1). The volumes of colloid (P = 0.524) and crystalloid solutions (P = 0.250) infused during the operation were not significantly different among the groups (Table 1). There were no protocol violations during the operation.
ROTEM® parameter values are presented in Table 2. There was no significant difference in the baseline values of ROTEM parameters among the three groups. After surgery, the post-operative ROTEM® parameters changed in all groups as follows: CT and CFT were prolonged, and the α-angle and MCF decreased. The ML did not change significantly. Inter-group comparisons revealed that the INTEM-CFT was significantly prolonged in Group-PEN compared with Group-TETS (P = 0.018) and Group-TETB (P = 0.027). The INTEM-α-angle was significantly decreased in Group-PEN compared with Group-TETS (P = 0.004) and Group-TETB (P = 0.021). The EXTEM-CT was significantly prolonged in Group-PEN compared with Group-TETS (P = 0.001) and Group-TETB (P = 0.045). The EXTEM-CFT was significantly prolonged in Group-PEN compared with Group-TETB (P = 0.015), and the EXTEM-α-angle (P = 0.009) and EXTEM-MCF (P = 0.009) were significantly decreased in Group-PEN compared with Group-TETB. The FIBTEM-MCF was significantly decreased in Group-PEN compared with Group-TETB (P = 0.005).
All ROTEM® parameters were maintained within the normal range, with the exception of the INTEM-CFT, INTEM-α-angle, and FIBTEM-MCF values in Group-PEN.
The percentage change in the INTEM-CFT (P = 0.004) and INTEM-α-angle (P = 0.003) was significantly greater in Group-PEN than in Group-TETS and Group-TETB (Fig. 3). The percentage change in the FIBTEM-MCF was significantly smaller in Group-TETS (P = 0.024) and Group-TETB (P = 0.004) than in Group-PEN (Fig. 3).
Hematologic laboratory data are shown in Table 3. In the inter-group comparisons, post-operative hemoglobin, hematocrit, and platelet counts did not significantly differ among the groups. Immediate, 2-day, and 7-day post-operative hemoglobin (P < 0.001) and hematocrit (P < 0.001) decreased significantly compared to the baseline values within each group. Platelet counts significantly decreased immediately (P < 0.001) and at 2 days (P < 0.001) after surgery compared to baseline; however, the values recovered 7 days post-operatively in each group.
Coagulation and electrolyte data are presented in Table 4. The post-operative PT-INR (P < 0.001) and aPTT (P < 0.001) were significantly prolonged in Group-PEN compared with Group-TETB. No significant differences were observed between the groups with respect to pre- and post-operative levels of ionized calcium, serum magnesium, and serum chloride. Post-operative PT-INR (P < 0.001) values increased significantly compared with the baseline in all groups. In contrast, the post-operative aPTT was significantly prolonged compared with the baseline in Group-PEN (P < 0.001) and Group-TETS (P = 0.013).
The amount of intra-operative blood loss (mean ± SD) was 846 ± 344 ml in Group-PEN, 838 ± 241 ml in Group-TETS and 692 ± 247 ml in Group-TETB (Table 5, P = 0.100). Post-operative blood loss, as indicated by the volume of blood in the collecting bag, was significantly lower in Group-TETS (431 ± 183 ml, P < 0.001) and Group-TETB (461 ± 218 ml, P < 0.001) compared with Group-PEN (739 ± 421 ml) (Table 5). The amount of packed RBCs transfused in the post-operative period were significantly lower in Group-TETB (128 ± 191 ml, P = 0.015) compared with Group-PEN (288 ± 259 ml) (Table 5). The total amounts of packed RBCs transfused were significantly lower in Group-TETB (216 ± 245 ml, P = 0.018) compared with Group-PEN (424 ± 353 ml) (Table 5). In post-operative period, FFPs were administered to three, two, and two patients in Group-PEN, Group-TETS, and Group-TETB, respectively.
No significant differences were observed among the groups with respect to intra-operative values for heart rate, systolic blood pressure, and diastolic blood pressure (data not shown). The need for rescue analgesics, patient-controlled analgesia consumption, pain score, and the amounts of fluids administered postoperatively were not significantly different between the groups (data not shown). No patient required a re-operation due to post-operative bleeding or any other cause.
Discussion
We investigated the ROTEM-based blood coagulation profiles of three HES solutions. This is the first report to compare the hemostatic effects of 10% pentastarch 260/0.45 in saline solution, 6% tetrastarch 130/0.4 in saline solution, and 6% tetrastarch 130/0.4 in balanced electrolyte solution with rotational thromboelastometry (ROTEM®) in surgical patients.
Our results showed the following two key findings concerning the coagulation changes from ROTEM® analysis: First, the post-operative coagulation parameters changed toward a hypocoagulable state (CT and CFT: prolonged; α-angle and MCF: decreased). Second, the most prominent change was in the FIBTEM values, indicating fibrin polymerization.
The main ROTEM® findings of the present study were that all three HES solutions decreased the coagulability of whole blood in vivo, but tetrastarch in balanced electrolyte solution had less effect on the extrinsic coagulation pathway (EXTEM) compared with pentastarch. Tetrastarches also impairment on fibrin polymerization (FIBTEM) less than did pentastarch. Most post-operative ROTEM® values (EXTEM, INTEM, FIBTEM) were maintained within the normal range in Group-TETS and Group-TETB, but not in Group-PEN (e.g., INTEM-α-angle, FIBTEM-MCF, INTEM-CFT values). CFT represents fibrin polymerization and stabilization of the clot with platelets. The alpha (α)-angle is primarily influenced by platelet function, fibrinogen, and coagulation factors. Our results suggest that pentastarch causes coagulation derangement by impairing fibrin polymerization. Ruttmann et al. [8] reported that hemodilution with either colloid or saline causes a hypercoagulable state of blood in vitro. However, in an in vivo investigation, the degree of change in coagulability was not significant in the HES group compared with the normal saline group [9]. These conflicting results, including those reported herein, may have been due to differences in the methods used in each study, such as in vitro vs. in vivo, healthy volunteers vs. patients, or rotational thromboelastometry vs. thromboelastography (using activators or not). Various conditions, such as the stress response to surgery [10], changes in coagulation factors according to surgery [11], intra-operative bleeding, and type of fluids (crystalloid vs. colloid) administered may influence the blood coagulation system.
The degree of percentage changes in the ROTEM® parameters can be summarized as follows: Pentastarch (Group-PEN) caused the most prominent percentage change in ROTEM® parameters compared with tetrastarches (Group-TETS and Group-TETB). The most remarkable finding was the difference in the percentage change of FIBTEM-MCF among the three groups. Pentastarch caused the largest derangement in the MCF of FIBTEM. Mittermayr et al. [12] reported that impaired fibrin polymerization is a key problem following HES administration, causing coagulopathy during major orthopedic surgery; our findings support this. The amount of intra-operative blood loss and administered HES per body weight in Group-PEN (12.9 ± 5.7 and 11.9 ± 3.6 ml/kg, respectively) were not significantly different compared with Group-TETS (13.2 ± 4.4 and 12.0 ± 5.2 ml/kg, respectively) or Group-TETB (11.3 ± 4.9 and 11.5 ± 5.6 ml/kg, respectively). However, the amount of post-operative blood loss in Group-PEN (776 ± 408 ml) was greater than in Group-TETS (431 ± 183 ml) and Group-TETB (461 ± 218 ml). The degree of impairment of fibrin polymerization may have been a contributing factor to this result. The clinical implication is that approximately 10 ml/kg HES can impair fibrin polymerization (FIBTEM-MCF), although the HES volume is not large. Osman et al. [13] reported that ~15 ml/kg of 6% pentastarch 200/0.5 was more likely to cause coagulation derangement (hypocoagulable effect) than 6% tetrastarch 130/0.4 in patients undergoing spinal fusion surgery, and our results are consistent with the results of their study. From a practical point of view, we recommend using low-molecular-weight HES solutions in patients for whom considerable blood loss during surgery is anticipated.
Recently developed HES solutions, which contain a balanced electrolyte solution, are physiologically similar to human plasma in terms of electrolyte composition and osmolality. Several studies have reported fewer coagulation abnormalities and reduced blood loss after the administration of balanced electrolyte HES compared with saline-based HES solutions [3,4]. Calcium is regarded as the main factor contributing to these favorable outcomes; this is included only in balanced electrolyte HES [4,14]. However, after comparing of the Group-TETS and Group-TETB, our data did not indicate that the balanced electrolyte HES preserves hemostatic capacity better than saline-based HES in the ROTEM® analysis. Additionally, the ionized calcium levels and the volume of blood loss did not differ significantly between Group-TETS and Group-TETB. Therefore, as described by Roche el al. [15], calcium may not be the sole factor responsible for the coagulation effect of balanced electrolyte HES. Chloride is also an important factor to be considered during volume replacement therapy with saline-based solutions. Although there were no significant differences in chloride level among the three groups, Base et al. [16] reported that serum chloride levels were lower in patients administered balanced 6% HES compared with those given saline-based 6% HES, and suggested that balanced HES may avoid hyperchloremic acidosis. The coagulation system is composed of a variety of enzymes [17] and can be affected by pH. Administration of a large volume of saline-based colloid may cause hyperchloremic metabolic acidosis, which, in turn, has been associated with coagulation derangement [4], leading to increased bleeding [3].
Two mechanisms account for the effects of HES on blood coagulation. First, fluid administration influences the coagulation cascade by diluting the circulating concentration of the coagulation factors involved [18,19]. Pentastarch results in a volume expansion of 150% of the volume infused, whereas tetrastarches cause 100% volume expansion [20]. Although the total volumes of HES infused were not significantly different among the groups in this study, the dilutional effect should have been more prominent in Group-PEN because of the difference in volume-expanding ability. Second, the intrinsic effects of each HES solution affect the coagulation profiles [21,22]. In the present study, PT-INR, aPTT, and ROTEM® values were prolonged in all groups.
The first limitation of this study is that we did not measure plasma fibrinogen levels. Thus, we were unable to ascertain quantitative fibrinogen changes. However, we demonstrated the FIBTEM changes in ROTEM® analyses. The second limitation is that this was not a controlled trial. Inclusion of a control group that did not receive colloids could have yielded a more definitive assessment of the effects colloids on blood coagulation. Third, because the practitioner was not blinded to the colloids, this was an open label study. However, the anesthesiologist who administered colloids to the patients was unaware of the entire study protocol, and was instructed to only perform volume replacement according to the algorithm of this study. Finally, because we did not monitor the intravascular volume by measuring values such as the central venous pressure or stroke volume variation, we could not accurately determine the adequate intravascular volume.
In conclusion, administering 10% HES 260/0.45 can lead to blood coagulation derangement in patients with massive bleeding, as determined by ROTEM® analyses and coagulation tests. Balanced electrolyte 6% HES 130/0.4 caused a less pronounced change in the coagulation cascade compared with 10% HES 260/0.45. Therefore, 6% HES 130/0.4 should be considered to compensate for massive bleeding rather than 10% HES 260/0.45.