Validation of the APACHE IV model and its comparison with the APACHE II, SAPS 3, and Korean SAPS 3 models for the prediction of hospital mortality in a Korean surgical intensive care unit
Article information
Abstract
Background
The Acute Physiology and Chronic Health Evaluation (APACHE) IV model has not yet been validated in Korea. The aim of this study was to compare the ability of the APACHE IV with those of APACHE II, Simplified Acute Physiology Score (SAPS) 3, and Korean SAPS 3 in predicting hospital mortality in a surgical intensive care unit (SICU) population.
Methods
We retrospectively reviewed electronic medical records for patients admitted to the SICU from March 2011 to February 2012 in a university hospital. Measurements of discrimination and calibration were performed using the area under the receiver operating characteristic curve (AUC) and the Hosmer-Lemeshow test, respectively. We calculated the standardized mortality ratio (SMR, actual mortality predicted mortality) for the four models.
Results
The study included 1,314 patients. The hospital mortality rate was 3.3%. The discriminative powers of all models were similar and very reliable. The AUCs were 0.80 for APACHE IV, 0.85 for APACHE II, 0.86 for SAPS 3, and 0.86 for Korean SAPS 3. Hosmer and Lemeshow C and H statistics showed poor calibration for all of the models (P < 0.05). The SMRs of APACHE IV, APACHE II, SAPS 3, and Korean SAPS 3 were 0.21, 0.11 0.23, 0.34, and 0.25, respectively.
Conclusions
The APACHE IV revealed good discrimination but poor calibration. The overall discrimination and calibration of APACHE IV were similar to those of APACHE II, SAPS 3, and Korean SAPS 3 in this study. A high level of customization is required to improve calibration in this study setting.
Introduction
The scoring systems used widely in the field of intensive care are generic prognostic models that estimate the in-hospital mortality rate [1]. They are designed to express a patient's physical status numerically. Many clinicians utilize these systems to measure the severity of illness, predict patient prognosis, and gather information for clinical research. Since the development of the APACHE scoring system in 1981 [2], many scoring systems, such as the Simplified Acute Physiology Score (SAPS) in 1984 [3] and Mortality Probability Model in 1985 [4], have been introduced. Over time, these models were not only calibrated but also updated. The latest result of the effort is the Acute Physiology and Chronic Health Evaluation (APACHE) IV model, which was published in 2006 [5].
First presented two decades ago, APACHE II [6] and SAPS 2 [7] are old models. These are still in use because of their simplicity and easy accessibility. However, Zimmerman et al. [5] suggested that APACHE IV has better accuracy than the previous systems, and older models should not be used. The APACHE IV model showed good discrimination and calibration in the United States where the model was developed [5]. Outside the United States, recent studies have demonstrated that the discriminatory performance of APACHE IV was good [8,9,10,11,12]. However, its performance has not yet been validated in Korea.
The aim of the present study was 1) to validate APACHE IV and 2) to compare the ability of the APACHE IV with those of APACHE II, SAPS 3, and Korean SAPS 3 in terms of predicting hospital mortality in a Korean surgical intensive care unit (SICU) population.
Materials and Methods
The present study was approved by the Institutional Review Board, and informed consent was obtained. The current retrospective study was conducted at the SICU of a 1200-bed university teaching hospital. The SICU, which comprised 32 beds, was managed using an open system.
Patient population
All patients admitted to the SICU from March 2011 to February 2012 were included in the present study. Patients who underwent vascular surgery, lung surgery, neurosurgery, orthopedic surgery, and general surgery were the main patient group. In addition, patients with serious medical or surgical postoperative complications admitted to the SICU were included. Pediatric patients (< 18 years of age), cardiac patients and medical department patients were excluded. We also excluded patients with an SICU stay < 24 h or a hospital stay > 365 days and those who were readmitted after initial ICU discharge. Patients who were cadaveric donors were also excluded from the main analysis.
Data collection
Two senior residents and one fellow retrospectively reviewed the electronic medical records. The electronic medical records provided all of the data required to predict the mortality rate using the APACHE IV, APACHE II, SAPS 3, and Korean SAPS 3 models. APACHE IV and APACHE II scores were derived from the worst laboratory findings obtained within 24 h after admission, and SAPS III scores were obtained from the worst laboratory findings 1 h after SICU admission. Predicted hospital mortalities were calculated using equations of each model, as follows: logit for APACHE II = -3.517 + (APACHE II) × 0.146; logit for SAPS 3 = -32.6659 + ln (SAPS 3 + 20.5958) × 7.3068; logit for Korean SAPS 3 = -35.1752 + ln (SAPS3 + 20.5958) × 7.7379; and the predicted mortality rate = eLogit/(1 + eLogit) [6,13]. The APACHE is a registered trademark of Cerner Corporation (Kansas City, MO, USA). The APACHE IV score and predicted mortality rate calculation on the website (http://www.mecriticalcare.net/icu_scores/apacheIV.php) was used in the present study. The performance of each model was evaluated both in total patients and in two subgroups of patients that were divided into the admission-type subgroup and admission diagnoses subgroup.
Definitions
To validate each prognostic model, discrimination and calibration were performed. Discrimination is defined as the ability of the model to separate survivors from non-survivors and is assessed using the area under the receiver operating characteristic curve (AUC) [14]. It is classified as excellent, very good, good, moderate, or poor according to the AUC values of 0.9 to 0.99, 0.8 to 0.89, 0.7 to 0.79, 0.6 to 0.69, and < 0.6, respectively [15,16]. A prognostic model with a high AUC suggests that the model can accurately predict the probability of death. Calibration is defined as the ability of a model to describe the mortality pattern in the data and is assessed using the Hosmer-Lemeshow goodness-of-fit test [17]. When the predicted mortality of the prognostic model differs significantly from the observed pattern, the calibration ability of this model is poor, and goodness-of-fit statistics are significant. The Hosmer-Lemeshow goodness-of-fit test evaluates the agreement between the observed and expected numbers of survivors and non-survivors across all of the strata with equal number of patients (C-statistics) or with 10 groups divided by expected mortality intervals (H statistics) [17]. The Brier score is assessed as a measure of overall model accuracy, involving elements of both discrimination and calibration. It measures the average squared difference between predicted probabilities of outcomes [18,19]. A lower score represents higher accuracy. The standardized mortality ratio (SMR) is the ratio between the observed and predicted number of deaths. A SMR equal to 1.0 indicates that the number of observed mortality equals that of predicted mortality.
Statistical analysis
Statistical analysis was performed using SPSS version 19.0 for Windows (SPSS, Inc., Chicago, IL, USA). Data were reported as means ± standard deviation (SD) or medians with 25th and 75th quartiles for continuous variables and percentages for quantitative variables. Student's t-test, chi-squared test or Fisher's exact test were used, depending on whether the variables were continuous or categorical. P values less than 0.05 were deemed to indicate statistical significance. We used the AUC to measure the four models' discrimination for hospital mortality. Calibration was assessed using the Hosmer-Lemeshow goodness-of-fit C statistics, with a P value greater than 0.05 indicating good calibration [20]. The Brier score and SMR were also calculated.
Results
Characteristics of the study population
There were 2,952 admissions to our SICU during the study period. Of those, 1,314 patients comprised our final sample (Fig. 1). The basic patient characteristics and outcomes are shown in Table 1. General surgery included mainly liver transplantations, colorectal surgeries and stomach surgeries. Thoracic surgery included operations on the lung and esophagus. Neurosurgery included mainly brain tumor removals and intracranial or subarachnoid hemorrhage evacuations. Obstetric-gynecologic patients underwent mainly bleeding control after delivery and debulking operation for ovarian cancer. Orthopedic surgery included total knee replacement arthroplasties, total hip surgeries, and scoliosis correction operations.

Study population. ICU: intensive care unit.
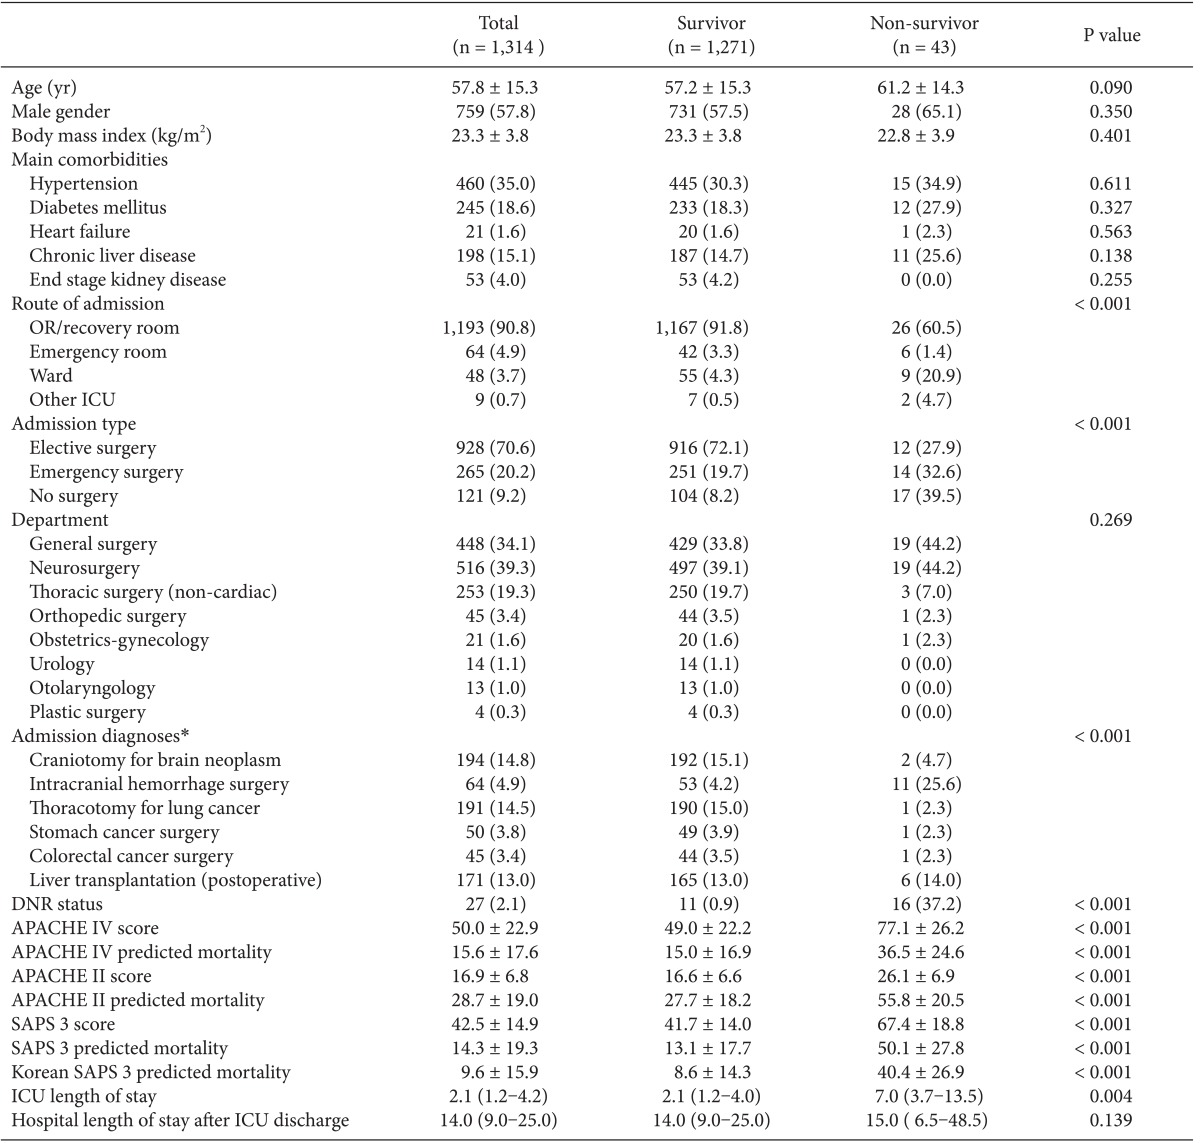
Patient Characteristics and Scores and Predicted Mortality on each Prognostic Model
Forty-three patients (3.3%) in the study population expired. They were in a poorer condition at the time of SICU admission than those who survived (P < 0.001). Non-survivors stayed longer in the ICU than survivors (P = 0.004; Table 1). Significant differences were found in the admission routes and surgery types between the survivor and non-survivor groups (P < 0.001, both).
Validation of the APACHE IV model
The APACHE IV model showed good discrimination and accuracy (AUC = 0.80; Brier score = 0.06) but poor calibration (C-statistics = 220.33; P < 0.001, Table 2). The model significantly overestimated the observed mortality (SMR = 0.21). The performance of the APACHE IV model varied among subgroups of admission types and admission diagnoses. Patients who received stomach cancer surgery showed good calibration (C-statistics = 11.51; H-statistics = 10.30; P > 0.05), whereas patients who had other surgeries showed poor calibration. All subgroups of admission types showed moderate discrimination and poor calibration.

Performance of APACHE IV, APACHE II, SAPS 3, and Korean SAPS 3 Models on Prediction of Hospital Mortality
Comparison of the performance of the APACHE IV and other prognostic models
Hosmer-Lemeshow statistics showed poor calibration for all four models: APACHE IV, APACHE II, SAPS 3, and Korean SAPS 3 (P < 0.001; Table 2; Figs. 2 and 3). Discrimination, as measured by the AUC, was generally very good for all models (AUCs > 0.8; Fig. 4). AUCs of all models showed no statistically significant difference (P > 0.05). In the subgroups of thoracotomy for lung cancer and stomach surgery, SAPS 3 and Korean SAPS 3 showed good calibration (P > 0.05) but poor discrimination (AUC < 0.6; Table 2). The APACHE II score showed poor calibration in all subgroups. Brier scores of the APACHE IV, SAPS 3, and Korean SAPS 3 models were significantly better than that of the APACHE II model. All prognostic models significantly overestimated the observed mortality (SMR < 1.0). The no-surgery subgroup showed less overestimation of the observed mortality rate in all of the models.
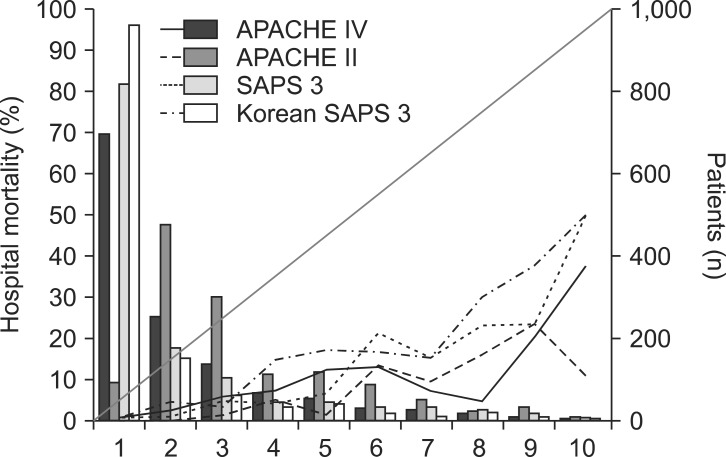
Calibration plots of four different models (H-statistics). X-axis represents a decile predicted mortality of 10 groups on each model. The diagonal line indicates ideal prediction for hospital mortality. The bars represent the number of patients. APACHE: acute physiology and chronic health evaluation, SAPS: simplified acute physiology score.
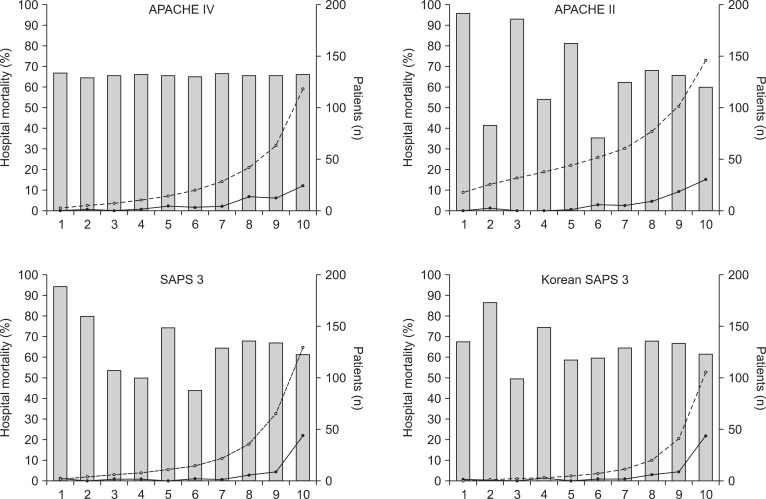
Calibration plots of four different models (C-statistics). X-axis represents an approximate decile patient of 10 groups. The bars represent the number of patients. The line with open circles represents mean predicted mortality. The line with closed circles represents mean observed mortality. APACHE: acute physiology and chronic health evaluation, SAPS: simplified acute physiology score.

Comparison of the area under the receiver operating characteristic curves (AUC) of APACHE IV, APACHE II, SAPS 3, and Korean SAPS 3. The AUCs are 0.80, 0.85, 0.86, and 0.86 in APACHE IV, APACHE II, SAPS 3, Korean SAPS3 models, respectively. APACHE: acute physiology and chronic health evaluation, SAPS: simplified acute physiology score.
Discussion
Our study demonstrated that the APACHE IV, APACHE II, SAPS 3, and Korean SAPS 3 models showed good discrimination but poor calibration. Additionally, these four models overestimated the observed mortality rate.
External validation is necessary before implementing prediction models in countries other than that in which the prognostic model was first developed [21,22]. To our knowledge, this is the first study to validate the APACHE IV model and compare it with other prognostic models in a Korean ICU. Since the APACHE IV system was developed in the United States in 2006, it has been implemented worldwide and applied to general ICUs and specific patient groups [5,8,9,10]. A major advantage of the APACHE IV model is its ability to select 116 detailed admitting diagnostic options, which promote outcome analysis in specific subgroups [5]. Conversely, the large number of variables requires a relatively longer time for data abstraction [23]. In the current study, the APACHE IV model had very good discrimination and accuracy (AUC = 0.82; Brier score = 0.05) but poor calibration (C-statistics = 309.27). Such findings are supported by the results of a previous study that performed external validation of APACHE IV, in which APACHE IV showed very good discrimination and accuracy (AUC = 0.87; Brier score = 0.10) but poor calibration (C-statistic = 822.67) in Dutch ICUs [8]. A previous study conducted in American ICUs showed very good discriminatory power (AUC = 0.86) of APACHE IV [9].
The SAPS 3 model, the latest version of the SAPS system, was developed in 2005 [24]. One of the advantages of this model is its short data collection window (1 h), which may be useful in triage and could save the abstraction time. This model was assessed frequently in worldwide ICUs showing good discrimination but poor calibration [10,12,25,26,27]. Similar to our study, other studies revealed that SAPS 3 and Australasia SAPS 3 had good discrimination but poor calibration, a feature that was improved after customization. In Korean ICUs, SAPS 3 also has been validated and customized [28]. In the present study, the Korean SAPS 3 demonstrated good discrimination but poor calibration. Such findings can be explained by the difference in the proportions of elective surgical patients and admission diagnoses between the customization cohort of Korean SAPS 3 and our study population.
Previous studies concerning external validation of other various prediction models showed patterns similar to those reported here, with good discrimination but imperfect calibration [8,25,26,27]. Nassar et al. suggested that the pattern can be explained by differences in the study population, regional variability of end-of-life decisions, and temporal bias-the time interval between the development of the prognostic models and study enrollment [29]. Other studies have suggested disparities in case presentation, mortality rates among countries, and differences in sample size between the study population and the original cohort used in the development of the scoring systems as explanations for those differing patterns [8,20,30].
Of previous studies comparing the APACHE IV and SAPS 3 prognostic models, two regarding general ICU patients showed that the APACHE IV model had better discriminatory capability than SAPS 3 [9,29], but other studies for acute kidney injury and acute coronary artery syndrome patients showed that the two models have similar discriminatory performance [10,11]. Additionally, one study reported that the discrimination and calibration of APACHE II are similar to those of SAPS 3 [26]. Our study also showed that the discrimination and calibration of APACHE II were similar to those of SAPS 3 and APACHE IV, but APACHE II significantly overestimated hospital mortality than APACHE IV and SAPS 3.
All of the prognostic models in our study overestimated mortality. The observed mortality rate was 3.3% in the present study, whereas the mortality rates of each prognostic model were 15.6, 28.7, 14.3, and 9.6% for APACHE IV, APACHE II, SAPS 3, and Korean SAPS 3, respectively. Additionally, the proportion of elective surgical patients was 70.6% in the current study, whereas the portion was 30.9% for APACHE IV and 34.7% for SAPS 3 when each prognostic model was applied. We assumed that the low mortality rate and higher proportion of elective surgical patients contributed to the difference between the actual mortality and predicted mortality derived from each prognostic model. Therefore, our findings suggest that customization of each prognostic model should be required when the model is applied to a different ICU because differences in mortality and study population, type of ICUs, and other ICU environmental factors contribute to the discrepancy between the actual mortality and predicted mortality derived from each prognostic model.
Among the admission diagnoses subgroup, thoracotomy for lung cancer showed poor discrimination in SAPS 3 and Korean SAPS 3. A previous study reported that the SMR is lowest in patients with thoracotomy for lung cancer [8]. Such a finding suggests that other factors, such as size and location of the cancer, not included in the prognostic model, might influence the patient outcome. Elective surgery patients had the lowest SMR, whereas no surgery patient had a relatively higher SMR in our study. The prior study suggested that, for ICUs, which have higher proportions of elective surgical patients, a higher level of customization could be considered [8].
One limitation of the present study is that it was conducted at a single surgical ICU, limiting the ability to generalize our results to other ICUs because admission diagnoses, patient populations such as medical or medico-surgical patients, and other environments are diverse. Although our data included 1,314 patients, the overall hospital mortality rate was very low, which might have affected the performance of each prognostic model. Another limitation is associated with retrospective data collection. Although selected residents were trained to collect the data, such retrospective data abstraction carries a risk of error. Finally, the equation in each prognostic model for the prediction of hospital mortality was not customized in the current study.
In summary, the discriminatory performance of the APACHE IV model was very good and similar to those of the APACHE II, SAPS 3, and Korean SAPS 3 models. All of the models, however, showed poor calibration, although some subgroups with a relatively high mortality rate showed good calibration. To improve the calibration performance, all of the original prognostic models in the present study setting should be customized.
Acknowledgments
We express our gratitude to J.W. Park in Medical Research Collaborating Center for assisting with data analysis.