Correction of target-controlled infusion following wrong selection of emulsion concentrations of propofol
Article information
Abstract
Background
We investigated the correction methods following wrong-settings of emulsion concentrations of propofol as a countermeasure against erroneous target-controlled infusions (TCI).
Methods
TCIs were started with targeting 4.0 µg/ml of effect-site concentration (Ceff) of propofol, and the emulsion concentrations were selected for 2.0% instead of 1.0% (FALSE1-2, n = 24), or 1.0% instead of 2.0% (FALSE2-1, n = 24). These wrong TCIs were corrected at 3 min after infusion start. During FALSE1-2, the deficit was filled up while injecting after equilibrium (n = 12), or while overriding (n = 12). During FALSE2-1, the overdose was evacuated while targeting Ceff (n = 12) or targeting plasma concentration (Cp) (n = 12). The gravimetrical measurements of TCI reproduced the Cp and Ceff using simulations. The reproduced Ceff at 3 min (Ceff-3min) and the time to be normalized within ± 5% of target Ceff (T±5%), were compared between the correction methods.
Results
During the wrong TCI, Ceff-3min was 1.98 ± 0.01 µg/ml in FALSE1-2, and 7.99 ± 0.05 µg/ml in FALSE2-1. In FALSE1-2, T±5% was significantly shorter when corrected while overriding (3.9 ± 0.25 min), than corrected after equilibrium (6.9 ± 0.05 min) (P < 0.001). In FALSE2-1, T±5% was significantly shorter during targeting Cp (3.6 ± 0.04 min) than targeting Ceff (6.7 ± 0.15 min) (P < 0.001).
Conclusions
The correction methods, based on the pharmacokinetic and pharmacodynamic characteristics, could effectively and rapidly normalize the wrong TCI following erroneously selections of the emulsion concentration of propofol.
Introduction
There are various kinds of errors possible while starting the target-controlled infusion (TCI) of anesthetics, resulting from mechanical causes or the wrong selection of TCI settings. A mechanical error of the infusion assembly of a TCI device was reported as a start-up delay that prolonged the stable state of infusion [1,2]. However, this kind of inaccuracy could be normalized as time passed, while the infusion system established stability. On the other hand, when settings of TCI variables are mistaken, such as patient-covariates, syringe brand compatibility [3], and drug name or diluent concentration, an estimation of the consequences will still be difficult.
The Diprifusor© for propofol with an automatic security tag system using a radio-frequency technology [4] can prevent the possibility to select the wrong emulsion concentration. However, all TCI machines are not equipped with automatic drug-recognizing systems. Accordingly, sometimes, if various emulsions of propofol were concomitantly prepared in the same anesthetic units, or if the TCI were prepared using various drug-infusion protocols saved in the TCI workstation, this kind of error-setting could be encountered. In our institute, such an error setting was found after the initiation of TCI and the wrong TCI was to be given up and switched to a zero-order continuous infusion pattern.
Therefore, in the present study we established the methods of correction for the TCI of propofol following wrong selection of emulsion concentration during the induction of anesthesia and we pharmacokinetically investigated the validity of the correction methods for each potential error situation.
Materials and Methods
In this study bench experiments were conducted, using sterile distilled water as a virtual solution for 1.0 and 2.0% propofol-TCIs targeting 4.0 µg/ml of effect site concentration (Ceff). Three TCI workstations (Orchestra®, Fresenius Vial, Le Grand Chemin, Brezins, France) were randomly used. The modules were calibrated (Zero calibration: 6V ± 0.05V, Pressure calibration: 0.8 bar) before this experiment. The incorporated PK/PD model of Gepts et al. [5] and Struys et al. [6] was selected and covariates (age, gender, height) were randomly entered. The body weight was used at 5.0 kg intervals between 40 to 95 kg as the only covariate influencing the PK parameters in this PK/PD model.
A diagram for this experiment is schematized in Fig. 1. A BD Plastipak compatible 60 ml syringe (BD 60 ml Syringe, Luer-Lok™ Tip, BD, USA) was inserted into the TCI workstation and the syringe tip was connected to a three-way stopcock. One male-side was used to evacuate fluid and the other male-side was connected to 4 three-way stopcocks serially. Four 1 ml syringes were connected for fill up to the each stopcock and a low-compliant infusion line (M-V Extension Tubing, Ace-Medical Inc., Seoul, Korea) was connected to the last stopcock. The distal tip of this infusion line was connected to a spinal needle (Spinal Needle, 22 G × 89 mm, Hakko Co., Ltd., Nagano-ken, Japan) and the needle-tip was submerged 1.0 cm into distilled water. A thin layer of oil was spread on the water-surface to prevent natural evaporation. The level of tip syringe was maintained at the same height as the surface of water in a sampling glass before the initiation of TCI. All infusion assemblies were carefully prepared to be filled with distilled water without air.
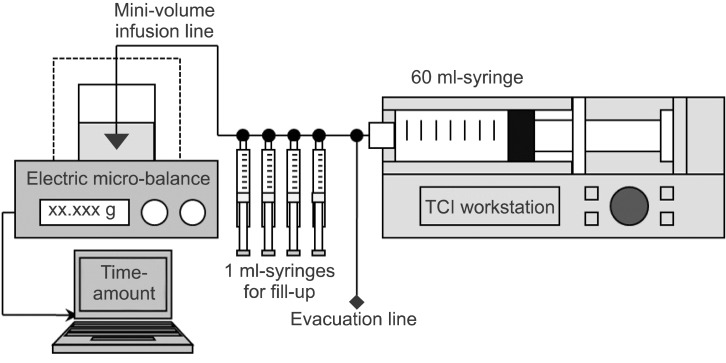
Schematic diagram for the experimental corrections of the wrong target-controlled infusions (TCI) following false selections of emulsion concentration of propofol.
The TCI was started using 1.0% virtual emulsion with wrong setting to 2.0% (FALSE1-2) or using 2.0% virtual emulsion with false setting to 1.0% (FALSE2-1). These wrong TCI were corrected at 3 min after the start of infusion. Twenty-four TCIs of FALSE1-2 were randomly assigned to 2 different fill-up corrections a manual fill-up bolus was injected after achieving a pseudo-steady state of equilibrium following a test-increase (FILLequi, n = 12) or if the test-increase was overridden to the manual fill-up bolus without waiting for the equilibrium (FILLover, n = 12). The equilibrium state of this study was considered as a situation when Ceff became to be equal to the plasma concentration (Cp). Another 24 TCIs of FALSE2-1 were randomly assigned into two different evacuation corrections and were performed during targeting Ceff (EVACeff, n = 12) or after switching to targeting Cp (EVACpl, n = 12). During the evacuations, the TCI continued but the infusate was directed to atmosphere and not delivered to the sampling glass. The durations of evacuation which was the context sensitive decrement time (Csdt) of 50% of Ceff and Cp at 3 min, were calculated using 'Csdt' library of 'PKPD Tools for Excel' (Add-In program was available at http://pkpdtools.com/doku.php/downloads:start, April, 2013). The sequences of each correction procedure are summarized in Table 1 and 2. The duration of the emulsion replacement was limited to 1 min. Thereafter, TCI was maintained until the end of infusion alarm was triggered after the fill-up correction or until the end of infusion alarm for second syringe was triggered after the evacuation correction. Randomizations of this study were performed using the Microsoft® Excel randomization function. The experiment was discarded and started again in cases of fluid leakage from the infusion assembly and air delivery into sampling glass on visual inspection.

Time Courses of the Procedures of Fill-up Corrections at the Time (Time) from the Start of Correction during Wrong Target-controlled Infusion of 1.0% Propofol Following False-setting to 2.0% Propofol

Time Course of the Procedures of Evacuation Corrections at the Time (Time) from the Start of Correction during Wrong Target-controlled Infusion of 2.0% Propofol Following False-setting to 1.0% Propofol
During every TCI, the weights of delivered infusate were measured using an electric micro-balance (FX-300i, A&D Co, Ltd, Republic of Korea) with 0.001 g sensitivity and 1 s stabilization time. Data were saved in a Microsoft Excel® spreadsheet as a hard disk using RS232 interface software (RrKey Ver. 1.34, A&D Co, Ltd., Republic of Korea) with 1 s data saving interval. Zero calibrations were done before each measure and the weight was converted to volume delivery assuming a conversion of 1 g of distilled water equaling 1.0029 ml. Water temperature was maintained within 23-25℃. The saved data-file was converted into a file formatted as 'time' vs. 'unit infusion rate' columns. Then, the pharmacokinetic/pharmacodynamic software (STANPUMP©, written by Steven L. Shafer, Palo Alto, CA, USA) read this 'drg' file using solution-specific command line arguments and external kinetic files of 1.0 and 2.0% emulsion and reproduced the actual time courses of Cp and Ceff.
Ceff at 3 min (Ceff-3min) after the start of TCI and the time to normalize within ± 5% of target concentration (T±5%), as the primary end-points of this experiment, were compared to evaluate the effectiveness between the methods of correction of each wrong TCI. Data are expressed as mean ± SD. Continuous variables between corrections were compared using an independent t-test. A value of P < 0.05 was considered significant. Statistical calculations were performed using SPSS 13.0 for windows (SPSS Inc, Chicago, IL, USA).
Results
The Ceff-3min after the start of TCI were not significantly different between the sub-groups of each wrong TCI (P = 1.000) (Table 3). Time courses of the reproduced actual concentration of propofol are illustrated in Fig. 2 and 3. Data were expressed until 30 min after the start of infusion. Gray bands indicate the range of ± 5% of the target concentration.
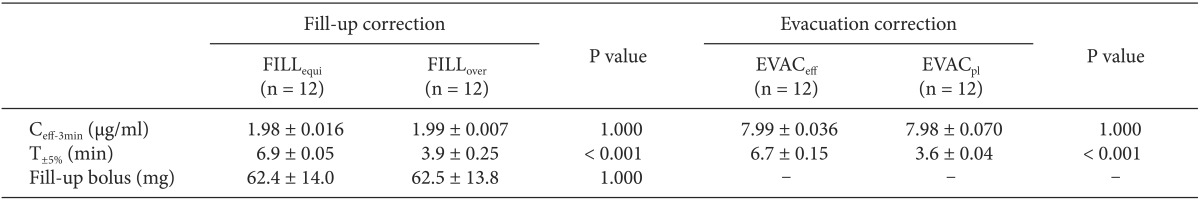
The Fill-up Corrections for the False-setting of 1.0% to 2.0% Propofol were Performed after the Equilibrium (FILLequi), or While Overriding (FILLover). The Evacuation Corrections for False-setting of 2.0% to 1.0% Propofol were Performed during Targeting Effect-site Concentration (EVACeff), or after Switching to Targeting Plasma Concentration (EVACpl). All Corrections were Made at 3 min after the Start of Infusions

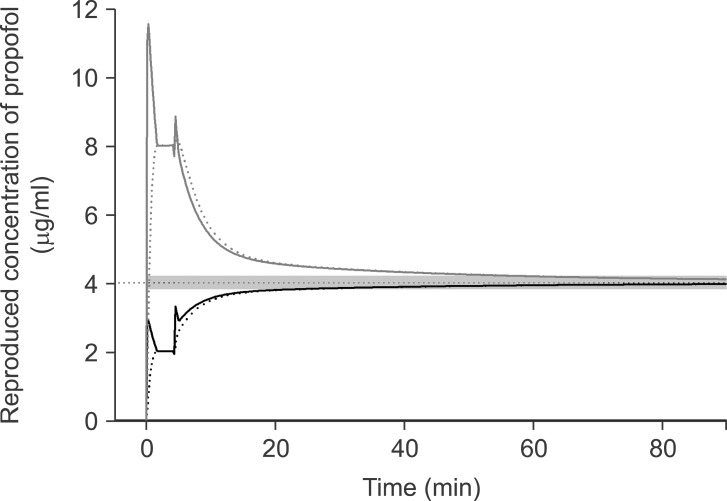
The reproduced actual plasma (solid lines) and effect-site (dotted lines) concentration during targeting 4.0 µg/ml of effect-site concentration using 1.0% virtual emulsion with false setting to 2.0% propofol, and the fill-up corrections were performed after achieving the equilibrium (A) or overriding together (B). Gray bands indicate the range of ± 5% of the target concentration.

The reproduced actual plasma (solid lines) and effect-site (dotted lines) concentration during targeting 4.0 µg/ml of effect-site concentration using 2.0% virtual emulsion with false setting to 1.0% propofol, and the evacuation corrections were performed during targeting effect-site concentration (A), or after switching to targeting plasma concentration (B). Gray bands indicate the range of ± 5% of the target concentration.
In FALSE1-2, the test-increase of target to 6.0 µg/ml led to Ceff increase to 2.98 ± 0.03 µg/ml during the fill-up corrections of FILLequi, and the calculated fill-up amount was 62.4 ± 14.0 mg. Therefore, 3.1 ± 0.7 ml of virtual infusate was manually injected, which increased Ceff to 4.24 ± 0.33 µg/ml (Fig. 2A). During the fill-up corrections of FILLover, the calculated fill-up amount was 62.5 ± 13.8 mg which override the test-increase and led Ceff to be overshot to 5.4 ± 0.02 µg/ml (Fig. 2B). T±5% of FILLover was significantly shorter than that of FILLequi (P < 0.001) (Table 3).
During the evacuation corrections, EVACeff led Ceff to 4.0 ± 0.02 µg/ml after 3.85 min of evacuation, then Ceff decreased to 3.2 ± 0.02 µg/ml and Cp also decreased to 2.7 ± 0.03 µg/ml during the drug replacement (Fig. 3A). EVACpl led Cp to 4.0 ± 0.03 µg/ml after 2.88 min of evacuation, then Ceff decreased to 3.9 ± 0.04 µg/ml and Cp decreased to 3.3 ± 0.08 µg/ml during the drug replacement (Fig. 3B). T±5% of EVACpl was significantly shorter than that of EVACeff (P < 0.001) (Table 3).
Discussion
The wrong TCI following false-setting to higher emulsion concentration of propofol could be effectively corrected using the fill-up method during targeting Ceff, and the false setting to lower concentration could be corrected using the evacuation method after switching to targeting Cp of propofol.
Propofol is known to have a linear pharmacokinetic [5]. Therefore, TCI with wrong settings between 1.0 and 2.0% emulsion concentrations have shown double or half of the target concentration like the results of this study. These wrong selections could be easily detected or possibly neglected during the early phase of anesthesia induction. When the emulsion concentration is falsely selected to higher concentration, the loss of consciousness (LOC) will be delayed or hardly induced. When a lower concentration is falsely selected, the patient will show a faster LOC or more hemodynamic depressions. Therefore, the simulation scenario of correction at 3 min after the start of infusion was choosen.
During preliminary experiments before this study, we tried to correct the wrong TCI due to a simple replacement to the correct emulsion concentration which was identical to a starting concentration. But, in order to normalize Ceff to be within ± 5% of the target, it took 19.5 min for the false setting of 1.0 to 2.0% propofol and 54.4 min for the false setting of 2.0 to 1.0% (Fig. 4). In addition, the TCI could not provide accurate information on the predicted concentrations during the period of normalization. Moreover, it might become more confused if we alter the target concentration during this normalization period. Therefore, we investigated the correction methods based on the pharmacokinetic and pharmacodynamic of propofol in order to normalize rapidly and effectively. The sequences of each correction were as followings; (1) estimation of the amount to fill-up or the duration to evacuate (2) correction (3) emulsion replacement to the correct concentration.
The reproduced actual plasma (solid lines) and effect-site (dotted lines) concentration during targeting 4.0 µg/ml of effect-site concentration using 1.0% virtual emulsion with false setting to 2.0% propofol (black lines), or using 1.0% virtual emulsion with false setting to 2.0% (gray lines). The simple corrections were performed at 3 min after the start of infusion. Gray bands indicate the range of ± 5% of the target concentration.
For the fill-up corrections, we anticipated that the amount of propofol needed to increase 2.0 µg/ml to 4.0 µg/ml might be the same as that needed to increase 4.0 µg/ml to 6.0 µg/ml. After estimating the amount for fill-up using a test increase of 4.0 µg/ml to 6.0 µg/ml, we waited until the pseudo-steady state of equilibrium in order to validate the correction method. Then the fill-up bolus led Ceff to 4.24 µg/ml, which was about 6% higher than expected. However, in clinical settings, it is not a short period to wait until the pseudo-steady state of equilibrium. Therefore, the method of overriding correction could more rapidly normalize the wrong TCI. The overshot of Ceff might be anticipated, but the maximum Ceff after the fill-up bolus was 5.41 µg/ml.
The TCI workstation used in this study shows Csdt for Ceff rounding off below the decimal point. For example, it displays Csdt between 1.45 min to 2.44 min as 2.0 min. Therefore, we used a simulation software (PKPD Tools for Excel) to calculate accurate durations of evacuation for Cp and Ceff. The evacuation correction was performed based on the time point where the time required to decrease Cp and Ceff to a certain degree would be identical and irrelevant to maintaining concentrations, but relevant to the duration of infusion [7]. Csdt of 8.0 µg/ml to 4.0 µg/ml at 3 min of TCI would be identical to that of 4.0 µg/ml to 2.0 µg/ml. Eventually, Cp and Ceff decreased to 4.0 µg/ml after Csdt-Cp and Csdt-Ceff. But the Cp decreases faster than the Ceff after cessation of infusion [8,9]. Therefore, during EVACeff, Cp would be lower than Ceff after Csdt-Ceff, but the wrong TCI would regard this status as a pseudo-equilibrium state. Accordingly, the Cp could be over-predicted around the emulsion replacement. However during EVACpl, the TCI system would not miss the time course of Cp and more accurately infuse the deficit during the drug replacement.
However, there were some limitations in our experiment. First, as discussed earlier in our previous report [3], the corrections were performed on the basis of the concentration of central compartment (Cp) and Ceff. But the pharmacokinetic model of this study was not a one compartment model but a three compartment model. Therefore, the correction methods were not perfect, even though they were rapid. Simulations of the concentration of three compartments using PK/PD software showed that the TCI following falsely selected to higher concentration setting and predicted the concentrations of the peripheral compartments to be higher as well as Cp (Fig. 5). These differences at the peripheral compartments are considered to be the cause of the small amount of over-correction after the manual bolus during the fill-up correction and led to a slight decrease of Ceff-rep after the drug replacement. On the contrary, TCI following falsely selected to lower concentration predicted the concentration of the peripheral compartments to be lower as well as Cp. Therefore, the Ceff-rep after the drug replacement slightly increased, then approached to the target. However, the mean deviations from the target were within the range of ± 5.0%. Second, some clinicians might consider the correction methods of this study to be more complicated than just imaging the predicted concentrations to be double or half of the concentrations displayed on the TCI workstation. And this method could be useful for a short duration of infusion but might be not suitable for a long duration of anesthesia. Third, in this study, we used distilled water as virtual emulsion. Therefore, we did not replace the emulsion to correct concentrations, and waited just 1 min to simulate the syringe replacement time in clinical circumstances. Also, the gravimetrically measured amount was converted into the correct concentration of propofol during the simulation.

The nominal (dotted lines) and reproduced actual (solid lines) predicted plasma concentrations at the central compartment, C1 (upper), and at two peripheral compartments, C2 (middle), and C3 (lower) targeting 4.0 µg/ml of effect-site concentration, and the false setting of 1.0% virtual emulsion to 2.0% was corrected after achieving the equilibrium state. Gray bands indicate the range of ± 5% of the target concentration.
The purpose of this study was to investigate the risk management for an erroneous situation during TCI. There is no doubt that it is essential to pay attention to the preparation of TCI. Also the wrong selection of the drug emulsion concentration may not be frequent in clinical settings. However, if we know how to handle possible error situations in advance we will be able to effectively deal with those issues.