Introduction
Processed electroencephalography (EEG) is a reliable measure of anesthetic drug effects [1-3]. As processed EEG variables, 95% spectral edge frequency (SEF95), canonical univariate parameter (CUP), bispectral index (BIS), and approximate entropy (ApEn) have been studied in a variety of clinical settings to evaluate the central nervous system effects of sevoflurane [2,4,5]. In a previous study, ApEn demonstrated better interindividual and intraindividual baseline stability than SEF95 and CUP [6,7]. In addition, in our previous studies, ApEn was determined to be an appropriate processed variable for assessing the effects of remifentanil and sevoflurane on the central nervous system [2,3]. However, ApEn demonstrates some drawbacks, including a dependency on record length that requires a time series with Ōēź 100 points and poor relative consistency [8,9].
Temporal linear mode complexity (TLMC) quantifies the complexity of the temporal linear modes used in single-channel EEG. TLMC focuses on the global structure of the phase space that can be reconstructed from the trajectory of a short time series. In particular, TLMC is algorithmically independent of record length (Appendix 1). In practice, we have demonstrated the appropriateness of TLMC as a surrogate measure of the effects of remifentanil on the central nervous system using a combination effect and tolerance model [10]. Despite the potential uses of TLMC, little is known about the appropriateness of TLMC as a surrogate measure of the effects of hypnotic agents.
The aims of this study are to compare the stability, correlation with end-tidal sevoflurane, and area below the effect vs. time curves of TLMC and ApEn during sevoflurane anesthesia and to characterize the time course of the effect of sevoflurane on the central nervous system using a sigmoid Emax model.
Materials and Methods
Patient enrollment
After obtaining written informed consent, we enrolled 20 patients (9 women and 11 men; mean age: 62.1 ┬▒ 12.3 years; mean weight: 57.2 ┬▒ 7.9 kg; mean height: 158.7 ┬▒ 9.2 cm) who were scheduled to undergo spinal surgery. All patients were classified as American Society of Anesthesiologists physical status 1 or 2. Patients were excluded from the study if they demonstrated abnormal preoperative renal and hepatic function, had a history of drug or alcohol abuse or psychiatric disorders, or a body weight that was not within 30% of ideal.
Study procedure
All patients were required to fast starting the midnight before surgery without receiving any premedications. Once in the operating room, patients were monitored using electrocardiography, pulse oximetry, end-tidal carbon dioxide partial pressure monitoring, and noninvasive blood pressure monitoring (Datex-Ohmeda S/5; Planar Systems, Inc., Beaverton, USA). Patients were administered an intravenous bolus of 2 mg/kg propofol to induce unconsciousness, and anesthesia was induced by increasing the vapor setting of sevoflurane to 3 vol% via a facemask while delivering 100% oxygen using a circle system. Tracheal intubation was facilitated by administering 0.6 mg/kg rocuronium. The lungs of the patients were then ventilated with a 1 : 2 oxygenair mixture, and the ventilation rate was adjusted to maintain the end-tidal carbon dioxide partial pressure between 35-45 mmHg. The end-tidal sevoflurane concentration was measured using a Datex-Ohmeda gas analyzer (Planar Systems, Inc., Beaverton, USA). Neuromuscular blockade was reversed by administering pyridostigmine and glycopyrrolate at the end of surgery.
EEG analysis
The EEG activities of 4 monopolar channels (F3, F4, P3, and P4 referenced by A2; the international 10/20 system) were recorded during the maintenance period using QEEG-8 (LXE3208; Laxtha Inc., Daejeon, Korea) at a sampling frequency of 256 Hz. The skin at the positions of the EEG electrodes was washed with alcohol to maintain impedance < 10 k╬®. Data were stored on a hard disk for the subsequent off-line calculation of TLMC and ApEn. Raw EEG signals were filtered between 0.5-50 Hz and divided into 10-second epochs without overlap.
Only EEG data obtained during the periods of surgery in which electrocautery was not used were used in further analyses. After the first screw was fixed into bone, the end-tidal sevoflurane concentration was maintained at 2.0 vol% of the vapor setting. When the end-tidal concentration of sevoflurane did not demonstrate any further changes at 2 vol%, the sevoflurane vapor setting was increased until the end-tidal sevoflurane concentration was 4.5 vol%, and then the sevoflurane vapor setting was decreased again. This cycle was performed in each patient.
In a pilot study, the burst suppression of raw EEG or systolic blood pressure < 80 mmHg was occasionally observed when the end-tidal sevoflurane concentration was > 4.5 vol%. Therefore, in this study, 4.5 vol% was considered the maximal end-tidal sevoflurane concentration. If necessary, ephedrine or atropine was administered to maintain systolic blood pressure > 80 mmHg and the heart rate > 45 beats/minute during the administration of anaesthesia.
To calculate ApEn, the length of the epoch (N) was 2560, the number of previous values (m) used to predict subsequent values was 2, and the filtering level (r) was 10% of the standard deviation (SD) of the amplitude. To calculate TLMC, the embedding dimension was 5 and the delay number was 7. No smoothing technique was applied during the calculation of TLMC or ApEn. Serious artifacts were excluded by determining the maximum amplitude of each epoch. If the amplitude was > 200 mV, the epoch was excluded. The effectiveness of artifact rejection was manually confirmed. Artifact rejection and analysis of each EEG parameter was performed by a single experienced analyst.
Stability of TLMC and ApEn
The coefficients of variation (CVs) of the median baseline values (median E0), median maximal values (median Emax), and differences between the individual median E0 and median Emax values (E0 - Emax) were calculated to determine the stability of TLMC and ApEn.
Correlation between TLMC, ApEn, and end-tidal sevoflurane concentration
We determined the end-tidal sevoflurane concentration and two processed EEG values in order to calculate the Spearman correlation coefficients. To determine the trends of the ApEn and TLMC values, curves were generated using the coarse locally weighted scatterplot smoothing (LOWESS) function in Prism 6 for Windows (version 6.01; Graphpad Software Inc., San Diego, CA, USA).
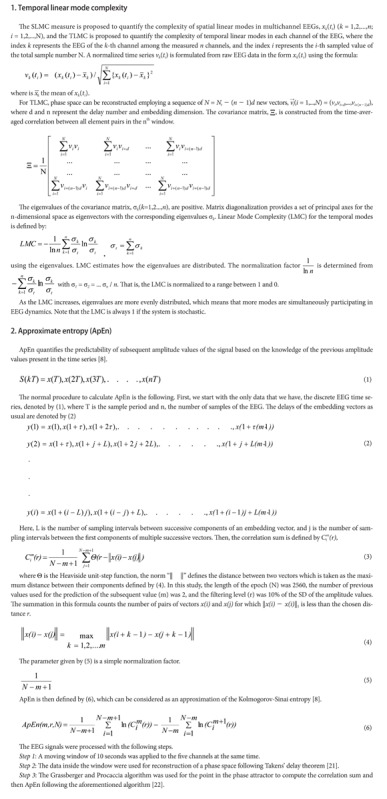
Areas-under-the-effect vs time curves of TLMC and ApEn during the administration of sevoflurane anesthesia
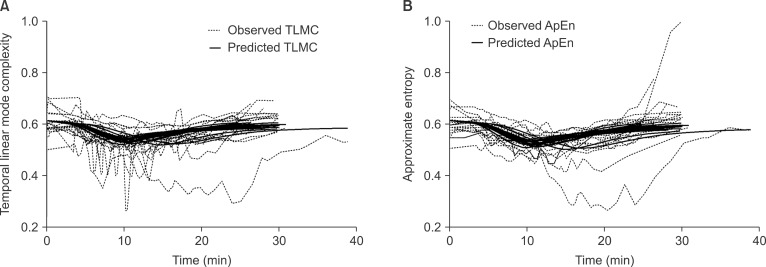
Effect vs. time curves were drawn for both EEG metrics. Areas below the effect vs. time curves, representing the decrease in central nervous system activity during sevoflurane anesthesia (AUCeffect), were calculated (Fig. 1). These areas were calculated by linear trapezoidal integration using Phoenix WinNonlin 6.0 (Phoenix, Mountain View, CA, USA).
Pharmacodynamic modeling
The procedures of NONMEM VII level 2 (ICON Development Solutions, Ellicott City, MD, USA) employed in pharmacodynamic modeling were the PRED form and first-order conditional estimation (Appendix 2). Inter-individual random variabilities of pharmacodynamic parameters were modeled using a log-normal. Diagonal matrices were estimated for the various distributions of ╬Ę, where ╬Ę represented inter-individual random variability with a mean of zero and a variance of Žē2. Additive, constant coefficient of variation, and combined additive and constant coefficient of variation residual error models were evaluated during the model building process. NONMEM computed the minimum value of the objective function, a statistic equivalent to the -2 log likelihood of the model. An ╬▒ level of 0.05, which corresponds to a reduction in the objective function value of 3.84 (chi-squared distribution, degree of freedom: 1, P < 0.05), was used to discriminate between hierarchical models [11]. In addition to obtaining minimal objective function values, improvements in diagnostic goodness-of-fit plots were used to evaluate different models. R software (version 2.13.1; R Foundation for Statistical Computing, Vienna, Austria) was employed to construct graphical model diagnostics. Covariate model-building was performed using manual covariate selection and covariates analyzed were age and sex. The effect-site concentrations over time can be calculated as the convolution between the end-tidal concentrations and the disposition function. The convolution was based on a 'connect the dots' approach previously used by Schnider and co-workers [12].

The relationship between the effect-site concentration of sevoflurane and, TLMC and ApEn values was evaluated using a sigmoid Emax model:
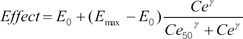
where Effect is the TLMC or ApEn value, E0 is the baseline TLMC or ApEn value when the vapor setting of sevoflurane was maintained at 2 vol%, Emax is the maximum possible sevoflurane effect on the TLMC or ApEn, Ce is the calculated effect-site concentration of TLMC or ApEn, Ce50 is the effect-site concentration associated with 50% of the maximal drug effect on TLMC or ApEn, and ╬│ is the steepness of the effect-site sevoflurane concentration vs. TLMC or ApEn relationship.
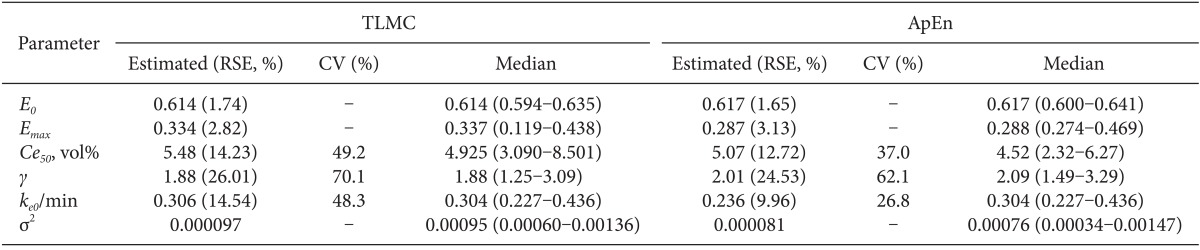
Non-parametric bootstrap analysis served to internally validate models (fit4NM 3.5.1, Eun-Kyung Lee and Gyu-Jeong Noh, http://www.fit4nm.org/download, last accessed: Oct 17, 2011) [13]. Briefly, 2,000 bootstrap replicates were generated by random sampling from the original dataset, with replacement. Parameter estimates were compared with median parameter values and the 2.5-97.5 percentiles of the nonparametric bootstrap replicates.
Results
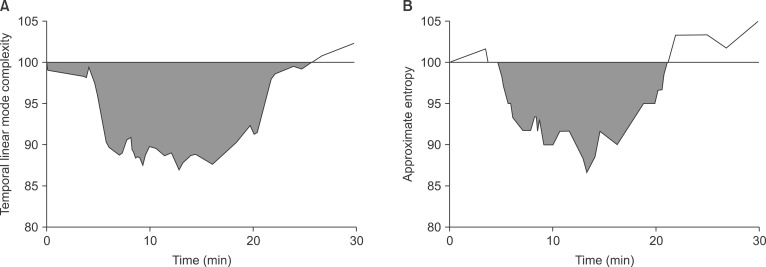
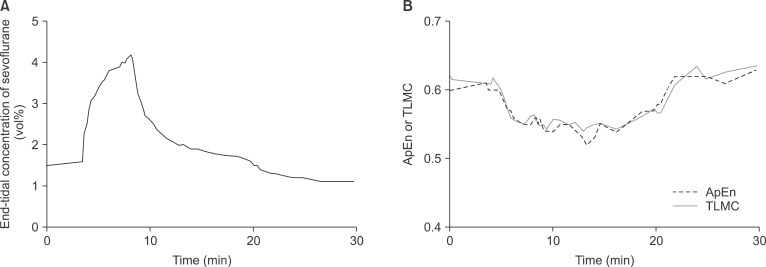
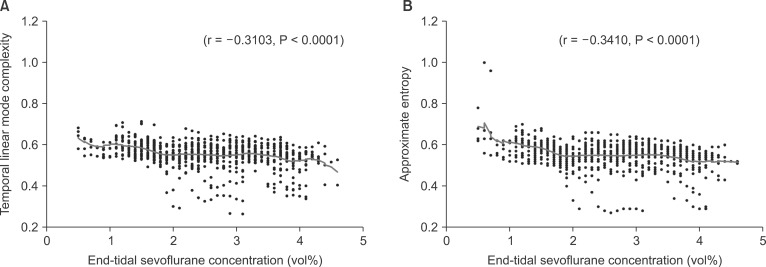
Data analysis was performed in all patients with almost artifact-free signal registration. The number of data points selected for TLMC and ApEn was 938 and the mean ┬▒ SD number per individual is 47 ┬▒ 6. With increasing sevoflurane concentrations, the TLMC and ApEn decreased (and vice versa) within a time delay (Fig. 2). The median baseline (E0), maximal (Emax) and individual median E0 minus Emax values of TLMC and ApEn are shown in Table 1. ApEn was slightly more stable than TLMC. Correlation between two EEG parameters and end-tidal sevoflurane concentration during sevoflurane anesthesia is depicted in Fig. 3. The mean ┬▒ SD values of TLMC and ApEn calculated from 10-sec segments of electroencephalographic signal from the P4 montage were 0.56 ┬▒ 0.06 and 0.55 ┬▒ 0.06, respectively. Coefficient of variation (CV) of TLMC and ApEn were 10.7% and 11.2%, respectively. The TLMC and ApEn showed statistically significant correlation with the concentrations of end-tidal sevoflurane (Fig. 3). The median AUCeffect of TLMC was slightly, but not significantly, higher than that of ApEn (median: 338.9 for TLMC and 246.5 for ApEn, P = 0.457). The pharmacodynamics of sevoflurane for TLMC and ApEn were well described by a sigmoid Emax model. Age and sex were not a significant covariate for pharmacodynamic parameters. The time course of TLMC and ApEn relationship for each subject are characterized by the pharmacodynamic model (Fig. 4). The population pharmacodynamic parameter estimates, inter-individual variability and median parameter values (2.5-97.5%) of the nonparametric bootstrap replicates of the sigmoid Emax models of sevoflurane are summarized in Table 2. The differences between structural parameter estimates and their median values of the nonparametric bootstrap replicates of the final models were small, which is indicating that the final models are appropriate to explain the pharmacodynamic characteristics of sevoflurane. Plotting TLMC and ApEn vs. end-tidal sevoflurane concentration revealed hysteresis (Fig. 5A and 5C), which were collapsed by introduction of an effect compartment (Fig. 5B and 5D).
Discussion
Temporal linear mode complexity showed similar inter-individual stability and AUCeffect, compared with approximate entropy. Also, TLMC and ApEn values were significantly correlated with effect-site concentration of sevoflurane. During anesthesia with high sevoflurane concentrations, the EEG parameters showed more regular (i.e., lower TLMC and ApEn values) than at lower sevoflurane concentrations. TLMC was comparable with ApEn as a surrogate measure to quantify the effect of sevoflurane on the central nervous system. Time course of the effect of sevoflurane was well described with a sigmoid Emax model.
The electroencephalographic waveform may include a complex of regular sinusoidal waves, irregular spikes or spindles [14], which is indicating that it is mixed with signal and noise. The stability of TLMC in the presence of noisy fluctuation, and TLMC independence from data-length, were tested using various chaotic approaches such as the Lorenz, Roessler, and Henon protocols, and performances were compared with other well-known measures appropriate in analysis of long chaotic time-series [15]. The characteristics of TLMC allow TLMC data to be highly correlated with slowly varying parametric forces in non-stationary time-series. Also, TLMC data can be extracted over short intervals to maintain the stationary condition in slow parameter-driven non-stationary biological systems. Biological signals emitted during sevoflurane anesthesia may be potentially non-stationary, which may explain the similar performance of TLMC as a surrogate measure of sevoflurane effect on the central nervous system in this study.
The bispectral index (BIS, Aspect Medical Systems, Newton, MA, USA) uses a form of processed cortical EEG to quantify the effect of hypnotic agent, which has been well validated as a surrogate measure of anesthetic-induced sedation and hypnosis in patients [16,17]. However, it was well known that BIS did not show the good correlation with effect-site concentration of opioid [18,19], indicating that BIS was not a sensitive surrogate measure of opioid effect. On the other hand, ApEn and TLMC showed the good performance for the assessment of the remifentanil effect on the electroencephalogram in previous studies [3,10]. Hence, TLMC can be used to quantify the effect of anesthetic agents, including hypnotics and opioids, on central nervous system. Also, TLMC was more quickly (about 40 times) calculated than ApEn (61.4 MB of raw EEG data: 19 s for TLMC, 752 s for ApEn).
In a previous our study, hysteresis was not observed between end-tidal concentration of sevoflurane and ApEn, which was explained by the fact that end-tidal concentration of sevoflurane was only measured in the ascending limb [2]. However, it was measured in both ascending and descending limbs in this study, resulting in collapse of hysteresis using effect-site concentration of sevoflurane (Fig. 5). Since hysteresis is a result of disequilibrium, it is most prominent when sevoflurane concentrations are rapidly changing and it disappears at steady state.
Pharmacodynamic parameter estimates for ApEn in this study was different from those of our previous study (E0 = 0.91, Emax = 0.28, Ce50 = 1.36 vol%, ╬│ = 1.27, ke0 = 0.67 /min) [2], which was caused by different dosing strategy. In a previous study, sevoflurane inhalation was induced by increasing the vapor setting of sevoflurane by 1 vol% up to 8 vol% and the range of end-tidal sevoflurane concentration was 0-5.6 vol% (0.6-4.5 vol% in this study). Difference between maximal and minimum end-tidal concentration of sevoflurane in previous study was approximately 1.5 times greater than that in this study. Also, E0 between two studies was significantly different (previous study: baseline ApEn value when no sevoflurane present, this study: baseline ApEn value when the vapor setting of sevoflurane was maintained at 2 vol%). When pharmacokinetic or pharmacodynamic parameter estimates are compared with different models in a same drug, dosing strategy, sampling points and characteristics of patients enrolled should be considered.
In this study, TLMC and ApEn values of the P4 montage were selected. In the previous work, P4 also showed a higher ratio of average maximal electroencephalographic effect to interindividual baseline variability for ApEn and lower coefficient of variation (CV) of the baseline values [3]. Also, the regions of decreased relative cerebral glucose metabolic rate during sevoflurane anesthesia were the visual cortex, posterior parietal association area, primary somatosensory area, and premotor area [20]. These regions are similar with P4 montage in 10-20 international system.
Exploration of possible covariate relationships was done by the generalized additive modeling (GAM) procedure. There was no significant covariate for parameters (E0, Emax, Ce50, ke0, and ╬│). Hence, the final pharmacodynamic models for TLMC and ApEn were identical to the basic models in this study.
There were several issues to be considered as limitation of this study. First, one cycle including each ascending and descending limb was performed in each patient. This may lead to collect insufficient data to characterize the time course of the effect of sevoflurane on the central nervous system. Whenever an electrocautery was used, severe noises were observed, and TLMC and ApEn values calculated from raw EEG segments including these noises could be inaccurate. Hence, it is necessary to measure raw EEG without noise, but it is difficult to obtain several cycles without use of an electrocautery in clinical situation. However, it was little affected by comparing the performance of TLMC and ApEn as a surrogate measure of sevoflurane effect. Second, range of the investigated sevoflurane concentrations was relatively narrow. However, range selected (1.5-4.5 vol% of end-tidal concentration of sevoflurane) was considered to avoid patient awareness at lower levels and excessive cardiovascular depression at higher levels.
In summary, temporal linear mode complexity was comparable with approximate entropy as a univariate EEG descriptor of the sevoflurane effect. A sigmoid Emax model well described the pharmacodynamics of sevoflurane for TLMC and ApEn.