The EC50 of remifentanil to minimize the cardiovascular changes during head holder pinning in neurosurgery
Article information
Abstract
Background
During neuroanesthesia, head holder pinning commonly results in sympathetic stimulation manifested by hemodynamic changes, such as increased heart rate and arterial blood pressure. Remifentanil has been used successfully to control acute autonomic responses during neurosurgical procedures. The objective of this study was to determine effect-site concentration of remifentanil for suppressing the hemodynamic response to head holder pinning with the probability of 50% (EC50).
Methods
Forty-one ASA physical status I or II patients, between the ages of 20-70, who were scheduled for neurosurgery were recruited into this study. After arrival in the operating room, standard monitoring was applied throughout the study, which included a bispectral index monitor. Both propofol and remifentanil were administered by Target-control infusion device. The Dixon "up-and-down" sequential allocation method was used to determine the EC50 of remifentanil.
Results
The EC50 of remifentanil was 2.19 ± 0.76 ng/ml by the turning point estimate (TPE). In probit analysis, EC50 was 2.42 ng/ml (95% CI : -0.62-4.66) and EC95 was 5.70 ng/ml (95% CI : 4.02-67.53). The EC50 estimator comes from isotonic regression is 2.90 ng/ml (95% CI : 1.78-3.65). The EC95 estimator comes from isotonic regression is 4.28 ng/ml (95% CI : 3.85-4.41).
Conclusions
This study showed that EC50 of remifentanil was 2.19 ± 0.76 ng/ml by TPE. EC50 was 2.42 ng/ml (95% CI -0.62-4.66) in probit analysis, as back up analysis. The EC50 estimator comes from isotonic regression is 2.90 ng/ml (95% CI : 1.78-3.65).
Introduction
There are a lot of noxious stimulations during surgical procedures that provoke patients' pain responses, including increase of heart rate, blood pressure, and movement. Pain responses require prompt adjustments in the depth of anesthesia and analgesia. Under those circumstances in which abrupt hemodynamic changes occur, those patients who have cerebral hemorrhage, vascular aneurysm or hydrocephalus could be exposed to an increased intracranial pressure or to a risk of rebleeding. During neuroanesthesia, there are some periods of intense stimulation, such as laryngoscopy and intubation, head holder pinning, scalp incision, and craniotomy. Head holder pinning is one of the most intensive stimuli, during neuroanesthesia [1]. It commonly results in sympathetic stimulation, which manifests as increased heart rate and arterial blood pressure. Several drugs, such as β-blockers, calcium channel blockers, opioids, and intravenous anesthetics, have been used to reduce the hemodynamic responses evoked by head holder pinning.
Noxious stimulation periods used to be followed by periods of an absence in noxious stimulation, such as preparation of the surgical site. In these periods, patients' sympathetic tone was decreased, causing bradycardia and hypotension. These circumstances require drugs that have produced early onset of their effect and have a rapid metabolism. Remifentanil has a rapid onset and offset feature. Remifentanil's ester structure renders it susceptible to hydrolysis by blood and tissue-nonspecific esterases, which results in rapid metabolism and rapid reduction of blood concentrations after cessation of infusion. Remifentanil is a drug that is suitable for use in the Target-control infusion (TCI) during neuroanesthesia [2] and has been used successful in the control of acute autonomic responses during neurosurgical procedures. The objective of this study was to determine effect-site concentration of remifentanil for suppressing the hemodynamic response to head holder pinning with the probability of 50% (EC50) or 95% (EC95). To determine those concentrations, Dixons up-and-down methods (UDM) were used. UDM experiments are a simply performed type of sequential design for dose finding at the 50th quartile. UDM has been known for its advantages of smaller sample size and reasonable simple study performance. Several target dose estimators have been proposed for UDM studies. Those estimations may be classified as parametric or nonparametric, depending on whether a probability distribution of data is assumed or not assumed. In this study, 3 estimators was proposed for EC50 or EC95 and compared with each other. The estimators include turning point estimator, probit estimator, and isotonic regression estimator.
Materials and Methods
After obtaining the approval of our Institutional Review Board and written informed consent from the patients, 41 patients with American Society of Anesthesiologists physical status I or II, between the ages of 20-70 years, who were scheduled for neurosurgery were recruited. Patients who didn't have allergies to anesthetic drugs and who didn't take cardiac or antihypertensive medications were involved. Patients who take nimodipine therapy with acute subarachnoid hemorrhage to prevent vasospasm were not involved. Patients with intracranial pathology causing an alteration of consciousness were not included in this study. All patients fasted for 8 hours before surgery. Thirty minutes before the induction of anesthesia, patients were premedicated intramuscularly with glycopyrrolate 0.2 mg. After arrival in the operating room, patients underwent standard monitoring throughout the surgery, which included noninvasive arterial blood pressure (NIBP), electrocardiography (ECG), heart rate (HR), pulse oxymeter, and a bispectral index (BIS) monitor.
Both propofol and remifentanil were administered by a TCI device (Asan pump 2.0.7 version, Bionet, Korea). Anesthesia was induced by target-controlled propofol and remifentanil infusion with Marsh and Minto model for each with 100% oxygen. Both effect-site concentrations of propofol and remifentanil for intubation were 3.0 µg/ml and 3.0 ng/ml, respectively. Rocuronium of 0.6 mg/kg was administered intravenously for intubation. Arterial cannulation was performed at radial artery for continuous blood pressure monitoring. Propofol effect-site concentration was maintained with 2.0 µg/ml during the head holder pinning. At least 5 minutes after adjusting the concentration of drugs, head holder pinning was applied. Mean arterial pressure (MBP) and heart rate (HR) as hemodynamic indicators were recorded at the following times: B; baseline (Arrival at operation room), BI; before intubation, I1; one minute After intubation, BH; before head holder pinning, H; head holder pinning, H1,2,3; 1 minute interval up to 3 minutes after head holder pinning.
The Dixon "up-and-down" sequential allocation method was used to determine the EC50 of remifentanil. A logarithmic dose interval of 0.1 was used. This resulted in targeted effect-site concentrations of 4.46, 3.55, 2.82, 2.24, 1.78, 1.41, 1.12, and 0.89 ng/ml. The first patient received an effect-site concentration of 3.55 ng/ml remifentanil. Success or failure of blocking hemodynamic responses was determined by maximal HR and MBP after head holder pinning compared with baseline value. Failure was defined as a patient that showed an increase of either HR or MBP ≥ 20%. Then, effect-site concentration of remifentanil administered to the next patient was increased to one step above. Otherwise in the case of success, the effect-site concentration given to the next patient was decreased to one step below.
During or after head hold pinning, when HR or MBP increased greater than 20% of baseline, remifentanil concentration was increased immediately and administrated antihypertensive or beta blocking drugs as occasion required. Bradycardia (HR < 50 beats/min) was treated with atropine 0.5 mg. A decrease in systolic pressure below 80 mmHg was treated with ephedrine in 5 mg increments. Side-effects associated with remifentanil, such as muscle rigidity interfering with ventilation and adverse hemodynamic consequences, were investigated and treated accordingly. BIS was monitored to prevent the awareness during anesthesia. If the BIS value was more than 60 with propofol infusion with 2 µg/ml concentration, the study was stopped and propofol concentration was increased to maintain BIS value at 40-60, immediately. The patients who received rescue drugs (eg, atropine, ephedrine) or who could not maintain the adequate BIS value with propofol 2 µg/ml before head holder pinning were excluded from the study.
The involved patients were divided into one of 2 groups, success or failure, based on their response to the head holder pinning. The demographic data, BIS, and hemodynamic changes are compared between the groups. Statistical analysis was performed using a t-test or repeated measures of ANOVA.
EC50 or EC95 was estimated in 3 ways. First, EC50 was calculated by turning point estimator (TPE) as the nonparametric method. The values of pairs of successive assigned doses at which the observed response changed direction (pair reversals) are averaged [3]. The turning point estimator is commonly used in anesthesia UDM studies and has been used in a methods article on UDM in the anesthesia literature. Data was expressed as mean ± standard deviation. Second, EC50 or EC95 was estimated by logistic or probit regression analysis, as the parametric method. Many anesthesia UDM studies present a logistic or probit regression analysis of the data, as a so-called sensitivity or backup analysis using commonly available logistic or probit regression software. Third, EC50 or EC95 was estimated by isotonic regression estimators. There is an implicit assumption, that is, drug effect increases with increasing dose. This assumption can be used in a technique known as isotonic regression to estimate EC50 or EC95. Isotonic regression has favorable statistical properties [4]. At each assigned dose, an adjusted response probability is easily calculated by the pooled adjacent-violators algorithm (PAVA) as written as follows [5];
Derive the naive estimate of response rate for each dose level, Rk / Nk = p̂(xk) = p̂k.
Starting at the lowest dose, find the first adjacent pair of response rates that violate the ordering restriction p̂k ≤ p̂k+1. The weight for each response rate is the number of patients assigned to that dose, Nk.
Replace this pair by the average of p̂k and p̂k+1 weighted by the number of patients: pk̇ = pk̇+1 = (Nkp̂k + Nk+1p̂k-1) / (Nk + Nk+1), where the superscript star denotes a PAVA estimator.
Search the sequence for the next adjacent pair of doses with an order violation. Apply step 2 to create a weighted average.
Continue until no further order violations are noted.
If no such pair exists with an order violation, then assign the PAVA estimator pk̇ = p̂k at each dose k.
PAVA creates unique estimates pk̇ no matter what the starting point in the dose sequence is.
The estimator is the dose obtained by linear interpolation at 50% probability between the largest PAVA estimator ≤ 50% probability and the smallest PAVA estimator > 50% probability.
Results
Forty one patients were enrolled in this study. Demographic data regarding age, gender, height, and weight did not differ between success and failure group (Table 1). There are no significant differences in BIS changes, between the success and failure groups (Fig. 1). In this study, ephedrine or atropine was administered in 2 cases and those patients were excluded. Individual responses to head holder pinning, according to the up-and-down sequence in patients receiving target controlled effect site concentration of remifentanil, are shown in Fig. 2.
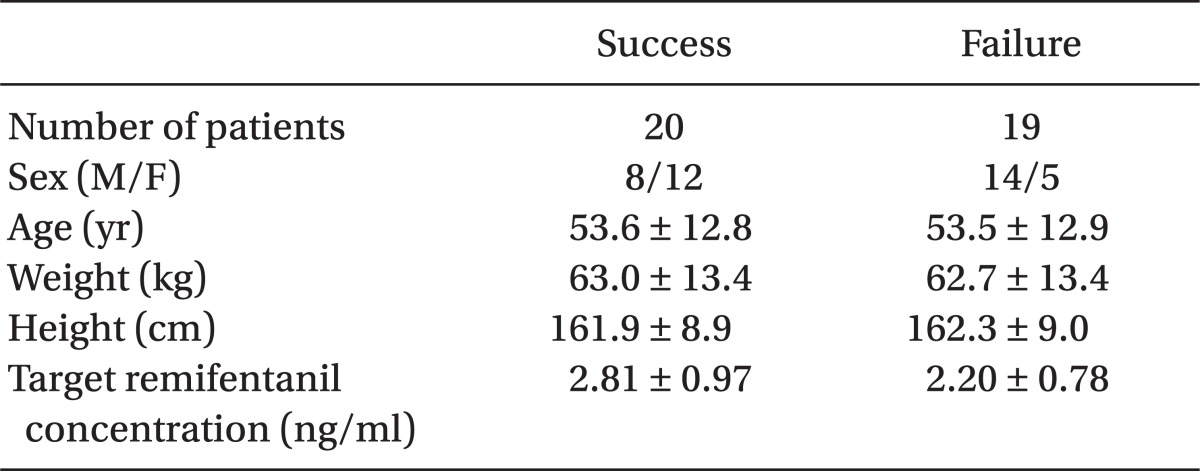
Demographic Data

The graph shows the sequential change of Bispectral index value (BIS) during anesthesia. S: Success group, F: Failure group, B: Baseline (Arrival at OP room), BI: Before intubation, I1: One minute After intubation, BH: Before head holder pinning, H: head holder pinning, H1, 2, 3: 1 minute interval up to 3 minutes after head holder pinning. *P < 0.05 when comparing groups. There is no difference between the groups.

Consecutive remifentanil effect-site concentrations in head holder pinning for EC50 determination. In the absence of either heart rate or MAP increasing > 20% (success), the effect-site concentration given to the next patient was decreased. Otherwise referred to as a failure, the effect-site concentration administered to the next patient was increased.
Sequential changes in mean blood pressure can be seen in Fig. 3. There are significant differences between the success and failure group at I1, BH, H, and H1. Sequential changes in heart rate can be seen in Fig. 4. There are significant differences between the success and failure group at H and H1.
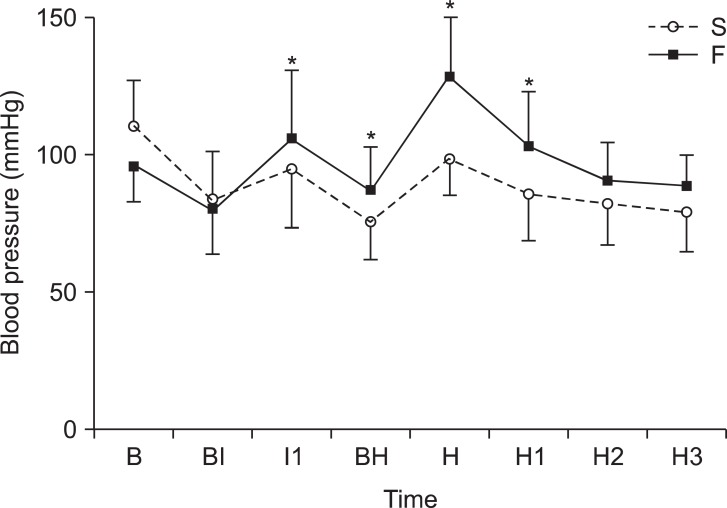
The graph shows the sequential change of mean blood pressure (MBP) during anesthesia. S: Success group, F: Failure group, B: Baseline (Arrival at OP room), BI: Before intubation, I1: One minute After intubation, BH: Before head holder pinning, H: head holder pinning, H1, 2, 3: 1 minute interval up to 3 minutes after head holder pinning. *P < 0.05 when compared between the groups.

The graph shows the sequential change of heart rate (HR) during anesthesia. S: Success group, F: Failure group, B: Baseline (Arrival at OP room), BI: Before intubation, I1: One minute After intubation, BH: Before head holder pinning, H: head holder pinning, H1, 2, 3: 1 minute interval up to 3 minutes after head holder pinning. *P < 0.05 when compared between the groups.
The EC50 of remifentanil was 2.19 ± 0.76 ng/ml by TPE. In the probit analysis, EC50 was 2.42 ng/ml and its 95% confidence interval (CI) was from -0.62 to 4.66 and EC95 was 5.70 ng/ml and its 95% CI was from 4.02 to 67.53 (Fig. 5). The PAVA adjusted probability was tabulated in Table 2. The PAVA-adjusted response shows monotonically increase of the probability of no response (Fig. 6). The EC50 estimator comes from isotonic regression is 2.90 ng/ml and its 95% CI was from 1.78 to 3.65. The EC95 estimator comes from isotonic regression is 4.28 ng/ml and its 95% CI was from 3.85 to 4.41.
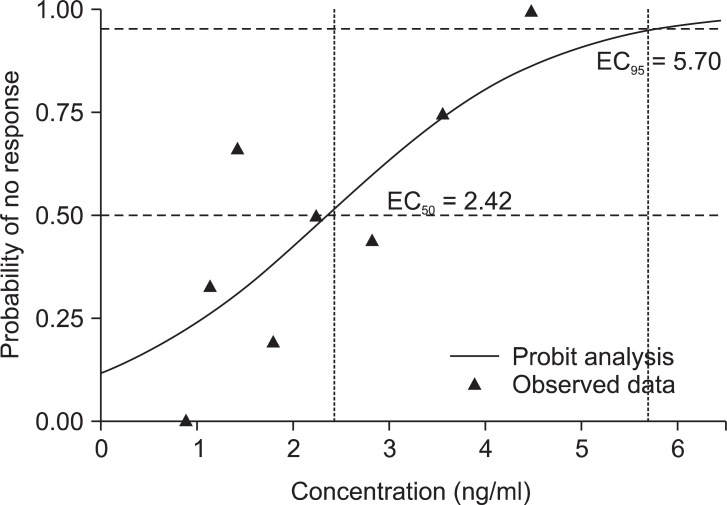
The graph shows probit analysis. In probit analysis, EC50 was 2.42 (95% CI -0.62-4.66) and EC95 was 5.70 (95% CI 4.02-67.53).

Observed and PAVA (Pooled Adjacent-violators Algorithm: One of the Isotonic Regression Estimation Method that Constrains the Point Estimates to Either Increase or Decrease Monotonically) Adjusted Probability
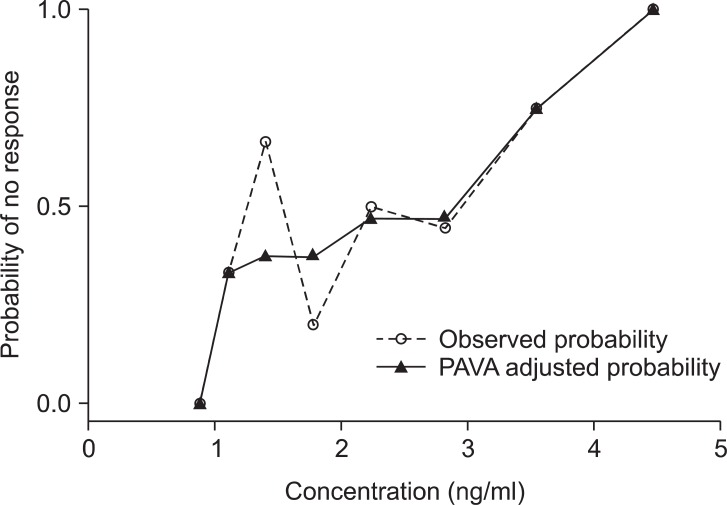
This figure shows the observed response rate (dashed line, open square) and the PAVA (pooled adjacent-violators algorithm: one of the isotonic regression estimation method that constrains the point estimates to either increase or decrease monotonically)-adjusted response rate (solid line, solid triangle) at each remifentanil concentration. The observed response rate and PAVA-adjusted response are equal at certain concentrations. The PAVA-adjusted response rate is monotonically increased.
Discussion
Simulation studies have demonstrated that performing an experiment to characterize the EC50 by obtaining a fully specified tolerance distribution is almost always less efficient than a sequential design to estimate only the EC50 [5]. In this study, EC50 or EC95 levels of remifentanil were investigated to determine the level that would blunt hemodynamic changes provoked by head holder pinning by means of UDM. There were 3 kinds of estimates proposed in this study. At first, EC50 of remifentanil was 2.19 ± 0.76 ng/ml, as the turning point estimator. Second, EC50 was 2.42 ng/ml (95% CI -0.62-4.66) and EC95 was 5.70 ng/ml (95% CI 4.02-67.53) in probit analysis as back up analysis, while its confidence intervals were unrealistic. Third, EC50 and EC95 came from the isotonic regression method were 2.90 ng/ml (95% CI 1.78-3.65) and 4.28 ng/ml (95% CI 3.85-4.41), respectively.
The pharmacokinetics of remifentanil is independent of the total dose, as well as the rate and duration of infusion [6]. These properties make remifentanil potentially useful during neurosurgical cases because it can provide excellent hemodynamic stability during the painful stimuli at the beginning of the case, ensuring a rapid extinction in its pharmacologic effects during the less stressful periods of the operation. There have been many studies in which a bolus injection of remifentanil has been used, but this could result in hemodynamic instability [7,8]. Warner et al. [9] reported that bolus doses of remifentanil produced does-dependent decreases in MAP in patients undergoing supratentorial craniectomy for tumor resection. Continuous infusions, and not bolus doses of opiates, have been proven to provide a better quality of anesthesia [10]. In particular, the TCI of remifentanil was adopted to deliver a stable and exact analgesic concentration on the basis of an integrated pharmacokinetic model and a computer-controlled infusion pump (Asan pump 2.0.7 version, Bionet, Korea).
When using the UDM, it is recommended that the first patient was assigned to a target remifentanil effect-site concentration close to the predicted EC50. Little information is available on the effect-site concentration of remifentanil required to blunt cardiovascular responses to head holder pinning. However, there have been many studies on the appropriate concentration of remifentanil to blunt hemodynamic change during tracheal intubation. Yon et al. [11] reported effect site concentration of remifentanil to blunting hemodynamic responses to tracheal intubation using light wand during target controlled infusion-total intravenous anesthesia. The results were 2.94 ng/ml. Lee et al. [12] reported the effect-site concentration of remifentanil to blunt hemodynamic change induced by tracheal intubation was 4 ng/ml among groups of 0, 2, 4 and 6 ng/ml. These above studies are referenced for determining the effect-site concentration of the first patient, because the pain intensity of head holder pinning was considered as strong as tracheal intubation. So remifentanil concentration was set between 3 and 4, as the initial effect site concentration.
Only propofol was considered that it had effect on BIS value [13]. Maintaining an adequate and stable level of unconsciousness was done by using a TCI of propofol that maintained a BIS value ranging from 40-60. Many studies have been conducted to find the concentration of propofol required for appropriate unconsciousness when intravenous anesthesia was performed. Ithnin et al. [14] reported that propofol concentration for adequate tracheal intubating condition was 3.0 µg/ml with remifentanil effect target concentration 4.41 ng/ml. Another study reported effect-site concentration of propofol for maintaining 41.1 ± 2.5 of bispectral index (BIS) value was 3.5 µg/ml [15]. Albertin et al. [16] studied the effectsite concentration of remifentanil that blunted cardiovascular responses to tracheal intubation and skin incision during bispectral index-guided propofol anesthesia. In that study, concentration of propofol was adjusted freely, while maintaining BIS value 40-50. Mean effect site concentration of propofol was 3.4 µg/ml with remifentanil effect target concentration of 5.0 ng/ml. Based on these studies, the effectsite concentration of propofol was determined to keep 3.0 µg/ml for intubation with TCI of remifentanil 3.0 ng/ml.
For head holder pinning, propofol effect-site concentration was maintained at 2.0 µg/ml. There used to be no noxious stimulations during the long period after intubation till head hold pinning. There are many cases in which systolic blood pressure dropped below 80 at a higher concentration of propofol in the preliminary study. If BIS value could not be maintained from 40-60 with propofol infusion at a concentration of 2 µg/ml concentration, it was decided to have this study stopped. In this study, BIS values of all patients were maintained between 40-60.
In the results, there are some significant difference between success and failure group in sequential changes of MBP and HR. It is a consequential result, because success or failure responses were decided with the differences of MBP and HR comparing them with the baseline values. However, even though effect site concentrations of propofol and remifentanil used for each patient were the same during intubation, MBP turned into being different between groups after induction at I1 and BH. ANCOVA analysis was performed to correct the effect of MBP of I1 on MBP changes of Max. The results revealed that MBP changes of I1 had a significant influence on the changes of MBP of Max. It was considered that BP changes during induction might affect BP changes at the time of head holder pinning. It might be considered that these changes of blood pressure might be associated with pain sensitivity [17]. Pain sensitivity assessment would be useful tools to predict hemodynamic changes during intraoperative noxious stimulations. Pain sensitivity was measured in the several ways: a pain sensitivity questionnaire, pressure pain tolerance, thermal pain test, electrical pain test and a subcutaneous lidocaine injection method [18-20].
Logarithmic scale transformation was performed on doses and dosing intervals. Logarithmic scale transformation makes the target concentrations converge more easily. Logarithmic scale transformation could be performed just because of mathematical reason not because of pharmacological problems. There is a little more accurate EC50 with logarithmic scale if the number of objects is same with non-transformed method. Logarithmic scale can help researchers to reduce the number of objects if the accuracy is same with non-transformed one.
Isotonic regression is a variant of restricted least squares regression that constrains the point estimates to either increase or decrease monotonically. An isotonic point estimate may be constant over some range of doses. It is necessary to specify the precision of estimators with a 95% confidence interval. The CIs are obtained by computer numerical methods. Stylianou [21] developed a parametric bootstrap routine calculating CIs by a bias corrected percentile method.
The probit analysis in this study shows unrealistic CIs that could be criticized. Vågerö and Sundberg [22] also criticized the use of probit analysis in several published anesthesia UDM studies. These methods were criticized for several reasons, including accuracy. UDM reports with probit or logistic regression for non-independent data should no longer include logit or probit regression analysis [5].
In conclusion, this study shows EC50 or EC95 of remifentanil to blunt hemodynamic change provoked by head holder pinning. By TPE method, EC50 the was 2.19 ± 0.76 ng/ml under 2 µg/ml of effect target concentration of propofol. EC50 and EC95 of remifentanil were 2.42 ng/ml (95% CI -0.62-4.66) and 5.70 ng/ml (95% CI 4.02-67.53) in probit analysis. However, it did not guarantee the assumption of independence and tolerance distribution of data. Furthermore, the CIs were unrealistic in range. However, the results from the isotonic regression estimation show the smaller bias and greater precision. The isotonic regression estimator of EC50 and EC95 with CIs derived by bootstrapping were 2.90 ng/ml (95% CI 1.78-3.65) and 4.28 ng/ml (95% CI 3.85-4.41), respectively.