A comparison of the accuracy of ulnar versus median nerve stimulation for neuromuscular monitoring
Article information
Abstract
Background
Inexperienced anesthesiologists are frequently unclear as to whether to stimulate the ulnar or median nerve to monitor the adductor pollicis. The primary purpose of this study was to determine whether monitoring the adductor pollicis by positioning the stimulating electrodes over the median nerve is an acceptable alternative to applying electrodes over the ulnar nerve.
Methods
In 20 patients anesthetized with propofol and remifentanil, one pair of stimulating electrodes was positioned over the ulnar nerve. A second pair was placed over the median nerve on the other hand. The acceleromyographic response was monitored on both hands. Rocuronium 0.6 mg/kg was administered. Single twitch (ST) and train-of-four (TOF) stimulations were applied alternatively to both sites.
Results
None of the patients showed a twitch response at either site after injection of rocuronium. There were no differences in the mean supramaximal threshold, mean initial TOF ratio, or mean initial ST ratio between the two sites. Bland-Altman analysis revealed a bias (limit of agreement) in the TOF and ST ratios over the median nerve of 7% (± 31%) and 26% (± 73%), respectively, as compared with the ulnar nerve. The median nerve TOF ratio was overestimated by 16.2%, as compared with that of the ulnar nerve value, and the median nerve ST ratio was overestimated by 72.9%, as compared to that of the ulnar nerve.
Conclusions
The ulnar and median nerves cannot be used interchangeably for accurate neuromuscular monitoring.
Introduction
Measurement of the tension in the adductor pollicis muscle after electrical stimulation of the ulnar nerve is an established technique in human muscle physiology and widely used in anesthesia [1,2]. The accepted method of stimulating the adductor pollicis involves placing electrodes at the wrist over the ulnar nerve. This test is widely used because the muscle itself is easily accessible and is solely innervated from the ulnar nerve, thereby enabling complete assessment of neuromuscular function [3].
Electrical stimulation of a peripheral nerve at the P6 acupuncture point (median nerve) minimizes postoperative nausea and vomiting (PONV) while simultaneously allowing measurement of neuromuscular blockade [4]. It has been shown that use of a 1 Hz single twitch (ST) at the P6 acupuncture point decreased the incidence of PONV and allowed corrective monitoring of the neuromuscular blockade. When neuromuscular function is monitored, it is thought that the stimulation site must be over a peripheral nerve to elicit the most accurate response [5]. However, anesthesiologists are not interested in absolute values, but rather in trends when performing daily clinical measurements. Moreover, inexperienced anesthesiologists are frequently confused as to whether to use the ulnar or median nerves to monitor the adductor pollicis muscle. However, median nerve stimulation for neuromuscular monitoring has not been formally evaluated nor has it been compared with the "gold standard": the ulnar nerve-adductor pollicis complex.
The aim of this study was to determine whether monitoring of the adductor pollicis by positioning the stimulating electrodes over the median nerve is an acceptable alternative to applying electrodes over the ulnar nerve.
Materials and Methods
After approval from the Hospital Ethics Committee and after obtaining informed consent, 20 patients, (ASA I-II), aged 25-58 years and scheduled to undergo surgery in the supine position with both arms available for neuromuscular monitoring and with an anticipated duration of surgery of more than 1 h, were enrolled. Obese patients (weight > 130% of ideal body weight), and those with neuromuscular, hepatic, or renal diseases or a history of allergic reactions to the medications used during anesthesia were excluded. No premedication was given. Before the procedure, electrocardiographic (ECG) monitoring, noninvasive arterial blood pressure monitoring, pulse oximetry, and a temperature probe were installed.
Anesthesia was induced by an infusion of remifentanil 0.5 µg/kg/min for 2 min, followed by propofol 2-2.5 mg/kg injected i.v. over 30 s. Anesthesia was maintained with propofol at a dose of 3 mg/kg/h and remifentanil at a dose of 0.3 µg/kg/min. Ventilation via a face mask with nitrous oxide 50% in oxygen was controlled manually to keep the end-tidal carbon dioxide tension within the range of 35-40 mmHg until tracheal intubation.
Placement of the electrodes over the ulnar nerve of the dominant or nondominant hand was randomized among the 20 patients. Another peripheral nerve stimulator was applied over the median nerve on the other hand. Before placing the electrodes, the skin was cleaned using an alcoholic solution and then rubbed. Two surface electrodes (Cleartrode™, Ref 1720-003, ConMed®, Utica, NY) were placed over the ulnar or median nerve on both upper extremities. The proximal positive electrode was placed approximately 3 cm proximal to the distal negative electrode, and each electrode was connected to a peripheral nerve stimulator (TOF-Watch SX®, Organon Ltd., Dublin, Ireland). An accelerometer was attached to the volar aspect of the thumb and connected to the stimulator. The arm and hand were immobilized with tape, leaving only the thumb free. No special arm board was used, and no preload was applied to the thumb.
Neuromuscular monitoring was started immediately after induction of anesthesia and before administration of the muscle relaxant. Prior to calibration of acceleromyography, a 5-s 50-Hz supramaximal tetanic stimulus was administered over the ulnar and median nerves [6]. After initial twitch calibration, the ulnar and median nerves were simultaneously stimulated with a 1 Hz ST stimulus for baseline stabilization. Before any neuromuscular blocking drug was administered, the supramaximal current was obtained. After stabilization of control responses, rocuronium 0.6 mg/kg was administered in a fast-running saline infusion within 5 s, and tracheal intubation was performed at the time of maximum twitch depression. ST stimulation with 0.1 Hz (square-wave pulses of 0.2 ms with supramaximal current) or train-of-four (TOF) stimulation (0.2 ms duration, frequency 2 Hz, 2 s duration with supramaximal current) every 15 s was applied throughout maintenance of anesthesia (Fig. 1). Ventilation was controlled to maintain an end-tidal CO2 partial pressure between 35 and 40 mm Hg. Neuromuscular data were collected from both hands every 10 min to calculate the ST ratio (ST/T0) and TOF ratio (T4/T1), respectively. All ST values were compared with the control ST (T0) (before rocuronium) value measured with supramaximal stimulation at the wrist. The TOF ratio was defined as T4/T1 at the same stimulation site. All data collected were transferred directly from the stimulator to a laptop computer using the TOF-Watch Monitor software. The mean of four consecutive TOF or ST ratios was calculated for each stimulation site for each hand, respectively. Skin temperature over the adductor pollicis was kept above 32℃ by wrapping the arm in cotton wool, and the core temperature was kept above 35℃ by applying forced air warming. Additional rocuronium doses were given during surgery as needed. At the end of surgery, neostigmine 50 µg/kg and glycopyrrolate 10 µg/kg were administered if necessary.
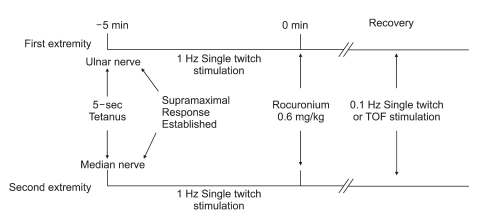
The time course of nerve stimulation in the two extremities is shown. Ulnar nerve stimulation in one extremity and median nerve stimulation in the second extremity were initiated after a 5 s tetanic stimulus at -5 min (i.e., 5 min before the drug was administered), and supramaximal response was established in 0.6-1 min. Rocuronium 0.6 mg/kg was given at time 0. A single twitch of 0.1 Hz or train-of-four (TOF) stimulation every 15 s was applied throughout maintenance of anesthesia.
The data were analyzed using the SPSS (SPSS for Windows Release 14.0) statistical software package. The sample size (n = 20) was determined based on the following criteria: a significance level of 5% and a power of 80% to detect a bias between the two methods of 30%. To compare ulnar and median nerve TOF and ST ratios, the differences between the medians of the TOF and ST ratios were plotted against the averages of the TOF and ST ratios, respectively, based on the statistical method of Bland and Altman [7]. Differences in pharmacodynamic variables between the TOF and ST ratios on both hands were analyzed using linear regression analysis and analysis of covariance (ANCOVA). Differences were considered statistically significant at P < 0.05.
Results
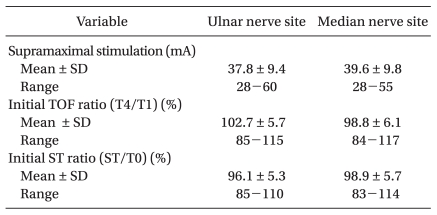
Twenty patients were included in the study: 11 men and 9 women (age, 41.2 ± 9.5 years; weight, 64.5 ± 11.5 kg; height, 164.2 ± 8.7 cm; handedness, right/left, 17/3; duration of anesthesia, 125 ± 29 min). There were no differences in the mean supramaximal threshold, mean initial TOF ratio, or mean initial ST ratio between the ulnar and median nerves (Table 1). After injection of rocuronium 0.6 mg/kg, none of the patients had a delay in complete neuromuscular blockade as monitored at the ulnar and median nerves. During recovery, 206 and 208 paired TOF and ST ratios, respectively, were recorded from both hands simultaneously. The mean differences with 95% confidence intervals (CI) of the TOF and ST ratios between the ulnar and median nerves were 0.07 (0.02) and 0.26 (0.05), respectively. Bland-Altman analysis indicated that the 95% limits of agreement between the two nerves ranged from -0.24 to +0.38 for the TOF ratio and -0.47 to +0.99 for the ST ratio (Figs. 2 and 3). The regression line of the TOF ratios [intercept (ic) = 0.13, regression coefficient (b) = 0.86, correlation coefficient (r2) = 0.52] deviated significantly from that of the ST ratios (ic = 0.13, b = 1.36, r2 = 0.35) (P < 0.001). The median nerve TOF ratios were overestimated by 16.2% compared with the ulnar nerve TOF ratios, while the median nerve ST ratios were overestimated by 72.9% compared to the ulnar nerve ST ratios (Fig. 4).
Initial Measurements

Bland-Altman analysis of differences in the train-of-four (TOF) ratio (T4/T1) between the ulnar and median nerves plotted against the average TOF ratios between the ulnar and median nerves. White circles correspond to measurements (206). The mean difference between the results (bias) was 0.07. The lower limit of agreement (1.96 SD) was -0.24 and the upper limit of agreement was +0.38.
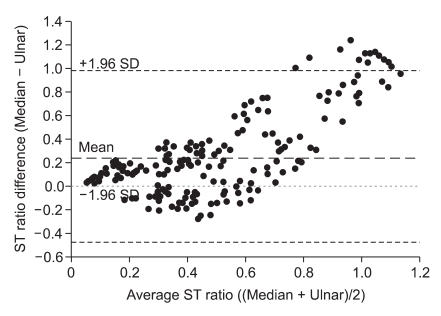
Bland-Altman analysis of differences in the single twitch (ST) ratio (ST/T0) between the ulnar and median nerves plotted against differences in the average ST ratio between the ulnar and median nerves. Black circles correspond to measurements (208). The mean difference between the results (bias) was 0.26. The lower limit of agreement (1.96 SD) was -0.47 and the upper limit of agreement was +0.99.
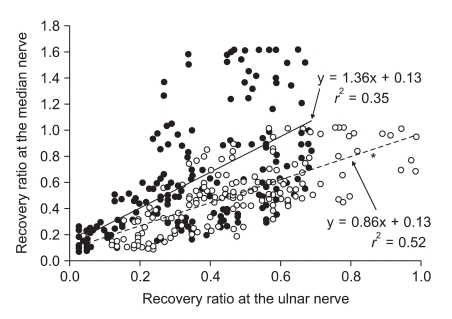
Recovery ratios over the median nerve after train-of-four (TOF) or single twitch (ST) stimulation plotted against the corresponding values over the ulnar nerve during rocuronium-induced neuromuscular blockade. The scatterplot and regression line for TOF (white circles and dashed line, respectively) and ST (black circles and continuous line, respectively) stimulation are shown. The equation corresponding to each line and the correlation coefficient r2 are provided. *P < 0.001 versus the ST line.
Discussion
We found that TOF and ST ratios measured at the median nerve are not comparable to those obtained at the ulnar nerve; the median nerve TOF and ST ratios were overestimated by 16.2% and 72.9%, respectively, compared with the TOF and ST ratios at the ulnar nerve.
The TOF and ST ratios of the median and ulnar nerves showed no correlation. When both sites were compared, there was a 7% bias and the 95% limit of agreement was ± 31 for the TOF ratio compared to a 26% bias and a 95% limit of agreement of ± 73% for the ST ratio, which are not within the accuracy limits of the accelerometer. With regard to the ST values, dispersion was important, and there was a positive bias of 72.9% for the ST ratios (the median nerve showed higher ST values than the ulnar nerve). Ulnar TOF ratios were twice as large as those of the median nerve for 12 measurements. We suspect that the greater ST values measured for the median nerve is probably caused by stimulation of the muscle fibers of the thenar eminence, which is innervated by the median nerve; stimulation of the thenar eminence muscle fibres could increase the force of contraction or change the direction of the acceleration vector toward the accelerometer. The median nerve innervates many muscle groups in the hand. Apart from the thenar eminence (the abductor pollicis brevis, the flexor pollicis brevis, the opponens pollicis), the 1st and 2nd lumbrical muscles are also innervated by the median nerve [8]. Therefore, stimulation of this median nerve produces movement not only of the thumb, but also of every other finger of the hand.
When neuromuscular function is monitored, it is usually thought that the stimulation site must be over a peripheral nerve to elicit the most accurate response [9]. It is believed that stimulation over or near a muscle could produce direct muscle contraction. If direct muscle stimulation were to occur, interpretation of neuromuscular function could be hampered because muscle contractions would be present even with adequate muscle relaxation. When electrodes over the median nerve are placed directly over a muscle, there is always the concern that direct muscle stimulation (depolarization of muscle fibers directly and not through the neuromuscular junction) could occur [10]. This could lead to the false assumption that the patient is not completely paralyzed clinically.
We compared the two stimulation sites on both arms simultaneously after calibration using two accelerometers. This allowed us to stimulate both sites at the same time and to switch the stimulating patterns from ST to TOF. To ensure that we compared TOF ratios and twitch height at the same time during recovery and to minimize variation between successive measurements, we used the mean of four TOF ratios and ST ratios for each stimulation site in our analyses. We could not minimize the difference in baseline drift between the two arms, but there were no differences in the mean supramaximal threshold, mean initial TOF ratio, or mean initial ST ratio between the ulnar and median nerves (Table 1).
The 95% limits for the TOF ratio as measured using acceleromyography ranged from 0.50 to 0.99 at a mechanomyographic reading of 0.70. It is true that acceleromyographically-measured responses may differ from the output of 'classic' mechanomyography and electromyographic monitors [11]. These differences are usually due to instrument calibration and baseline stabilization parameters. With acceleromyography, twitch height increases with repeated stimulation. This latter phenomenon (the staircase effect) can be markedly decreased if a 5 s, 50 Hz tetanic stimulus precedes twitch height calibration [6]. Nevertheless, acceleromyography is a valuable clinical tool, and with careful calibration is also a valid research instrument. Acceleromyographic and piezoelectric monitors that are compact, easy to set-up, and that can provide real-time quantification of the TOF ratio, are now available. We used a 5 s, 50 Hz tetanic stimulus to calibrate both ulnar and median nerves before treatment.
The preparation and placement of the stimulating electrodes can influence neuromuscular monitoring. To obtain optimal quantitative monitoring results, the other four fingers should be fixed. Before placing the electrodes, the skin should be cleaned using an alcoholic solution and then rubbed. The electrodes should be placed correctly at the site to ensure that the current stimulates the target nerve appropriately [12]. When using ECG electrodes, the distance between the two electrodes should be < 6 cm. In addition, it is recommended that the negative electrode be placed at the distal site [13,14]. Skin temperature should be maintained at ≥ 32℃ to avoid hypothermia-related increases in skin impedance. We placed the electrodes at a similar distance (< 3 cm) from each other on both arms and monitored the skin (32℃) and core (35℃) temperatures. Each arm and hand were immobilized with tape, leaving only the thumb free. No special arm board was used, and no preload was applied to the thumb.
In conclusion, our results suggest that the ulnar and median nerves cannot be used interchangeably for accurate neuromuscular monitoring.