Introduction
High phrasal similarity, usually represented by a high percentage of the matching text or a high percentage of the similarity index, has become one of the most perplexing issues for authors, reviewers, and editors working in the medical field worldwide. Authors and editors are afraid of being suspected of plagiarism without any respect to their intentions. As some editors [1] have pointed out that increasing plagiarism obliges research institutes and journals to take measures against text-theft through the internet, and dedicated web-based applications have been widely used to estimate the similarity index. The Korean Journal of Anesthesiology (KJA) has introduced a new process where all of the submitted papers must undergo an estimation of the similarity index since April 2012. The similarity index is a percent score estimating how many phrases of a manuscript are identical to those in a previously published work. Some medical journal editors have closed their submission gate to a manuscript having a high similarity index, by equipping with a filtration step prechecked by a computer-driven system. Still, some of our in-house editors have claimed that they could hardly find any value in papers having a high similarity index. However, others have commented that a high similarity index would be inevitable according to the research discipline or the nature of research itself. Although the percentage of the similarity index has become a standard measure against plagiarism among authors and editors working in the medical writing field, its characteristics, particularly those affecting the value of a paper, have not been investigated. To identify the correlation between the similarity index and the value of a paper, we employed ŌĆśprobability to be accepted,ŌĆÖ ŌĆśacademics cited-by frequency,ŌĆÖ and ŌĆśappearance in social media.ŌĆÖ More specifically, the research aimed to answer the following questions:
The goal of our research was to eradicate a previous insight that a submitted paper having a high similarity index might hardly have any value. We did not mention about plagiarism or insincere writing throughout the manuscript. Instead, we depict how the similarity index appears, how it affects the decision of a peer review, and how editors are confident about the insights independent of the similarity index.
Materials and Methods
The authors were permitted to handle the datasets extracted from the online KJA submission system be used in this research at the 62nd Meeting of The Research/Publication Ethics Committee of the KJA Editors (26 January, 2016).
Construction of datasets
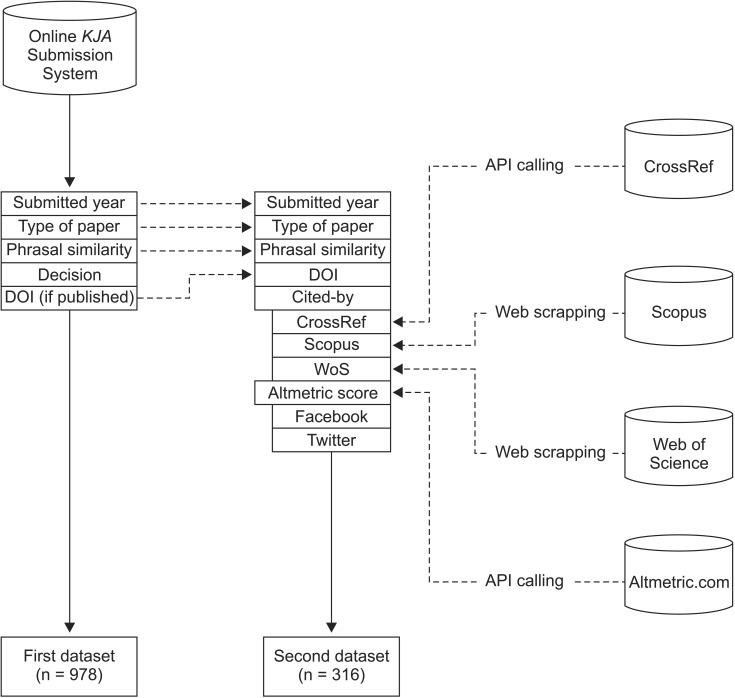
We analyzed two datasets retrieved from the online KJA submission/review system. The first dataset (n = 978) comprised research reports (including clinical and experimental investigations) and case reports submitted from 2012 to 2015. Papers under peer review were excluded. The first dataset contained the following 5 data fields:
Submission year: 2012ŌĆō2015
Type of the paper: A research report (including a clinical investigation and an experimental investigation) and a case report
Similarity index: Estimated using the iThenticate Plagiarism Detection Program
Decision: Accepted/Rejected (Rejection included withdrawal by the author.)
DOI: Digital object identifier for a published paper.
The similarity index percent (iThenticate Plagiarism Detection Program, Turnitin, Oakland, United States) provided a measure of phrasal similarity. The similarity index was estimated with a set of option variables such as the exclusion of bibliography, and the inclusion of matches over 6 consecutive words and that of 1% or greater total match percentage per source. As an excerpt from the first dataset, the second dataset (n = 420) comprised papers published by the KJA.
According to the context of the paper, we classified the value of a paper into the following two categories: the value of a submitted paper and the value of a published paper. ŌĆśProbability to be acceptedŌĆÖ played a role in indicating the value of a submitted paper, and for a published paper, the value was subclassified into two aspects such as academic citation and social media appearance.
The cited-by frequency measures were collected manually from the websites of Scopus and Web of Science (WoS), and by using program-driven application programming interface (API) calling to CrossRef. These measures were combined into the second dataset through the DOI as a key field. Appearance in social media, such as Facebook public wall post and Twitter, and Altmetric.com overall score were retrieved by using Altmetric.com open API calling. Web-retrieval and API calling were performed on February 10, 2016. The second dataset contained the following 10 data fields:
One hundred four records of the dataset had missed the similarity index, which might have resulted from a clerical error or an earlier submission before April 2012, when the KJA had introduced measurement of the similarity index. Thus, we employed 420 records for estimating summary statistics and 316 records for estimating the effect of the similarity index on the value of a published paper (Fig. 1).
Summary statistics
The yearly trend of the similarity index of submitted papers was estimated using the first dataset. The similarity index of published papers was also estimated using the second dataset according to whether it had been cited or not. Summary statistics for three cited-by frequency measures and three social values were created.
The similarity index and the value of a submitted paper
The KJA reviewers and editors were not blinded to the similarity index of the paper, which might influence their opinion during the peer review and decision. Nevertheless, since 2013, the KJA annual refresher course program has educated the reviewers and editors to review a paper irrespective of the similarity index, which has encouraged them to make a decision entirely upon the value of a paper, not upon the similarity index. The probability of acceptance or rejection was partitioned using recursive partitioning analysis. Among the independent variables in the analysis, the similarity index, submission year, and type of the paper were included.
The similarity index and the value of a published paper
The hidden correlation structure behind the similarity index, publication period, 3 measures of academic value, and 3 measures of social value were estimated using the principal component analysis. On extraction of the principal components, because the 8 variables were on varying scale, the correlation matrix was necessarily applied rather than the covariance matrix.
Open API calling and analytic tool
The cited-by frequency measures were collected manually from the websites of Scopus and WoS. The cited frequency by CrossRef was obtained with open API call on R statistical software. The number of appearances in a Facebook public wall post and Twitter, and Altmetric.com overall score were obtained with open API call on R. The former was implemented as crossref (Client for Various ŌĆśCrossRef ŌĆÖ ŌĆśAPIsŌĆÖ. R package version 0.3.4.) and the latter was implemented as rAltmetric (Retrieves Altmerics Data For Any Published Paper From Altmetric.com. R package version 0.6). Every Altmetric.com query requires a user key that was authenticated by Altmetric.com. Recursive partitioning analysis was performed using rpart (rpart: Recursive Partitioning and Regression Trees. R package version 4.1-10). R statistical software version 3.2.3 ŌĆśWooden Christmas-TreeŌĆÖ (R: A language and environment for statistical computing. R Foundation for Statistical Computing, Vienna, Austria) was used to perform the whole process of data archiving, web retrieval, and statistical analyses. In the current experiment, all statistical analyses were of a purely exploratory nature; therefore, the inferential threshold was not targeted.
Results
Summary statistics
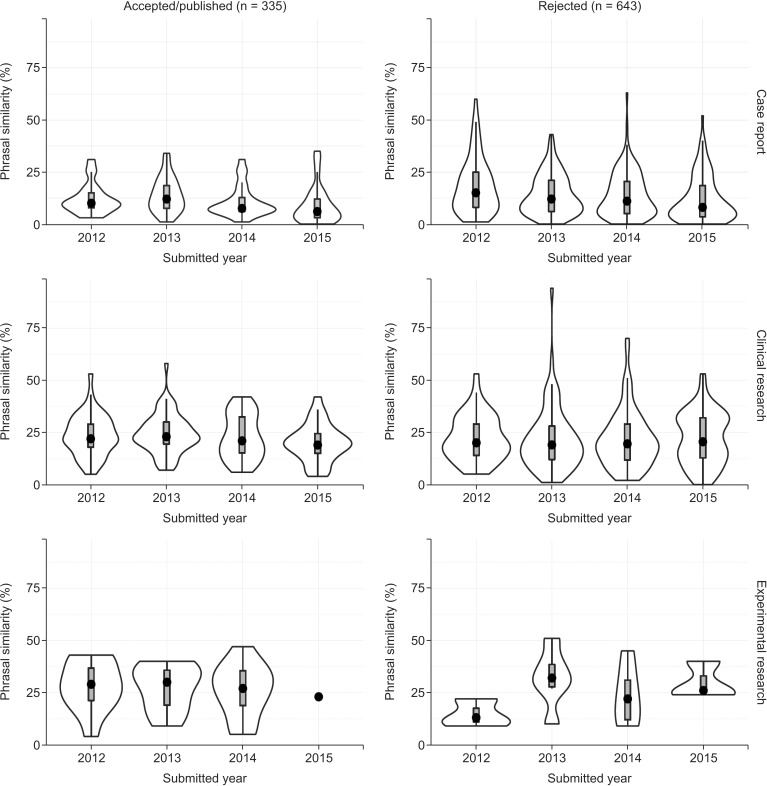
The similarity index approached a mean value of 18 (median value 16, Q1ŌĆōQ3, 8ŌĆō26, Table 1), which did not show noticeable changes according to the submission year (Fig. 2). Sixty percent (254/420) of the published papers were cited at least once, while only 42% (179 of 420) of the published papers were mentioned in social media (Table 2).
The effect of the similarity index on the value of a submitted paper
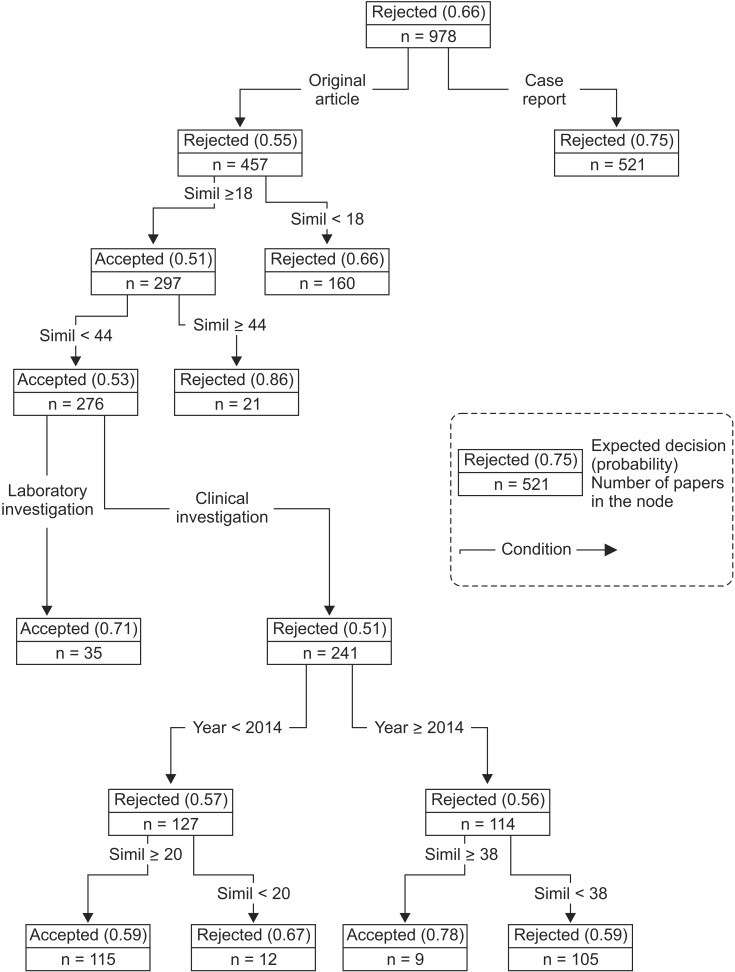
The average rejection rate for submitted papers was 0.66. Case reports were more frequently rejected than research articles (0.75 vs. 0.55). The similarity index caused four splits in the classification tree; research articles having a similarity index less than 18% were rejected; research articles having a similarity index greater than or equal to 44% were rejected; articles on clinical research having a similarity index less than 20% were rejected before the year 2014, and those having a similarity index less than 38% were rejected from the year 2014 (Fig. 3). To put it another way, the rejection rate for case reports was not affected by the similarity index. Rejection of research articles having a low similarity index (less than 18%) accounted for the largest portion of the whole rejection (106 papers = 160 ├Ś 0.66). Both extremes of the similarity index (less than 18% or greater than 44%) led to rejection, irrespective of the submission year. The secondary lowest cutoff values were 20% and 38% by the year 2014 as an intersecting point.
The effect of the similarity index on the value of a published paper
Out of the estimated principal components, we displayed and interpreted only the first three components, whose eigenvalues were 3.00, 2.66, and 0.94, respectively. These three principal components accounted for almost 85% of the total variance of the original variables (Table 3). The three parameters indicating academic value (CrossRef, Scopus, and WoS) nearly overlapped each other, which was also true for the three parameters indicating social value (Altmetric.com score and appearances in the Facebook wall post and Twitter). The first component indicated that a high (or low) similarity index correlated with a high (or low) value of academic citation, whose loadings were even small. On examination of the second and third component, the similarity index did not have a correlation with either the value of academic citation or with social value. We can see that the third component showed that the higher the publication year (= the more recent the paper), the higher the similarity index. This might reveal that editors gain confidence in accepting a paper, independent of the high similarity index.
Discussion
In our research, in a Korean medical journal, some degree of the similarity index was inevitable, and the permissible range of the similarity index varied depending on the type of the submitted paper. Once published, the similarity index was not related to the value of a paper in the academic or the social aspect.
Our dataset was contaminated by well-understood flaws as the estimated similarity index value was exposed during peer review and final decision. A high similarity index might incline the reviewer and the editor towards relinquishing publication of the paper. Furthermore, we omitted some bibliometric measurements in the analysis, which have been known to be potential candidates that influence the cited-by frequencies of scientific articles [2]. Readers must be aware of the possible expansion of the role of the similarity index in explaining the value of a submitted paper. It should be noted that our finding indicated a correlation rather than causality. Despite the inherent weakness in our dataset and the analysis we have chosen, the result would be worth examining in detail because the dataset registered the full submitted papers since 2012. This is the first published report showing the relationship between the similarity index and the value of a scientific paper.
The highest cutoff value for acceptance of clinical investigation rose to 38% compared to 20% during the years before 2014, which also supported our editorial policy that peer review and a decision should be made independent of the similarity index, as mentioned above.
We adopted the cited-by measures as the academic value of a published paper, and then we obtained them from 3 sources. The cited-by measures showed consistent behavior in the principal component analysis, which concluded that the measures from 3 different sources were needless in a research of this nature. The cited-by measures should be interpreted with caution. It must grow with age of the published paper. In the Table 3, the publication year must indicate the inverse age of the paper, which dominates the negative influence on the cited-by measures and the social measure in the first component. Papers published in the year 2015 were enrolled in the analysis, which had a low chance to be cited or to appear in social media likewise. The similarity index showed up twice in the analysis of published papers, being the first in an inverse direction to the publication period and in the same direction to the value of a paper. This suggests that ŌĆ£old papers had a low similarity index and had a high value,ŌĆØ in plain English. Second, the direction to the publication period was the same, which may be interpreted as a ŌĆ£time-dependent increase in the similarity index of a published paper.ŌĆØ The latter might reflect a gradual change in our editor's standpoint along with the editorial policy that has educated peer reviewers and editors not to reject a paper simply because of a high similarity index. Taken together, we assume that the similarity index varied according to the publication period rather than according to the value of a paper. This is why the first component was named the ŌĆśage effect,ŌĆÖ and the third component was named the ŌĆśeducation effect.ŌĆÖ Independent of these 2 effects, three social media measures accounted for 33% of total variances.
The Altmetric.com measures account for a wide spectrum of values following the social appearance; composed of social media shares, blog posts, Wikipedia citations, and news stories.1) The KJA has a long history but it is relatively new as an international journal; therefore, appearances in social media are quite rare. Only 179 of the 420 papers appeared in social media as compared with 254 of the 420 papers cited at least once. This discrepancy was also evident on examining the differences in loadings of the first component.
As the academic citation and social appearance shared a unit measurement, count, they were meant to be interpreted by comparison of the absolute values of loadings. The age of an article contributed more to the growth of the academic value than to the growth of the social value (0.5 vs. 0.1). Low contribution of the similarity index, regarding the social value, limited aggressive interpretation. For these reasons, our research did not treat the temporal schema of Tweets (a message sent using Twitter), which can predict high academic citation in an article that appeared on Tweets within the first 3 days of publication [3].
The discovery was made after a cross-sectional investigation of a single medical journal. The finding suggested that the similarity index no longer had an influence on academic citation or social media appearance according to the paper after publication, while the similarity index affected the acceptance/rejection of a submitted paper. Phrases written by authors belonging to a discipline must share a similarity, especially in the case of a non-English native author [4]. Proofreading and intervention to reduce the similarity for finalizing a draft by the editors might play a role in achieving uniform quality of the publication.
Editors are asked to provide a free and transparent exchange of scientific findings, essentially when these findings are related to the article-selection process. With our novel approach to feature the similarity index, medical journal editors will improve their instinct and expand their knowledge about how the similarity index works in decision making for publication and how it propagates beyond its publication. Based on our finding, while the similarity index influences the destiny of a submitted paper in a complicated way depending upon the article type, once the paper is published, the similarity index lacks influence over the academic citation and appearance in social media. Although readers should be aware that our finding was based on a single international journal published by a medical society in Korea, it necessarily concurs with a gleam in an average editor's eye.