Introduction
For patients who are undergoing transcatheter aortic valve implantation (TAVI), obtaining cardiac output (CO) before and after artificial valve deployment is beneficial for determining its therapeutic effect on aortic stenosis (AS) [1].
The development of a noninvasive CO measurement system using ClearSight™ (Edwards Lifesciences, USA) eliminates the need to insert an intra-arterial catheter. ClearSight is a noninvasive finger cuff pulse contour hemodynamic monitoring system proposed for clinical use in perioperative patients. It consists of a model-based method that provides beat-to-beat measurements of CO by analyzing plethysmography from the arterial pulse form. The main advantage of the finger cuff device is that it is completely noninvasive [2–6]. Therefore, using ClearSight would reduce the number of catheter insertions during TAVI and thus improve patient comfort. Continuous hemodynamic monitoring using the finger cuff should also be considered in patients with contraindications to vascular access (e.g., arteriovenous fistula for hemodialysis) or in those who have scarring due to multiple previous arterial punctures and thus more difficult vascular access. It can also be used during anesthesia induction as a bridge until the arterial catheter is inserted [7,8].
In previous studies, CO measurements using ClearSight were found to be acceptably similar to those using pulmonary artery catheter (PAC) thermodilution in patients with heart failure [2,3]. However, the accuracy and reliability of ClearSight in patients with heart failure have not been evaluated in detail since previous studies have excluded patients with severe valvular disease [3,7,8]. Concerns regarding the precision and accuracy of ClearSight CO measurements in patients with severe AS have been raised and therefore need to be investigated.
This study aimed to compare the CO obtained using ClearSight with that obtained using PAC thermodilution as the reference method in patients undergoing TAVI. We hypothesized that the ClearSight noninvasive pulse contour CO measurements would be an acceptable substitute for invasive CO measurements in patients with severe AS.
Materials and Methods
Patient population
This prospective study was approved by the Institutional Review Board of the Hitachi General Hospital in Japan (Registration No. 2020-48). It was conducted in accordance with the ethical principles for medical research involving human subjects based on the Helsinki Declaration of 2013. Written informed consent was obtained from all patients. Between September 2020 and June 2021, 30 patients undergoing elective TAVI using a PAC (Swan-Ganz Pacing-TD catheter, 7.5 Fr; Edwards Lifesciences, USA) were included. We excluded patients undergoing emergency surgery (< 24 h), those with an intracardiac shunt, and those with conditions requiring mechanical circulatory support. Patients who required temporary pacing until the end of surgery due to complete atrioventricular block resulting from valve implantation were excluded.
Intraoperative management
Induction of general anesthesia was performed using intravenous propofol (1–2 mg/kg) and fentanyl (1.0–1.5 μg/kg). Endotracheal intubation was performed after rocuronium administration (0.6–1.0 mg/kg). For each enrolled patient, a 32-mm 22 G tipped catheter (Terumo Corporation, Japan) was inserted into the left or right radial artery. The ClearSight device with a wrist unit connected to a finger cuff was attached to the arm of the patient on the same side as the catheter and connected to the EV1000 Clinical PlatformTM (Edwards Lifesciences, USA). A triple lumen 16-cm 8.5 Fr central venous catheter (Arrow International Inc., USA) and PAC were inserted into the right internal jugular vein, which was connected to the Monitor KitTM (Edwards Lifesciences, USA). All pressure transducers were placed on the mid-axillary line, fixed to the operation table, and zeroed to atmospheric pressure and were connected to the Life Scope G7TM (Nihon Kohden, Japan). The signal quality of the intra-arterial pressure and ClearSight arterial waveform was checked by visually inspecting the waveform. Correct positioning of the tip of the PAC in the peripheral pulmonary artery at west zone 3 was assessed using transesophageal echocardiography. Anesthesia was maintained with a continuous infusion of propofol (3–5 mg/kg/h) and remifentanil (0.2–0.3 μg/kg/min), and mechanical ventilation was used to maintain end-tidal carbon dioxide at 35 to 40 mmHg. Phenylephrine was administered to avoid a 20% decrease in initial mean blood pressure. The inotropic infusion that was initiated before induction was continued. There were no restrictions regarding the start or use of other inotropes during the procedure. The positive end-expiratory pressure was set between 3 and 5 cmH2O by the attending physician.
Study protocol
For each patient, four consecutive sets of CO measurements were recorded during the operation using the ClearSight device (COClearSight) and the PAC thermodilution (COTD). For the first (T1) and second (T2) time points, one measurement using each method was recorded after the PAC was inserted and before the TAVI under stable hemodynamic conditions, defined as blood pressure and heart rate changes within ± 10% 1 min before the measurements. At the third (T3) and fourth (T4) time points, measurements were obtained with each device after artificial valve deployment under stable hemodynamic conditions, defined as blood pressure and heart rate changes within ± 10% 1 min before measurements. Other hemodynamic parameters (i.e., heart rate, mean arterial pressure, and central venous pressure) were also measured at each time point.
Determining COTD
We used thermodilution with ice-cold saline (10 ml bolus injection) to obtain the reference CO measurements. Saline injections were initiated at the end of exhalation. For all patients, six consecutive CO measurements were taken, and the mean of the six measurements was recorded as the COTD at that time point.
Determination of COClearSight
The methodology of the ClearSight system for CO monitoring is based on the finger arterial pressure measured using an appropriately-sized finger cuff around the middle phalanx of the middle or index finger, as described previously. Briefly, the finger blood pressure was obtained by changing the cuff pressure using an algorithm called the “physiocal method” [3–5]. Next, the finger arterial pressure waveform was reconstructed into a brachial arterial pressure waveform. Finally, using the area under the systolic portion of the ClearSight blood pressure curve, the CO was estimated from the stroke volume based on the pulse contour method (i.e., based on the cardiac afterload individualized from the Windkessel model) [9]. This model includes age, sex, height, and weight. The COClearSight corresponding to the measured COTD was defined as follows: the average of the two CO values displayed on the EV1000 monitor at the beginning and end of the ice-cold saline injection.
Statistical analysis
Data are presented as the mean ± standard deviation or number. The patients’ hemodynamic data were compared at each time point with the previous measurement using the paired t-test and Wilcoxon signed-rank test. The Shapiro-Wilk test was used to analyze the normality of the data. Statistical significance was set at P < 0.05, and all P values were two-tailed. Repeated measures analysis of variance (ANOVA) was used to compare hemodynamic values at the four time points.
Based on a previous report conducted in cardiac surgery and because patients with AS often have low CO, we considered that a mean difference of 0.2 L/min in invasive CO and pulse contour CO would be acceptable. The power analysis showed that 99 comparative data points of mean arterial pressure (MAP) (25 patients) were necessary to detect a difference between sample means of 0.2 L/min (5% type I error rate, 10% type II error rate, expected standard deviation [SD] at 0.5 L/min for both methods). We postulated that the overall success rate of finger cuff CO monitoring would be nearly 80%. Therefore, we decided to include 30 patients in this study [10–13].
We used the Bland-Altman analysis with multiple observations per individual to compare the bias, precision (SD of bias), and limits of agreement (LOA) of each CO technique (COClearSight versus COTD) [14–16]. The percentage error (defined as two SDs of the bias divided by the mean of the reference measurements) was calculated to determine the acceptable LOA between each CO measurement technique. Based on previously published results, we determined the percentage error to be < 30%, and the test method was considered interchangeable with the reference measurement method [17–19].
A four-quadrant plot analysis was performed to assess the concordance rate, which was defined as acceptable at > 92% [17–19]. The concordance rate was defined as the percentage of data points lying in the upper right or lower left quadrant after excluding the exclusion zone, which was defined as 5%, as described previously [17,18]. This analysis was performed before and after the TAVI (between T1, T2 and T3, T4). In addition, a polar plot analysis was performed to assess whether the COClearSight was calibrated in relation to the COTD. The polar plot analysis revealed agreement between the two methods based on the angle from the line of identity (y = x) and the magnitude of change of the vector length. Agreement was assessed using the following variables: mean angular bias (the mean angle from the axis), radial LOA (radial sector containing 95% of all the data points), and angular concordance rate (the percentage of data within a ± 30° radial zone). The trending ability was defined as excellent based on the following criteria: mean angular bias < ± 5°, angular concordance rate > 95%, and radial LOA < ± 30°, as described previously [17,18]. In addition, the effect of the systemic vascular resistance index (SVRI) on the discrepancy between the CO measurements (COTD and COClearSight) was investigated using Pearson’s coefficient. The SVRI was calculated from the CO obtained using the PAC thermodilution method. The formula is as follows: SVRI = (MAP – central venous pressure)/CITD × 79.92 (dyne s/cm5/m2), where CITD = COTD/body surface area (L/min/m2).
Statistical analyses were performed using the EZR statistical software (Saitama Medical Center, Jichi Medical University, Saitama, Japan; Available at http://www.jichi.ac.jp/saitama-sct/SaitamaHP.files/statmedEN.html) [20].
Results
In total, 28 patients were enrolled, and 112 paired data points were obtained for analysis. Two of the first 30 patients enrolled in the study were excluded from the analysis because we were unable to obtain a reliable photoplethysmographic signal due to an incorrectly-sized finger cuff. None of the patients required additional inotropic medications during the procedure. Table 1 presents information related to the patients’ baseline characteristics, history, echocardiographic parameters, procedure data, and hemodynamic support received during the operation. Table 2 shows the hemodynamic data at each time point. The repeated measures ANOVA for heart rate, MAP, and SVRI showed significant differences between the time points (F[3,108] = 4.91, P < 0.001; F[3,108] = 9.37, P < 0.001; F[3,108] = 6.32, P < 0.001, respectively).
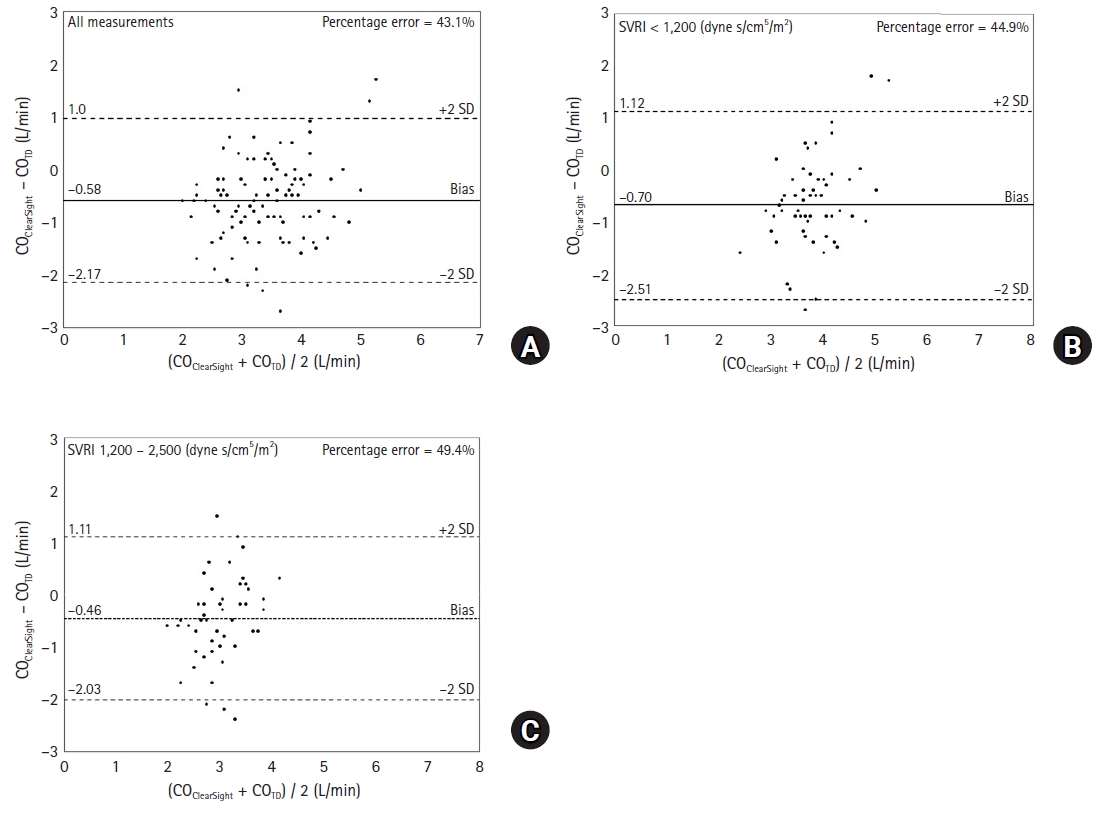
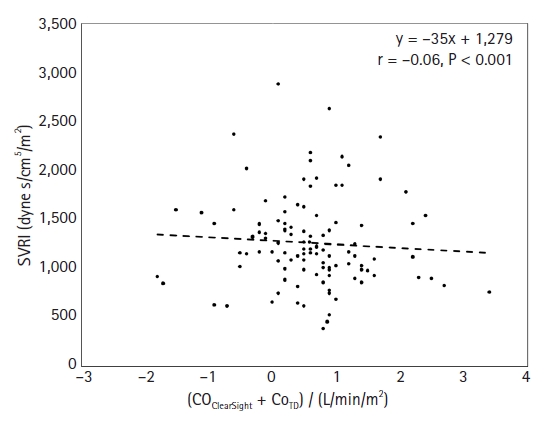
The Bland-Altman analysis was used to compare the MAP and CO derived from the noninvasive ClearSight method and the invasive reference method for all measurements. The bias and LOA between the MAPClearSight and the MAP were 0.4 ± 7.0 (95% CI [−13.5, 14.3] and [−13.3, 14.1] mmHg, respectively). The percentage error was 16.2%. The bias and LOA between the COClearSight and COTD were −0.58 ± 0.80 (95% CI [−2.17, 1.01] and [−2.14, 0.98] L/min, respectively) (Fig. 1A). The percentage error was 43.1%, indicating that the COClearSight had a wide LOA with the COTD. Next, we performed a subanalysis of the measured CO sets divided into two SVRI groups as follows: SVRI < 1,200 (dyne s/cm5/m2) (59 sets; low group) and 1,200 (dyne s/cm5/m2) ≤ SVRI < 2,500 (dyne s/cm5/m2) (51 sets; normal group). The bias and LOA between the COClearSight and COTD were −0.70 ± 0.92 (95% CI [−2.56, 1.17] and [−2.49, 1.12] L/min) in the low group and −0.46 ± 0.80 (95% CI [−2.08, 1.16] and [−2.03 to 1.11] L/min) in the normal group. The percentage errors in the low and normal groups were 44.9% and 49.4%, respectively (Figs. 1B and 1C). The discrepancy in CO (COTD and COClearSight) was not significantly correlated with the SVRI (r = -0.06, P < 0.001) (Fig. 2). A weak positive correlation was noted between the COTD and the percent difference (COTD – COClearSight) / COTD (r = 0.24, P < 0.001) (Fig. 3).
The concordance rate of the four-quadrant plot analysis showed a poor trending ability for the COClearSight measurement (60.3% after artificial valve deployment) (Supplementary Digital Content Fig. 1). Similarly, the polar plot analysis showed a poor trending ability for the COClearSight after artificial valve deployment, with a mean angular bias of 2.4°, a radial limit of agreement of 39.1°, and an angular concordance rate of 51.1% (Fig. 4). The angular concordance rate was below the acceptable limit (> 95%).
Discussion
The main finding of the present study was that the CO derived from ClearSight is not as accurate as that measured by PAC thermodilution. Thus, ClearSight cannot provide a valuable alternative to invasive CO measurement techniques in patients with severe AS who require TAVI.
Some previous studies referring to the inaccuracy of ClearSight CO measurements have reported that ClearSight had an accuracy below the clinically acceptable level for low or high SVRI (< 1,200 or > 3000 dyne s/cm5/m2) and a low CO [3,13]. The data obtained in this study were analyzed by dividing the dataset into two groups according to the SVRI (low and normal groups), in accordance with previous studies. The percentage errors obtained for both groups did not meet Crichery’s criteria. In addition, no correlation was found between the SVRI and the difference between the COTD and COClearSight. Our results indicate that the accuracy of the ClearSight CO measurements in patients with severe AS is poor, even with a normal SVRI. Previous studies have shown that the inaccuracy of COClearSight is caused by the bias between the actual arterial blood pressure and ClearSight-measured arterial blood pressure under abnormal SVRI conditions, which affects the accuracy of CO measurements [13]. COClearSight was calculated using the pulse contour method based on the assumption that the systolic waveform area of the arterial line corresponds to the single-beat volume. If a variation in SVR occurs, the arterial pressure waveform changes, and the calculated CO becomes inaccurate [3,13,21].
In this study, the discrepancy between the COClearSight and the COTD occurred because of factors unrelated to the SVRI. These findings therefore differ from those of previous studies that have claimed the SVRI to be the cause of discrepancies in COClearSight measurements. The inaccurate COClearSight measurements in this study occurred because the evaluated patients had AS heart failure with a relatively low ejection fraction and CO. The cutoff for inaccurate COClearSight measurements has been reported in previous studies to be a cardiac index < 2.5 (L/min/m2). In this study, 60 (53%) datasets had a cardiac index < 2.5, which may have contributed to the discrepancy between the CO measurement methods [21,22]. We predicted that CO would increase after AS was released during TAVI, and the accuracy of the ClearSight would be within acceptable limits at T3 and T4. However, the CO measurements before and after valve deployment were not significantly different. This was because the rapid pacing caused a temporary loss of cardiac contractility in this study, which was not restored for several hours after valve implantation, not even after the decrease in body vascular resistance from T1 to T4, causing the CO to be low for some time [23]. However, for all datasets, we found only a weak positive correlation between the COTD and COTD – COClearSight percent change, and the COClearSight was found to be inaccurate based on the COTD measurements. This is related to the poor CO tracking ability of ClearSight. Previous studies have reported that ClearSight is generally good at tracking CO changes, with levels of agreement between 84% and 100%, but that it loses its tracking ability during rapid hemodynamic events, such as aortic clamping [21,23-26]. Those studies used pre-specified hemodynamic interventions such as phenylephrine administration or fluid challenge to assess the trending ability of ClearSight against CO or when rapid hemodynamic changes occurred during surgery [2-6,27]. In this study, we did not provide instructions for the administration of vasoactive drugs or inotropic agents but observed the ability of ClearSight to follow trends before and after TAVI. The time points for comparison were every few tens of seconds in previous studies, but every few tens of minutes in this study, which was more gradual than in previous studies [13,21,22]. However, in the present study, the rate of agreement after prosthetic valve deployment according to the four-quadrant plot analysis was 60.3%, which was much lower than the cutoff value for acceptable trending ability (92%) [17]. The angular concordance rate for the polar plot analysis was 51.1%, which also indicated a low rate of agreement (Fig. 4). Thus, we can reasonably assume that the large bias between the COTD and COClearSight for all datasets in this study affected the ability of ClearSight to follow CO trends.
This study had several limitations. First, we marked the timing of the thermodilution intermittent CO measurements in the ClearSight recording, as it proved difficult to obtain absolutely synchronized CO measurements. This was circumvented by averaging the ClearSight measurements before and after the cold saline bolus. Second, all patients received continuous infusions of phenylephrine for hemodynamic stability, which might have affected the accuracy of the CO measurements using ClearSight. Some studies have reported that the use of vasoconstrictors affects the accuracy of ClearSight [3,13,21,26]. Third, some of our patients had aortic regurgitation, which might have affected our results. Since the ClearSight pulse contour analysis method used was based on the afterload determined from the Windkessel model, it was designed based on an ideal condition with no aortic regurgitation, which might have affected our results [3,9].
In conclusion, in this study, the present study revealed that COClearSight is not as accurate as transpulmonary thermodilution for measuring CO. Therefore, ClearSight cannot be used in patients with severe AS undergoing TAVI.