Introduction
Traditional meta-analyses are only able to examine the pooled effect size rather than to evaluate whether the number of participants and the corresponding number of trials in a meta-analysis are sufficient to draw any conclusions. Moreover, the use of the traditional 95% CI or the 5% statistical significance threshold will lead to too many false-positive conclusions (type I errors) and too many false-negative conclusions (type II errors) [1].
Trial sequential analysis (TSA) is a recently described cumulative frequentist meta-analysis method [2] used to weigh type I and II errors and to estimate when the effect is large enough to unlikely be affected by further studies [3,4]. While TSA is based on frequentist thinking as it is founded on P value and type I and type II error methods, it incorporates elements of Bayesian thinking. Indeed, the calculated sample size in TSA is related to the pooled effect estimated in a meta-analysis.
TSA generates a graphical outcome divided into four areas by four lines: ŌĆ£benefit,ŌĆØ ŌĆ£harm,ŌĆØ ŌĆ£inner wedge,ŌĆØ or ŌĆ£non-statistically significant,ŌĆØ representing a statistically significant result for the first two areas (ŌĆ£benefitŌĆØ and ŌĆ£harmŌĆØ) and a strong evidence that further studies will hardly be able to change the no-effect results for the ŌĆ£inner wedgeŌĆØ area (Fig. 1). Lying in the ŌĆ£non-statistically significantŌĆØ area means that further studies are needed for a conclusion on the analyzed topic. The cumulative z-statistic line is drawn on this chart by adding the included studies with a chronological criterion, with the last study representing the end of the line and the area (ŌĆ£benefit,ŌĆØ ŌĆ£harm,ŌĆØ ŌĆ£inner wedge,ŌĆØ or ŌĆ£non-statistically significantŌĆØ) [5].
The aim of this study was to illustrate the possible scenarios and possible significance of TSA using meta-analyses published in the Korean Journal of Anesthesiology (KJA) as working material.
Materials and Methods
We performed a systematic search of the medical literature following the Preferred Reporting Items for Systematic Reviews and Meta-analyses (PRISMA) Statement Guidelines for the identification, screening, and inclusion of articles. The search was performed by two researchers (ADC and MT) in close collaboration with the rest of the research team.
Search strategy
The search was performed on May 10, 2021, using the search tool in the KJA site and using the following terms: ŌĆ£meta-analysis,ŌĆØ ŌĆ£metaanalysis,ŌĆØ ŌĆ£meta analysis.ŌĆØ In our search, we did not apply any restrictions on publication type or date, language or status.
Study selection
Two researchers (ADC and MT) independently screened the titles and abstracts of the identified papers to select those that were relevant. Only meta-analyses were considered eligible for analysis.
Data extraction and data retrieval
After identifying those studies meeting the inclusion criteria, two researchers (FG and AB) independently reviewed and assessed each of the included studies. The following information was collected: first author, year of the study, total number of patients per group, registration number, main outcome, and data for intervention and control relative to the main outcome.
If the main outcome was not clearly stated, it was retrieved by examining the registered protocol or by contacting the main author of the paper.
Statistical methods
TSA was performed on the main outcome for each paper using TSA software (Copenhagen Trial Unit, Centre for Clinical Intervention Research, Copenhagen). The effect measure and model (mean difference, odds ratio, relative risk, risk difference, or Peto odds ratio) were used. A fixed effects model, random effects model using the DerSimonianŌĆōLaird method, random effects model using the SidikŌĆōJonkman method, or random effects model using the BiggerstaffŌĆōTweedie method was selected according to the outcome measure and model. No continuity correction was applied in the case of a zero event. We estimated the required sample size on the calculated effect size for the intervention, considering a type I error of 5% and a power of 90%; benefit, harm, and inner wedge boundaries were drawn using the OŌĆÖBrienŌĆōFleming spending function.
Moreover, a more conservative approach, performing a second TSA with a type I error of 5% and a power of 99% was performed for each main outcome. This post-hoc conservative approach allowed us to assess whether the data provided convincing evidence of the true effect.
Results
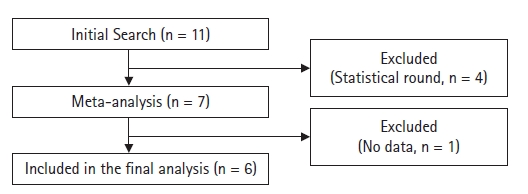
We identified 11 papers [6-16] in our initial search (Table 1). However, four of them were excluded [6-9] because they were statistical rounds; the remaining seven were clinical meta-analyses. One of the meta-analyses [10] did not have sufficient information to perform a TSA and was therefore excluded, leaving six papers for the final analysis [11-16] (Fig. 2).
The topics of the meta-analyses were as follows: curare side effects [11], regional anesthesia [12,16], postoperative efficacy of ibuprofen [14], postoperative shivering [13], and postoperative nausea and vomiting [15]. Notably, only two of them had a pre-registered protocol [12,14]. Four papers [11-14] had two main outcomes, and for this reason, a total of 10 TSAs were performed.
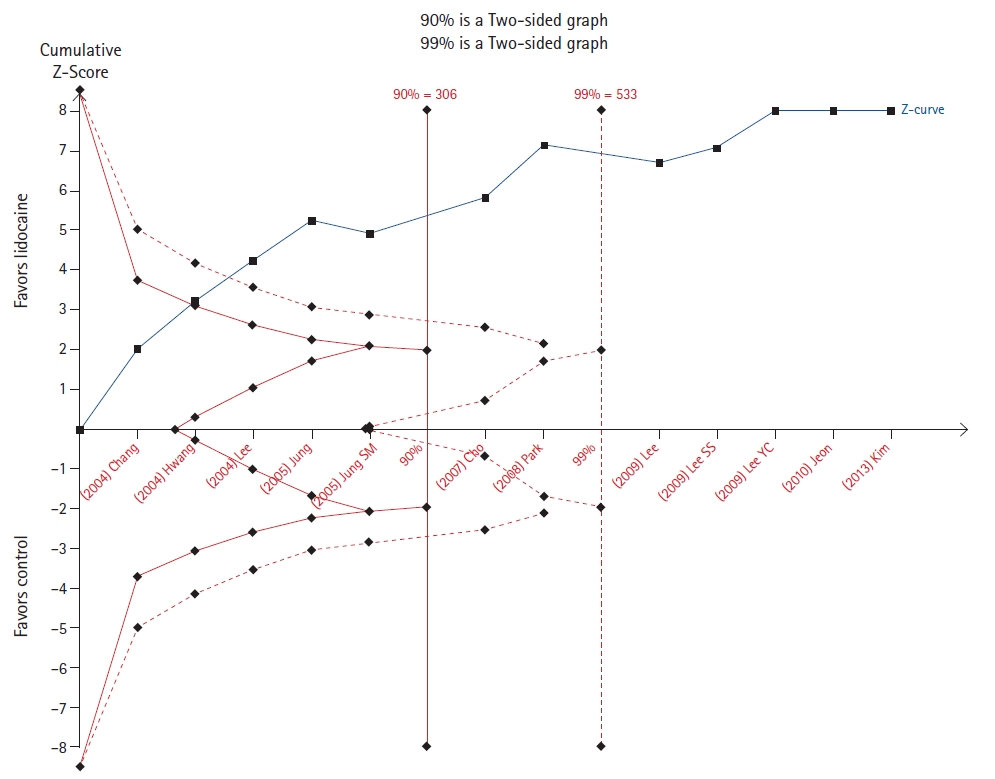
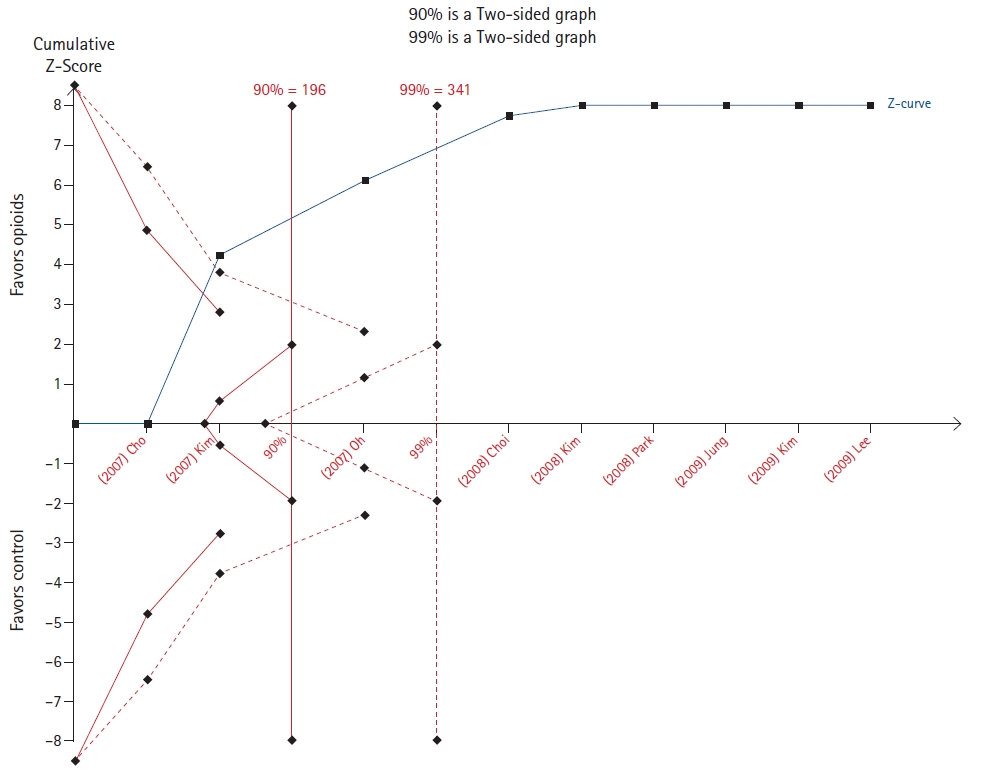
Choi et al. [11] evaluated the effect of pretreatment with lidocaine or opioids opioid pretreatments in the incidence of rocuronium-induced withdrawal movement. For both outcomes, the cumulative z-score line crossed the line to reach the required sample size in both the 90% and 99% analyses (Figs. 3 and 4).
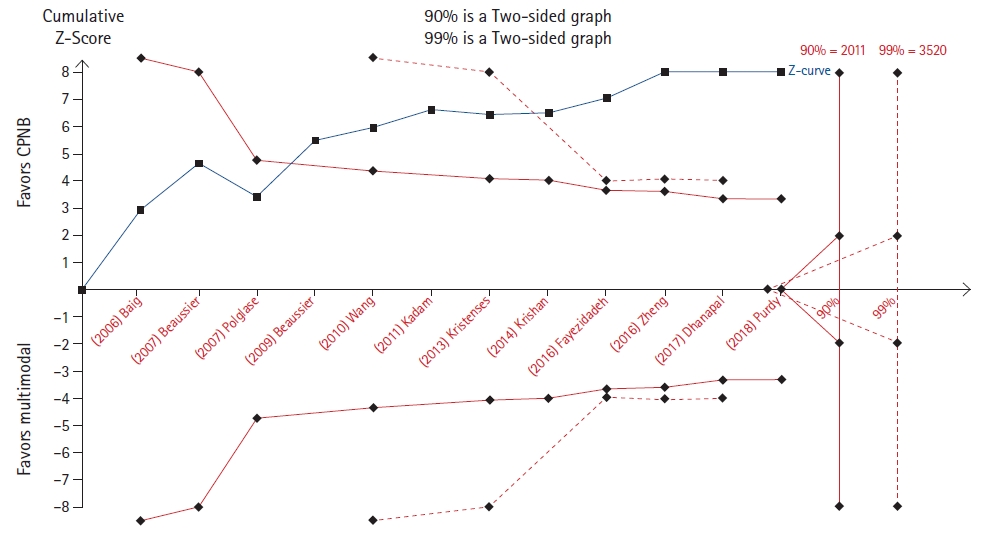
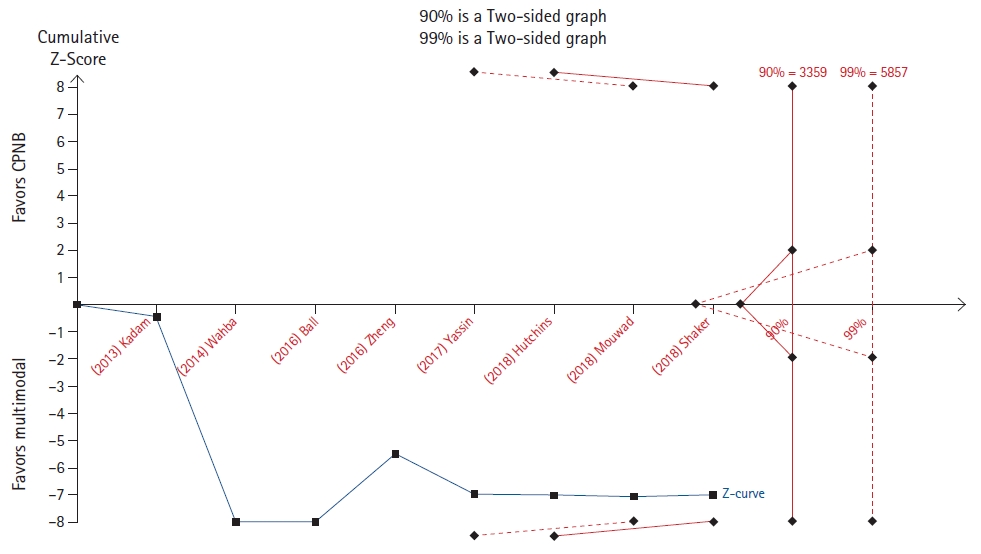
Bailey et al. [12] evaluated the cumulative opioid consumption at 48 hours after midline laparotomy, comparing, on the one hand, continuous peripheral nerve blocks and multimodal analgesia and, on the other hand, continuous peripheral nerve blocks and epidural analgesia. In the TSA, the cumulative z-score line crossed the benefit boundary, but did not reach the required sample size for the outcome relative to the continuous peripheral nerve block in either the 90% or the 99% analysis (Fig. 5). For the other outcome, the cumulative z-score line did not reach any boundary and remained in the zone that is ŌĆ£non-statistically significantŌĆØ area (Fig. 6).
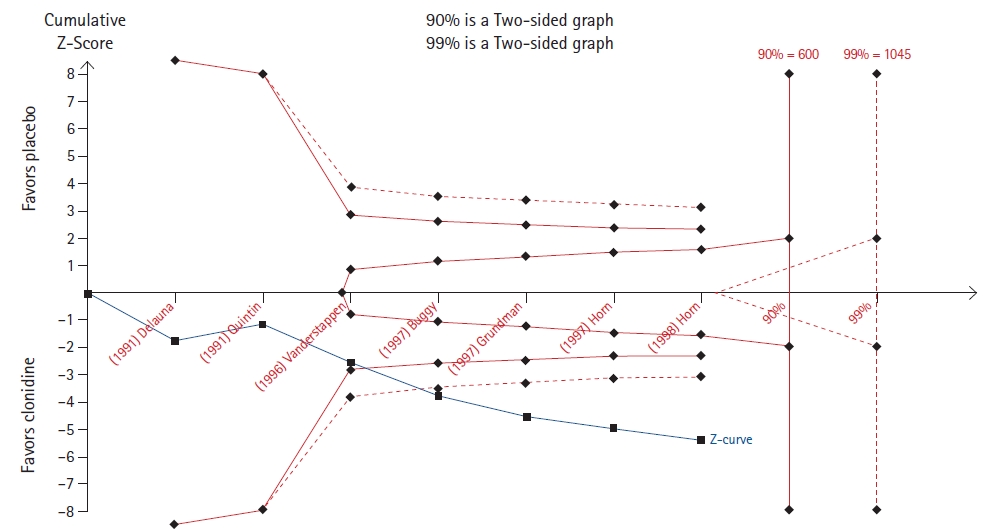
Min et al. [13] evaluated meperidine and clonidine for the prevention of postoperative shivering. A TSA of the meperidine outcome revealed that the cumulative z-line crosses the 90% but not the 99% boundary for benefit (Fig. 7), while a TSA of the clonidine outcome revealed that the cumulative z-line crossed both the 90% and 99% boundaries for benefit without reaching the required sample size (Fig. 8).
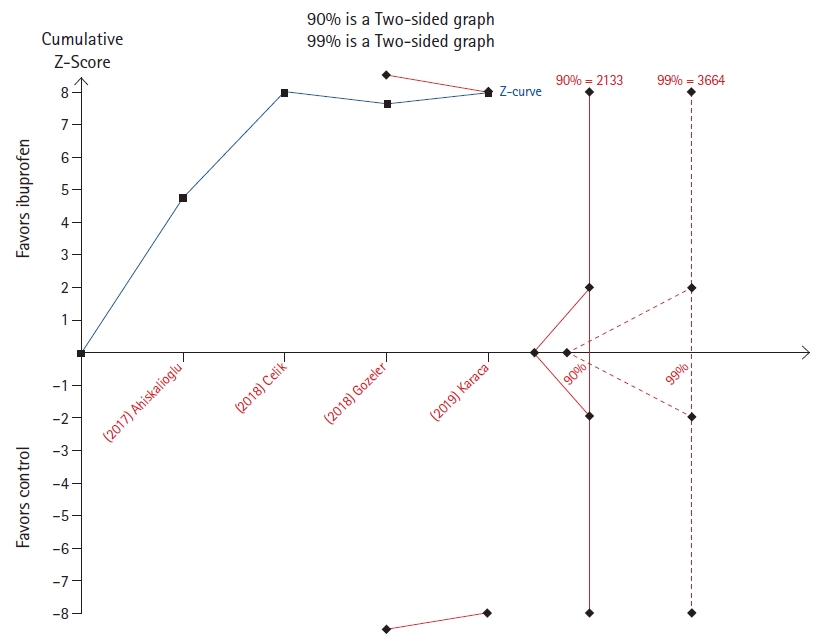
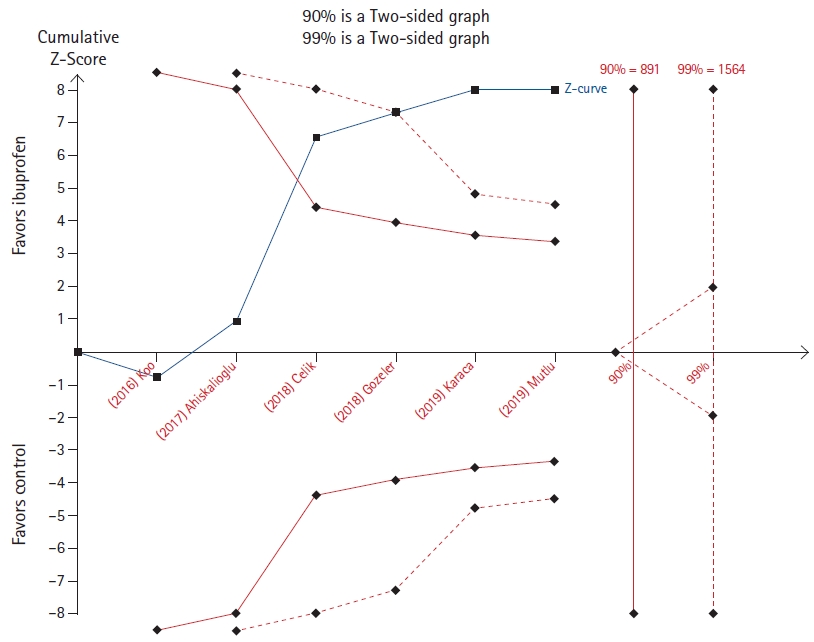
The effect of a single dose of ibuprofen was evaluated by Kim et al. [14] on both postoperative opioid consumption and pain. While the cumulative z-line does not cross the 90% power boundary for effect but lies immediately below that in the opioid consumption outcome (Fig. 9), it crosses both the 90% and 99% boundary for benefit without reaching the required sample size in the analysis relative to pain scores (Fig. 10).
Discussion
A TSA analyzes the cumulative evidence in a meta-analysis. Its output is represented by a cumulative z-line score that may lie in one out of four areas: benefit (labeled A in Fig. 1), harm (labeled D in Fig. 1), non-statistically significant (labeled B in Fig. 1), and inner wedge (labeled C in Fig. 1).
A pooled effect in favor of the intervention (benefit) or in favor of the control (harm), or the absence of any effect (inner wedge), may be established to assess if the cumulative sample size is large enough. On the contrary, when the cumulative z-line lies in the area that is not statistically significant, further studies with an increase in the overall sample size are deemed necessary.
Confirmation of the meta-analysis pooled effect
Seven out of ten TSAs confirmed the results of meta-analyses. However, only in three of them (Figs. 3, 4, and 12) the required sample size was reached. These TSAs suggest that the result is definitive and that other randomized controlled trials are unlikely to modify the effect on the outcomes.
On the contrary, in four TSAs (Figs. 5, 8, 10, and 11), the cumulative z-line, after crossing the boundary for effect, did not reach the required sample size. These TSAs suggest that, although the pooled effect is statistically significant, with regard to sample size, the result is not definitive, and future studies are necessary to be conclusive.
No confirmation of the meta-analysis pooled effect
In the two TSAs (Figs. 6 and 9), the cumulative z-line lies in the zone with no statistical significance. This implies that the sample size of the meta-analysis was too small, and it is therefore impossible to infer where the cumulative z-line will lie in future trials. If a TSA had been performed by the authors, more cautious conclusions could have been drawn.
Inner wedge
No studies have reported examples of the inner wedge zone. However, for completeness, we would like to briefly illustrate this eventuality. The inner wedge zone is delimited by the futility boundaries, creating an isosceles triangle with its base on the sample size line. If the cumulative z-score lies in the inner wedge zone, future studies on the argument must be considered futile because they will hardly be able to change the no-effect results.
Pre-registering TSA
The importance of registering the TSA protocol before conducting the analysis is depicted in Fig. 7). This TSA resulted in statistical significance using a power of 90%, but the statistical significance was lost using an analysis with a power of 99%.
Despite no guidelines or clear recommendations regarding the choice of the power of the analysis, this example shows the limitation of a post-hoc analysis in which the power could be arbitrarily changed to confirm or not the recommended result.
Limitations
Our study has some limitations that we would like to discuss. A limited number of TSAs were included in the analysis, and no examples of a TSA lying in the inner wedge were available.
Other methods such as the law of iterated logarithm penalizing the z-value by the strength of the available evidence and number of statistical tests could be used to adjust the issues of repeated significance testing. In our study, we chose the cumulative z-curve approach, but we recognize this was an arbitrary choice.
We also presented a guide to help clinicians interpret TSA; however, we recognize that we have not explained the statistical basis of this analysis and we recognize this as a limitation. ŌĆā
We showed several examples of how a TSA can be applied to meta-analyses published in the KJA. We believe that this study provides useful insights to better understand the use of this statistical tool.