Introduction
When researchers review a paper, they expect to find scientific and clinically substantiated evidence for the effectiveness of the treatment of interest. To establish scientific evidence, employing a statistical approach encompassing sample size calculations is a common practice. The CONSORT statement includes statistical analysis-related content, such as sample size determination and appropriate statistical method selection, as well as research design components, such as randomization, blindness, and participant selection. Using the appropriate study design to acquire data becomes the foundation for statistical significance throughout statistical analysis. Because Pearson advocated for null hypothesis significance testing (NHST), a P value of 5% has become the threshold for determining statistical significance. Although the widely accepted significance level of 5% for the P value is an indicator of statistical significance, it does not constitute evidence of clinical relevance [1]. According to the International Committee of Medical Journal Editors (ICMJE) recommendations for medical journal standards [2],1) clinical relevance refers to an effect of an intervention or treatment that promotes healing from a certain disease or has another similar positive influence, reduces the complication rate and illness duration, or consequently improves the quality of life. The value of these positive effects is appreciated from various points of view, and the clinical relevance is determined based on the results. We have already introduced confidence intervals and effect sizes in a previous statistical round article entitled “Alternatives to P value: Confidence Interval and Effect size.” When presented with a P value, these indices are good indicators of statistical significance and clinical relevance [3].
In this article, we introduce various types of effect sizes that can be used to describe statistical results and other indices that indicate clinical relevance, such as the minimal clinically important difference (MCID). In addition, we discuss how to interpret and describe statistical results using these indices, which encompass both clinical relevance and statistical significance.
Confidence intervals and effect sizes
Statistical significance is determined according to the decision criteria of NHST. NHST is a statistical method based on validating the null hypothesis (H0: the compared groups do not differ) to determine that “the comparative groups are not different,” except with a type I error, which refers to the probability of accidentally observing a difference that is not there. This interpretation method does not indicate the direction or magnitude of the trial results; it simply indicates whether a statistical difference exists under the fixed significance level. In addition, the P value cannot be used to determine the magnitude of the difference because it is affected not only by the difference but also by the sample size and variability of the measured results [4]. A small absolute difference between central measures of groups can achieve statistical significance if the sample size is sufficiently large to create distinct or slightly overlapping distributions of observed data. Conversely, a large absolute difference between central measures of groups may not be statistically significant if the distributions substantially overlap due to a small sample size. Nonetheless, some researchers misinterpret the P value based on NHST as indicating something is “more significant” or “less significant.” These incorrect interpretations have frequently been presented, even though researchers should know that comparing P values cannot be used to interpret the strength of significance because the NHST implies a dichotomous decision (whether the null hypothesis is true or false) [5]. Confidence intervals and effect sizes can be used to rectify such errors to express the magnitude of the differences or ratios observed in clinical trial results, as discussed in a previous article [2].
Confidence intervals
The confidence interval can be calculated to determine the range estimation using statistical probability. The representative value (e.g., mean), the measure of statistical dispersion (e.g., standard deviation), and the sample size of the group are used to estimate the confidence interval. Although the real mean of the target population is unknown, we can presume, with a preset probability, that the expected mean of a future population in the same environment with the same intervention will be located within this confidence interval. This statistical process enables us to expect an effect from an intervention in a future sample regardless of the unknown real value of the target population. Beyond determining the statistical significance based on whether the confidence interval includes a null value, using a confidence interval allows us to presume the potential direction and magnitude of the effect that may be observed in future patients from the same population who receive the same intervention. The confidence interval provides a range that reflects the statistical uncertainty of sampling and the statistical test process, which enables us to speculate on the expected results in real clinical situations. The P value represents the probability of accepting or rejecting the hypothesis, and the confidence interval represents the range of the estimated representative value along with the uncertainty (margin of error), where the real value of the population would exist [6]. However, the confidence interval is not a property of the observed data but rather a characteristic of a sampling distribution, such as the standard error of the mean (SEM). The sampling distribution is an imaginary distribution composed of the means of data that are repeatedly sampled from the population using the same method as that of the observed data. For example, the means from the groups are the observed values, and the confidence interval of the mean difference is a range estimated by probability and statistics based on the hypothesis. Similarly, the standard deviation, which indicates the dispersion of data, is the observed value, while the upper and lower limits of the confidence interval are statistically estimated values. The confidence interval cannot be interpreted as the mean and the standard deviation explaining the observed data distribution. The confidence interval is interpreted such that if the experiment is repeated using the same hypothesis and a confidence interval is calculated from each experiment, we can expect that the true population mean would fall within the given range of those intervals with a certain probability (usually 95%).
Compared to the dichotomous nature of the P value, including the confidence interval in the statistical result has the advantages described above. However, determining quantitative differences between clinical trials is frequently complex except in cases of mean difference or ratio comparisons.
Effect size
The effect size is a statistic representing the observed effect's standardized magnitude and direction. A detailed description of the basic concept of effect size is provided in a previous article [3]. Table 1 summarizes the effect sizes corresponding to the different statistical analysis methods. Including the effect size in the statistical analysis results overcomes the limitations of the P value and enables descriptions of the quantitative and qualitative magnitude of the treatment effect, making it possible to compare the effects between groups or between trials and, thus, is the main statistic used in systematic reviews. The effect size is a point-estimated value, such as a mean, and a standardized value of an effect of a clinical trial intervention. In this respect, the advantage of the effect size is that it is more intuitive than the confidence interval and easy to interpret its meaning. Considering these advantages, an increasing number of studies have presented statistical results using effect sizes [10–13].
The effect size also has its own confidence interval based on the significance level, and there are often situations where interpretation of effect size using confidence intervals is necessary. Presenting the confidence intervals with the odds ratio (OR), relative risk, and area under the receiver operating characteristic curve is common practice. Various effect sizes can be calculated using R (R Core Team). The supplementary document presents the methods for calculating various effect sizes and the corresponding confidence intervals (Supplementary Materials 1 and 2).
Besides the effect size from a specific statistic, the number needed to treat (NNT; also, the number needed to treat for an additional beneficial outcome [NNTB]) is useful to describe the number of changes between comparison groups. The NNT describes the required number of patients to include in the treatment group to observe a beneficial effect in one patient from the treatment in a clinical trial. The NNT is an epidemiological measurement that is usually used to discuss the treatment effect of a certain medication. In clinical trials, the NNT is considered an index of effect, even though it is not a statistic like the effect size. A large NNT suggests that the experimental treatment is less effective because a large number of patients are required to obtain an effect from the treatment.
The NNT is the inversed value of the absolute risk reduction:
where Ic is the incidence of the control group and It is the incidence of the treatment group.
An example is as follows: a randomized controlled trial is conducted to investigate the preventative effect of Drug A on postoperative nausea and vomiting. The observed postoperative nausea and vomiting rates are 40% and 30% in the control and treatment groups, respectively. The absolute risk reduction is thus 10% (40%–30%) and the NNT is 10. This means that the preventive effect can be observed when 10 patients are treated with Drug A. Similar to the NNT, the number needed to harm (NNH) is an index of a hazardous effect and can also be useful for comparing effects.
Minimal clinically important difference (MCID)
In the early 20th century, MCID was introduced to measure clinical improvement in patients [14]. At the beginning of the 21st century, magnitude-based inference (MBI) was introduced in the field of sports medicine. MBI assesses the observed effects based on three criteria: harmful, trivial (small changes), and beneficial [15]. However, some scholarly journals no longer accept MBI as a valid statistical approach because it lacks a clear mathematical foundation and is associated with an increased risk of type I errors [16,17]. On the contrary, MCID is a statistical method of approaching the difference in the effects perceived by the patient in clinical settings rather than the numerical difference based on statistical significance. This measure is becoming increasingly common in statistical and medical research areas [18,19]. MCID is a representative method for determining clinical relevance that involves setting a specific value of the measured outcome as the threshold for meaningful effects.2) This threshold indicates the minimal amount for important or meaningful changes in the measured outcome to be observed in patients or participants, and changes in the outcome that are larger than this threshold are considered clinically relevant. However, no method is generally accepted as the standard for determining the threshold for clinically relevant changes. Several articles on determining MCID for outcomes in various situations have recently been published in various medical fields [20–24].
MCID is useful for assessing the clinical relevance of the outcome variable in participants. Particularly in pain research, patient-reported outcomes (PROs), such as the visual analog scale (VAS) or numerical rating scale (NRS), are commonly used, along with opioid consumption. The statistical analysis of these results contributes to the clinical values of the findings. However, statistically significant differences in these variables do not constitute an evaluation of the treatment effect as perceived by patients. MCID was thus introduced to define the treatment effect as perceived by the patients. In a study assessing the effect of pain management after surgery, for instance, different minimum thresholds for the clinical importance of pain relief may need to be set for patient groups undergoing different types of surgery, such as abdominal or foot surgeries. Additionally, within the same study, the minimum threshold for judging the side effects of pain medications may vary depending on the severity of pain, as patients may tolerate side effects differently based on pain intensity. Therefore, interpreting differences in opioid consumption in the context of pain relief also differs based on clinical considerations and patient perceptions.
Interpreting MCID often involves testing the statistically significant proportion of patients who achieve a change equal to or greater than MCID in both the control and treatment groups using NHST. Alternatively, researchers may divide the study population into groups based on whether they exhibit a change equal to or greater than MCID and then statistically analyze the factors associated with the observed differences. This approach demonstrates how meaningful effects are observed in an actual patient population beyond simply presenting the differences in treatment effects between the two groups.
A standard method for calculating MCID has not been fully established. Some representative calculation methods include a distribution-based method based on the distribution of observed values and an anchor-based method that involves comparing generally accepted measurements as the standard (anchor) against an evaluation method that is widely used in clinics or more specific evaluation methods. As these methods have various limitations, a new method of comparing and coordinating the results of these methods to determine MCID, known as the triangulating method, has recently been attracting attention.3) In addition, the Delphi method, which involves a panel of experts and patients reaching a consensus on the criteria through multiple rounds and determining MCID through a literature review, is another method. Unfortunately, none of these methods have been accepted as standard because each has advantages and disadvantages.
The distribution-based method follows a process similar to that used to determine the measurement error or effect size. For this method, factors such as the standard error of measurement (SE M = SD 1 - Cronbach ’ s α ( x 1 - x 2 ) / 2 × S E M 2
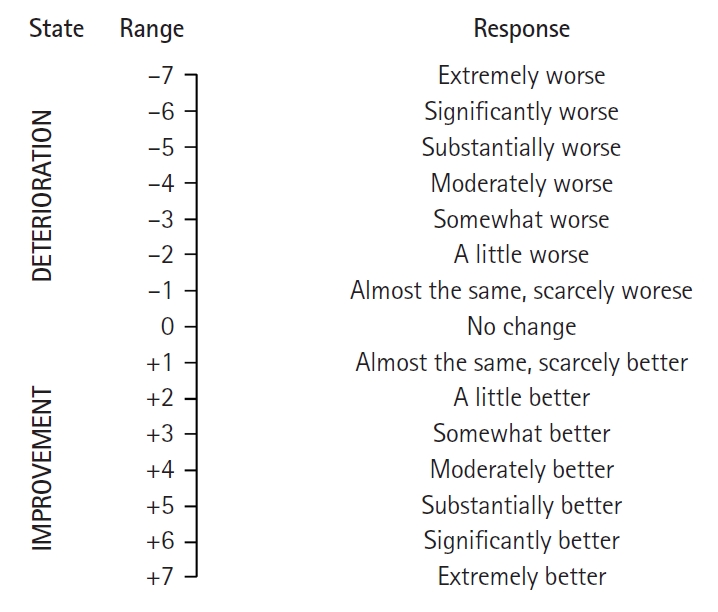
The anchor-based method involves using a reference assessment technique, such as the global assessment scale (GAS) or the global impression of changes (GIC), as an “anchor.” For this method, values measured by individuals or researchers to estimate MCID are used (Fig. 1) [25]. This method involves comparing the mean change in response based on the assessment method under study (e.g., the VAS or NRS, which are PROs) with individual improvement effects based on a comprehensive assessment scale (anchor). This can also be determined using a receiver operating characteristic (ROC) curve analysis. This method begins with the assumption that the measurement method used is significantly associated with a reference evaluation method (anchor) chosen from among various assessment methods. Therefore, a relatively strong correlation is desirable (correlation coefficient ≥ 0.7). If a meaningful correlation is not observed, having strong confidence in the changes observed using the measurement values applied in a study is challenging. Furthermore, if a comprehensive assessment scale is evaluated retrospectively, relying on patients’ memory may lead to recall bias. Therefore, re-validating the results using additional measurable criteria (anchors), such as analgesic consumption, to mitigate potential bias is advised [26].
Given that multiple methods are available to determine MCID, a variety of MCID values can be calculated for the same patients in the same situation. Although comparing and reconciling the outcomes of various methods using the triangulating method is advised, a comprehensive systematic approach for this purpose has not yet been established. The process typically begins with a distribution-based analysis, followed by a supplementary evaluation using a comprehensive assessment scale. Subsequently, among MCID values identified using these two methods, researchers often employ ROC analyses to determine the most appropriate choice, or they may opt for the average of these values as the final MCID [27,28]. Given the lack of established statistical methods for these procedures, the recommended approach for establishing the robustness of the selected MCID value involves conducting a sensitivity analysis. This analysis assesses the impact of assumptions on outcomes, examines how changes in these assumptions affect results, and identifies uncertainties in research design and data collection processes. By evaluating their impact on final outcomes, researchers can verify the consistency of research findings under different conditions and enhance the reliability of their results. In the supplementary document, the overall process for calculating MCID along with an example of conducting the sensitivity analysis is presented.
Additional considerations must also be taken into account. First, the fundamental notion of “minimal” must be adequately considered. Determining whether the measurement tool used (e.g., the VAS or NRS) adequately captures the minimum amount of change is essential. If the instrument does not reflect the minimum change reported by the patient, this can lead to increased errors due to inaccurate measurements. Furthermore, the minimum change reported by patients is influenced by their perception thresholds; thus, measurement tools that can capture this should be employed. Research in the field of psychophysiology indicates that the minimum change based on patient reports is approximately 0.5 standard deviations (SD) of the effect size. This value is often used in anchor-based methods that rely on reference-assessment techniques. Second, even for results obtained using the same measurement tool, various factors influence MCID value, such as the study setting, participants, and the method of calculation. Therefore, applying an established MCID from one specific study to a clinical trial is challenging. To use a previously reported MCID, researchers must assess and consider the differences between the circumstances of the research conducted to determine MCID and the current one being conducted.
Clinical relevance vs. statistical significance
As discussed previously, the presence of statistical significance in the data analysis does not imply clinical relevance. Conversely, the absence of statistical significance does not necessarily mean a lack of clinical relevance. The latter scenario often arises when a study is conducted with an inadequate sample size or when the method of measuring the outcome variable exhibits significant variability. For instance, if the severity of postoperative nausea is recorded by the patients themselves using an NRS, patients’ subjectivity cannot be entirely eliminated. Depending on the circumstances, similar levels of nausea symptoms could be measured differently. Consequently, even if an antiemetic with a potentially meaningful effect is administered, statistical significance may not be attainable. The concept of clinical relevance lacks an agreed-upon definition, and traditionally, many studies have assessed clinical relevance based on statistical significance.
The clinical effects reflected by the effect size estimate the average effect observed in the experimental group due to the intervention, allowing for the interpretation of the magnitude of the effect. However, the effect size does not provide a specific indication of how much an individual can expect to benefit; rather, it captures the overall effect, encompassing the entire group. Furthermore, the effect size is a dimensionless comparative measure, which means interpreting it directly at an individual level is challenging. One benefit of MCID is that it employs the same units of measurement as the actual variable, enabling assessment of clinical relevance for specific patients. It can serve as a reference for deciding whether to continue the current treatment or consider alternative approaches in individual patients within a clinical context. Essentially, it enables assessment at the individual level. Furthermore, integrating MCID in research facilitates its application in the evaluation of novel treatment methods.
However, MCID also has several limitations. In addition to the issues of bias and lack of established calculation methods mentioned earlier, the assessment of treatment effects through MCID can vary depending on the patient’s circumstances or past experiences. For example, required MCID may be higher if a patient experienced higher pain levels before treatment. Similarly, if a patient has repeatedly encountered similar types of pain in previous experiences, a greater effect might be required to achieve a state of comfort. Additionally, because MCID represents the smallest meaningful effect, it may not be suitable as a criterion for judging meaningful outcomes of a particular clinical intervention that aims to achieve substantial treatment efficacy [29]. The limitations of MCID continue to be evident. Anchor-based methods are often difficult to conduct given the lack of appropriate anchor measurements for a wide range of cases. Distribution-based methods frequently result in findings that lack clinical meaning for the chosen criteria and variable MCID values owing to changing criteria with every sample extraction, even when the same study is repeated.
Conclusion
Researchers and medical practitioners have developed new treatments and medications based on accumulated evidence from clinical trials, aiming to offer patients the best possible care. Research outcomes that demonstrate statistically significant differences are the strongest evidence provided that they are sufficiently clinically relevant. The statistical significance of a research outcome is determined through a binary decision-making process that involves a mathematic calculation based on the null hypothesis, which states that no difference or effect is present. However, clinical decision making requires constructive information on the expected effect of the treatment or medication, beyond the presence or absence of an effect. The effect size is a standardized statistic (value) of the magnitude and direction of change observed in a study, and MCID is a robust threshold for determining clinical relevance.
By combining metrics of clinical relevance, such as the effect size and MCID, with the conventional application of statistical significance and presenting outcomes derived from robust research designs, it becomes imperative that we can establish a foundation that holds both scientific and clinical significance. This approach has the potential to enhance our understanding not only from a scientific standpoint but also in terms of the practical clinical implications.