Frequency domain analysis of photoplethysmographic and arterial pressure waveforms for assessing hemodynamics in children with congenital heart surgery
Article information

Abstract
Background
Time-domain parameters are less reliable in children due to increased arterial and chest wall compliance. We assessed the ability of indices derived from frequency analysis of photoplethysmography (PPG) and arterial blood pressure (ABP) waveforms to predict the hemodynamic state in children undergoing congenital heart surgery.
Methods
We analyzed waveforms after cardiopulmonary bypass period in 76 children who underwent total repair of congenital heart disease. Amplitude density of baseline and amplitude modulation in PPG and ABP by respiratory frequency were obtained using fast Fourier transform analysis and normalized by cardiac pulse height (representing respiratory modulations in venous blood [PPG-DC%] and in amplitude [PPG-AC%] at respiratory frequency). The ratio of amplitude density of PPG at the cardiac frequency (CF) to ABP-CF was used to assess vascular compliance. We assessed volume replacement (ml/kg) and vasoactive inotropic score (VIS).
Results
Children requiring volume replacement > 10 ml/kg (15.8%) showed higher PPG-DC% than those not requiring it (median: 52.4%, 95% CI [24.8, 295.1] vs. 36.7% [10.7, 125.7], P = 0.017). In addition, children with a VIS > 7 (22.4%) showed higher PPG-CF/ABP-CF (3.6 [0.91, 10.8] vs. 1.2 [0.27, 5.5], P = 0.008). On receiver operating characteristic curve analysis, PPG-DC% predicted a higher fluid requirement (area under the curve: 0.71, 95% CI [0.604, 0.816], P = 0.009), while PPG-CF/ABP-CF predicted a higher VIS (0.714, [0.599, 0.812], P = 0.004).
Conclusions
Frequency domain analysis of PPG and ABP may assess hemodynamic status requiring fluid or vasoactive inotropic therapy after congenital heart surgery.
Introduction
When dealing with infants, their hemodynamic status should be considered when replacing intravascular volume or administering vasoactive inotropic agents, especially after congenital heart surgery. Elaborate hemodynamic management is crucial in these cases due to the chances of relapse of preexisting ventricular dysfunction, immature myocardium, inflammation, and edema resulting from cardiopulmonary bypass, and acute changes in anatomical geometry [1–3]. Excessive fluid therapy in these patients can cause pulmonary congestion [4], while the unnecessary use of vasoactive inotropic drugs may cause hyperdynamic outflow obstruction or afterload overloading [1,5]. Unfortunately, hemodynamic monitoring following congenital heart surgery in pediatric patients has been challenging.
Dynamic indices based on ventilation-induced fluctuations in arterial pressure or stroke volume have been established as predictors of fluid responsiveness in various clinical situations over the past two decades. Unlike adults, the increased compliance of arterial and chest walls in young infants contributes to inconclusive results in numerous studies investigating the reliability of dynamic indices [6,7]. The photoplethysmographic (PPG) waveform appears to be dependent on alterations in blood volume within peripheral blood vessels [8]. Considering that PPG is relatively unaffected by arterial and thoracic compliance, PPG indices, such as respiratory changes in PPG amplitude (ΔPOP) or pleth variability index (PVI), have been suggested. However, parameters derived from time-domain analysis, such as ΔPOP and PVI, are also limited in children [9].
Frequency-domain analysis of PPG has been introduced for the early detection of hypovolemia in children undergoing surgery [10,11]. The parameter of baseline modulation of PPG at respiratory frequency (PPG-amplitude density of baseline [DC]) reflects fluctuations in nonpulsatile venous blood volume and can be sensitive to intravascular reserve volume [10]. Additionally, it has been suggested that peripheral arterial compliance can be estimated by calculating the ratio of amplitude fluctuations in volume (PPG) at cardiac frequency (CF) (PPG-CF) to amplitude fluctuations in arterial blood pressure (ABP) at CF (ABP-CF) [12]. Frequency analysis of PPG variability can address the limitations of time-domain analysis by performing the analysis within a sufficiently large window to overcome artifacts and ragged variations.
Therefore, we aimed to investigate the feasibility of frequency-analyzed variables of PPG and ABP for predicting the requirement of fluid and vasoactive inotropic agents during the immediate postoperative period of congenital heart surgery in children.
Materials and Methods
Study design and subjects
This retrospective study utilized electronic medical records and a database of children under six years of age who underwent total repair of congenital heart defects with median sternotomy at a single tertiary institution between April 2019 and May 2020. Patients with incomplete data and those whose operations concluded with an open sternum were excluded. The study design was approved, and informed consent was waived by the local Institutional Review Board (Asan Medical Center, protocol number 2023-0489). The study was conducted in accordance with the Declaration of Helsinki, 2013 and its subsequent amendments.
General anesthesia and hemodynamic monitoring
As per the standardized protocol of our institution [13], all patients received an intravenous premedication with 0.5–1.0 mg/kg of midazolam upon entering the operating room. Anesthesia was induced using thiopental sodium (1.5–2.0 mg/kg) or ketamine (1–2 mg/kg), subsequent to midazolam (0.1–0.2 mg/kg), depending on the anesthesiologist’s judgment with clinical endpoints, such as loss of eyelash reflex. In patients where maintaining systemic vascular resistance is crucial, such as in cases of tetralogy of Fallot, anesthesia was induced with ketamine instead of thiopental. After endotracheal intubation facilitated by rocuronium, anesthesia was maintained through a continuous infusion of midazolam, remifentanil, and rocuronium.
Intraoperative routine monitoring included five-lead electrocardiography, pulse oximetry, ABP, central venous pressure, capnography, and regional oxygen saturation of the brain, kidneys, and intestines. All measurements collected from monitoring devices were recorded in the database using Vital Recorder that automatically records the physiological data of surgical patients in real-time (https://vitaldb.net) [14].
Management during the post-cardiopulmonary bypass period
The patient was successfully weaned from cardiopulmonary bypass after total corrective surgery, as confirmed by transesophageal echocardiographic evaluation performed by a pediatric cardiologist. Dopamine, epinephrine, and/or milrinone were administered if ventricular function was impaired based on transesophageal echocardiographic findings. Fluid replacement was also carried out when preload was insufficient. The hematocrit was maintained at 27%–30% through transfusion of leukocyte-filtered red blood cells. Mechanical ventilation was set at 8–10 ml/kg of expiratory tidal volume, and the respiratory rate was adjusted based on PaCO2 and acid-base balance.
Frequency domain analysis of PPG and ABP
Waveforms of PPG and ABP were extracted during the post-cardiopulmonary bypass stage for a duration of 3 min, specifically between sternum closure and the end of surgery. We excluded data with poor signal quality, determined visually, and based on the PPG reliability index of 0.1 provided by the patient monitor (IntellivueTM Patient Monitor MP70, Philips Medizin Systeme Boeblingen GmbH). These waveforms were then analyzed using LabChart 7.37 (ADInstruments). Fast Fourier transform was applied for frequency-domain analysis of the waveforms, with the spectrum view set using the following parameters: spectrum, 4K (40 s at 100 Hz) Hamming window, amplitude density, and 93.75% overlap over a three-minute window [12]. Parameters of PPG and ABP were calculated following the method described by Alian et al. [10,12], and are presented as follows and shown in Fig. 1;
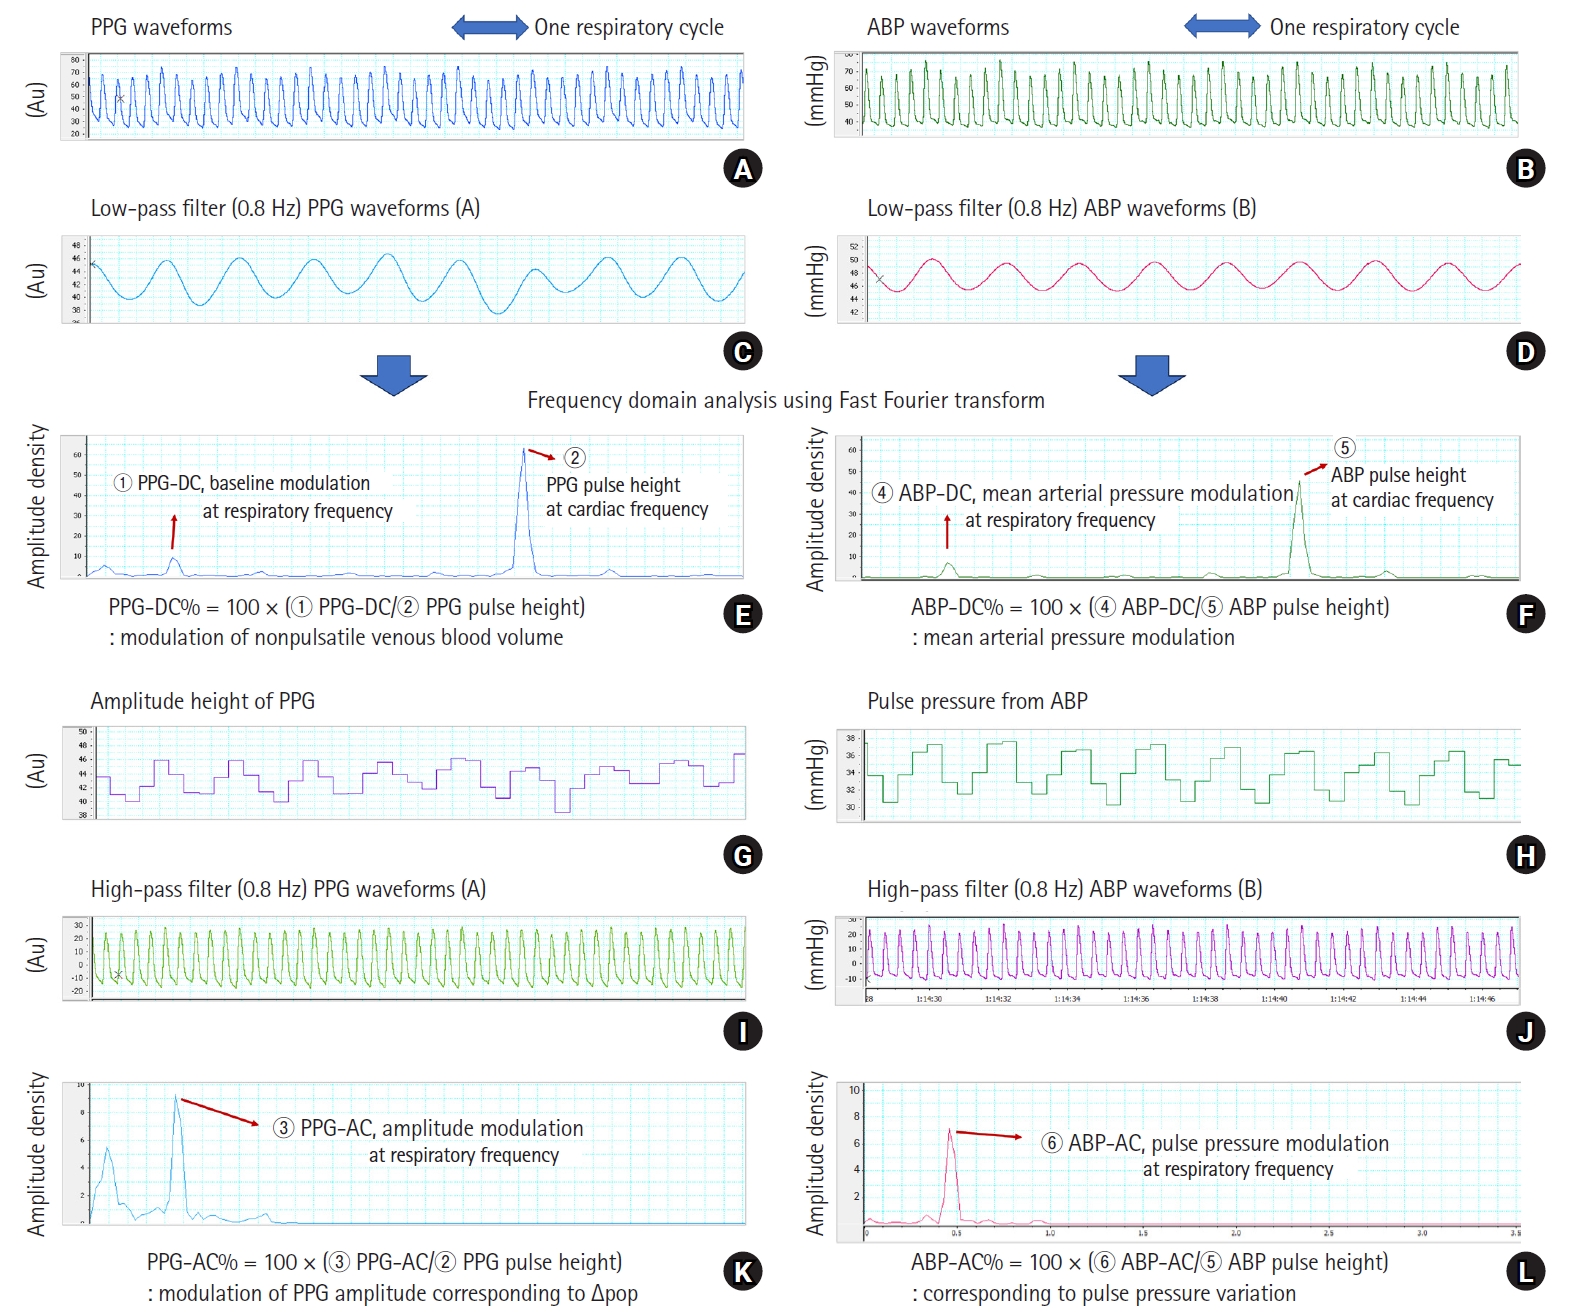
Waveforms of PPG and ABP extracted during the post-cardiopulmonary bypass period and frequency analysis of each parameter. Low-pass filter (< 0.8 Hz) is applied to the raw PPG and ABP waveforms (A and B) for extracting respiratory-induced baseline modulation (C and D). Using fast Fourier transformation of these waveforms, the DC component at respiratory frequency and pulse height peak at CF can be obtained (E and F). Corresponding to the changes in the PPG amplitude and pulse pressure (G and H), respiratory-induced height modulation is obtained using high-pass filter (≥ 0.8 Hz) (I and J) on the raw PPG and ABP waveforms. The AC peak at the respiratory frequency (K and L) is obtained using the same method as described above. ABP: arterial blood pressure, AC: amplitude modulation at respiratory frequency, Au: arbitrary unit, CF: cardiac frequency, DC: baseline modulation at respiratory frequency, PPG: photoplethysmography. All variables are normalized by dividing the DC and AC parameters by the amplitude density of pulse height at CF of raw PPG and ABP waveforms (DC% and AC%). The meanings of each are as follows. PPG-DC%: modulation of non-pulsatile venous blood volume, ABP-DC%: mean arterial pressure modulation, PPG-AC%: corresponding respiratory changes in PPG amplitude by time-domain analysis, ABP-AC%: corresponding to pulse pressure variation by time-domain analysis.
PPG-DC: This represents the amplitude density of the peak at the respiratory frequency on the spectrum derived from the analysis of baseline changes in raw PPG. It indicates the modulation of non-pulsatile venous blood volume (Figs. 1A, C, and E).
ABP-DC: This indicates the amplitude density of the peak at the respiratory frequency on the spectrum derived from ABP analysis, known as mean arterial pressure modulation (Figs. 1B, D, and F).
PPG-AC: This signifies the amplitude density of the peak at the respiratory frequency on the spectral analysis of PPG pulse height, demonstrating the modulation of PPG amplitude corresponding to ΔPOP by time-domain analysis (Figs. 1G, I, and K).
ABP-AC: This denotes the amplitude density of the peak at the respiratory frequency on the spectrum of pulse pressure analysis, corresponding to pulse pressure variation by time-domain analysis (Figs. 1H, J, and L).
For intraindividual normalization of DC and AC parameters, all variables were divided by the amplitude density of the peak at the CF (cardiac pulse height) on the spectrum of each waveform analysis. Each normalized parameter was expressed as a percentage (DC% and AC%) (Fig. 1).
Peripheral vascular compliance was estimated by calculating the ratio of the PPG-CF to the ABP-CF; Peripheral vascular compliance = PPG-CF/ABP-CF).
Postoperative outcomes
All patients were managed according to the protocol under the supervision of the intensive care specialist from the Department of Pediatric Cardiac Surgery. The total volume of albumin, red blood cells, and fresh frozen plasma administered within 2 h after arrival in the intensive care unit (ICU) was measured, excluding the total volume of crystalloids. The volume replaced in the ICU was divided by the patient’s weight (ml/kg). The maximal dosages of vasoactive inotropic agents during the first two hours in the ICU were recorded, and the vasoactive inotropic score (VIS) was calculated using the formula: VIS = dopamine dose (μg/kg/min) + dobutamine dose (μg/kg/min) + 100 × epinephrine dose (μg/kg/min) + 10 × milrinone dose (μg/kg/min) + 10,000 × vasopressin dose (units/kg/min) + 100 × norepinephrine dose (μg/kg/min) [15]. Additionally, the durations of mechanical ventilation and ICU stay were obtained.
Statistical analyses
The data were presented as the median with interquartile range (IQR) or median with 95% CI. Fisher’s exact test was used for categorical variables, while the Mann–Whitney U test was applied for continuous variables to compare between the two groups. Associations among frequency domain variables were determined using Pearson correlation after log-transforming non-normally distributed variables before analysis.
Higher requirements of fluid and vasoactive inotropic agents were defined as a volume of fluid > 10 ml/kg and VIS > 7, respectively. These outcomes were dichotomized using cutoff values based on the third quartile of each variable. Patients meeting the cutoff value (fluid = 10 ml/kg and VIS = 7) were classified into the group with lower requirements. The predictive abilities of frequency domain-derived parameters for a higher requirement of fluid and vasoactive inotropic agents were assessed using receiver operating characteristic (ROC) analysis. The areas under the curves (AUCs) were compared across different variables, and optimal thresholds were determined.
All statistical analyses were performed using the R statistical package system version 4.2.0 (GNU General Public License, Copyright Free Software Foundation, Inc. https://www.r-project.org/), employing the ggplot2 (github.com/tidyverse/ggplot2) and plotROC (https://sachsmc.github.io/plotROC/) packages. A P value < 0.05 was considered statistically significant.
Results
The final analysis included data from 76 patients. The demographic characteristics and data derived from the frequency domain analysis are summarized in Table 1. Ventricular septal defect was the most frequently diagnosed condition, followed by tetralogy of Fallot (Supplementary Table 1). The median fluid amount administered during the 2 h after ICU admission was 8 ml/kg (0, 10), and the median VIS was 5 (1.5, 7). Pulmonary hypertension was observed in 19.7% of cases, predominantly attributed to ventricular septal defects with right-to-left shunts (Supplementary Table 1). Patients with pulmonary hypertension exhibited longer mechanical ventilation periods and ICU stays compared to those without it; however, no significant differences were observed in other variables (Supplementary Table 2). Among patients with concomitant pulmonary hypertension, two cases (2/15) demonstrated a higher requirement for fluid, and their PPG-DC% values were 93.8% and 99.1%, respectively, higher than patients with lower fluid requirements. Additionally, peripheral vascular compliance was higher in patients with high VIS in the presence of pulmonary artery hypertension, with a median value of 5.0, compared to that in patients with low VIS (Supplementary Table 3).
Patient Characteristics and PPG and ABP Derived Hemodynamic Parameters
Patients who received fluid > 10 ml/kg (n = 12, 15.8%) did not show significant differences in demographics and postoperative outcomes compared to those who received fluid ≤ 10 ml/kg. However, PPG-AC% and PPG-DC% in patients with a higher requirement of fluid were significantly higher compared to that in patients who did not have a higher requirement (PPG-AC%: median 37.6%, 95% CI [5.6, 202.6] vs. 18.4 [3.5, 95.3], P = 0.022; PPG-DC%: 52.4 [24.8, 295.1] vs. 36.7 [10.7, 125.7], P = 0.017), while there was no difference in ABP-AC% and ABP-DC% (Table 1). Among patients with a higher VIS (> 7) (n = 17, 22.3%), significant differences were observed—they were notably younger and had longer durations of mechanical ventilation and ICU stay. During the first 2 h after ICU admission, lower systolic and diastolic ABP were observed. Peripheral vascular compliance was significantly higher in patients with VIS > 7 compared to that in patients with VIS ≤ 7 (median: 3.6, 95% CI [0.91, 10.8] (Table 1).
The DC% of PPG and ABP showed a high correlation with the AC% of PPG and ABP, respectively (r = 0.645, P < 0.001 and r = 0.893, P < 0.001). Although the correlation between PPG and ABP was statistically significant for DC% and AC%, the correlation coefficient was relatively low. Linear correlation between frequency domain variables and fluid requirements or VIS was not statistically significant (Fig. 2). ROC curve analysis revealed that the AUC of PPG-DC% was the greatest for predicting a higher requirement of fluid (AUC: 0.719, 95% CI [0.604, 0.816], P = 0.009), with a cutoff value > 39.7%. PPG-AC% also had a significant AUC (0.710, 95% CI [0.594, 0.808], P = 0.036), with a cutoff value > 29.7% (Figs. 3A and B). However, ABP-AC% and ABP-DC% did not show significance in predicting fluid requirements (Figs. 3C and D). Peripheral vascular compliance > 2.9 predicted a VIS > 7 with an AUC of 0.714 (95% CI [0.599, 0.812], P = 0.004) (Fig. 4).
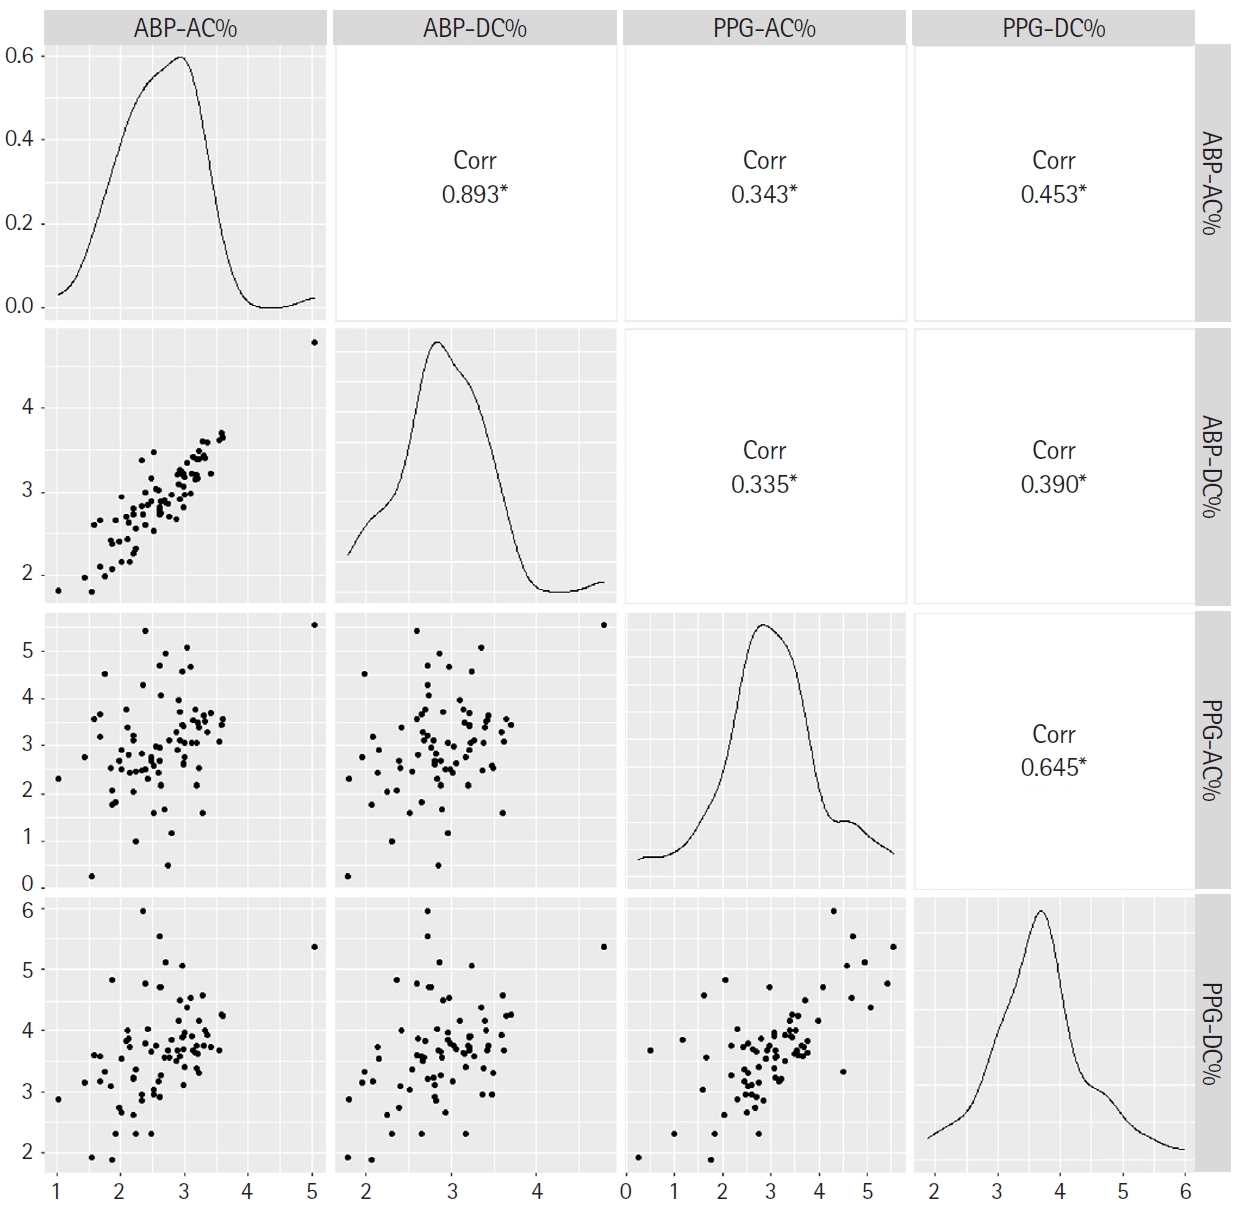
Scatter plots of correlations of each pair of AC% and DC% of PPG and ABP. The DC% of PPG and ABP showed a high correlation with the AC% of PPG and ABP, respectively. All variables are logarithmic transformed for diagonal distribution with Pearson correlation. ABP: arterial blood pressure, AC: amplitude modulation at respiratory frequency, Corr: correlation coefficient, DC: baseline modulation at respiratory frequency, PPG: photoplethysmography. *P < 0.001. For intraindividual normalization of DC and AC parameters, all frequency domain parameters are divided by the amplitude density of the peak at the cardiac frequency on the spectrum of each waveform analysis (DC% and AC%).
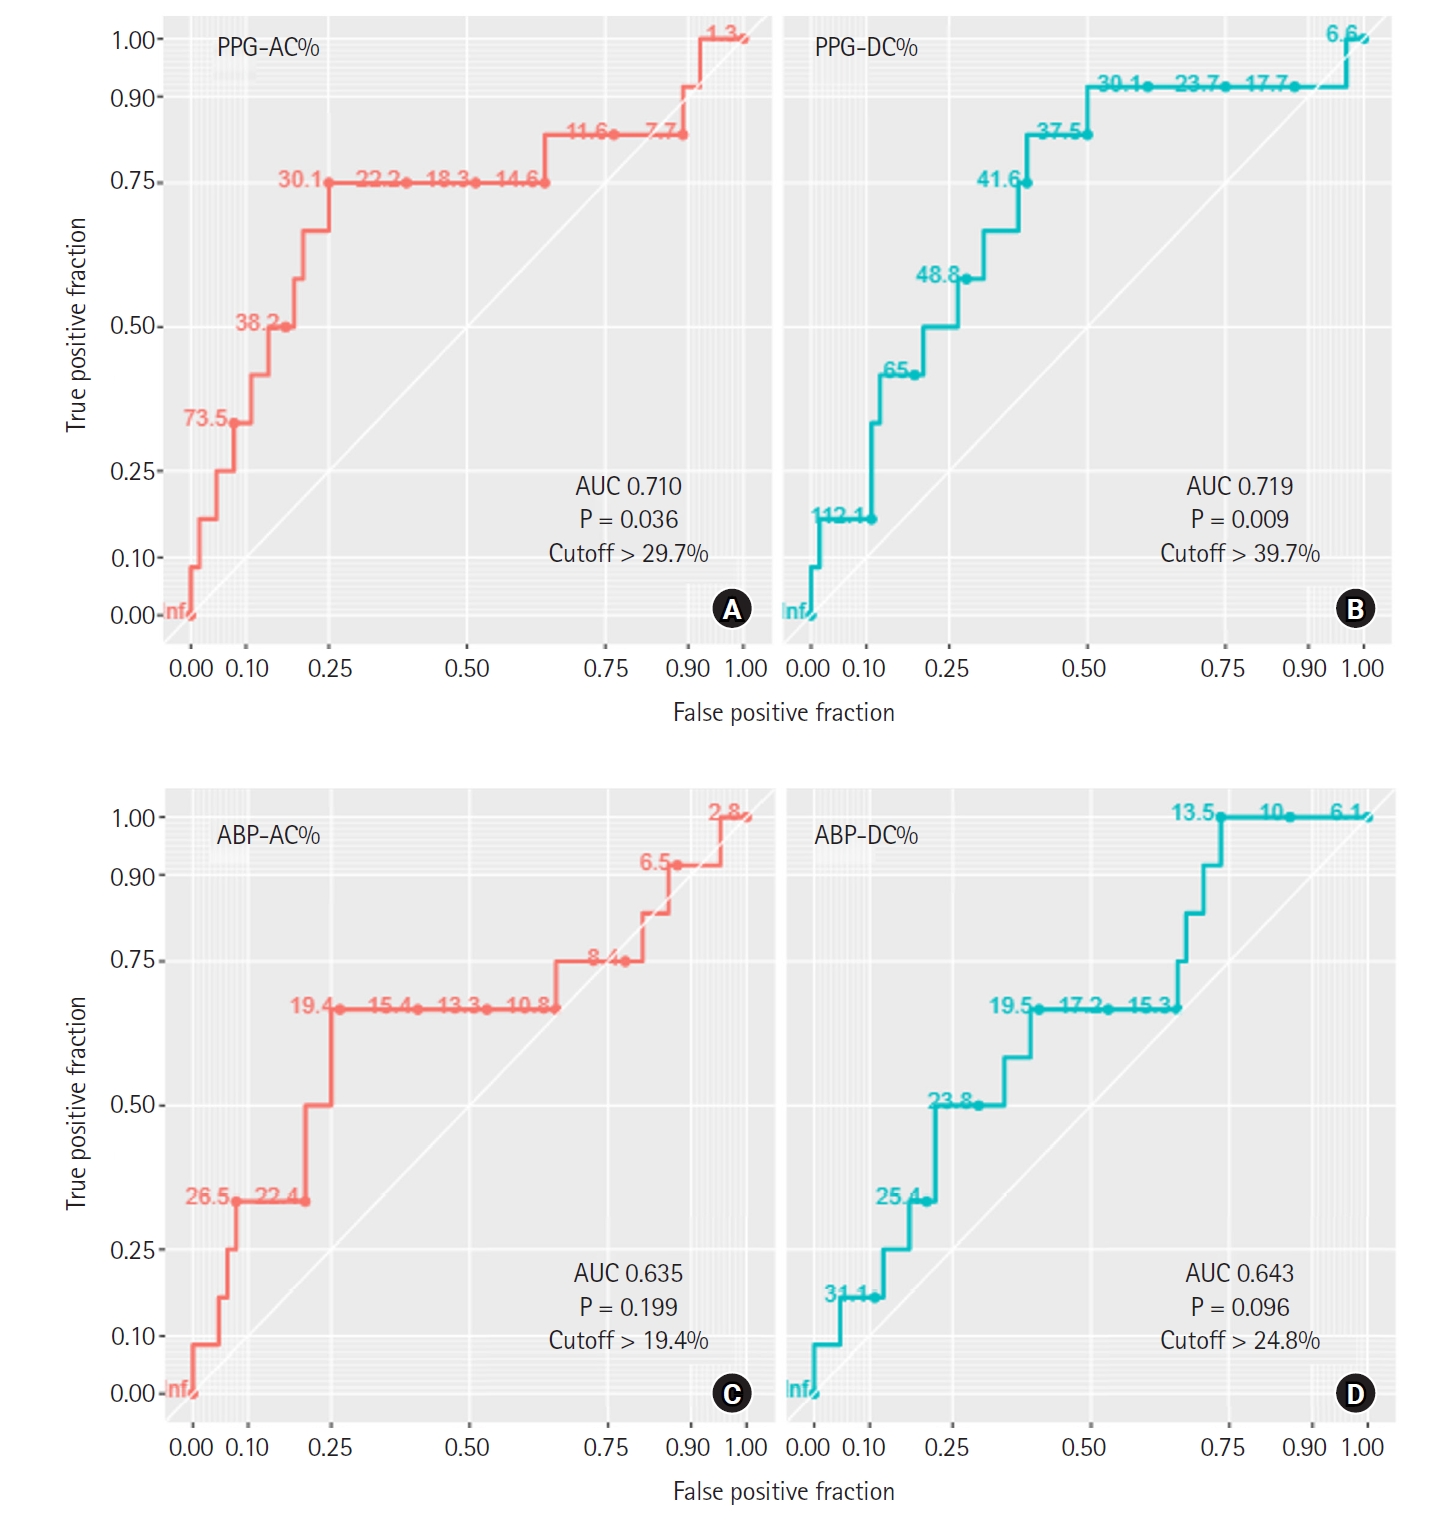
ROC curves of DC% and AC% of PPG and ABP for prediction of high fluid requirement. The AUC of PPG-DC% is the greatest for predicting a higher requirement of fluid, and PPG-AC% is also statistically significant (A and B). However, ABP-AC% and ABP-DC% do not show significance in predicting fluid requirements (C and D). ABP: arterial blood pressure, AC: amplitude modulation at respiratory frequency, AUC: area under the curve, DC: baseline modulation at respiratory frequency, PPG: photoplethysmography, ROC: receiver operating characteristic. For intraindividual normalization of DC and AC parameters, they are divided by the amplitude density of the peak at the cardiac frequency on the spectrum of each waveform analysis (DC% and AC%).
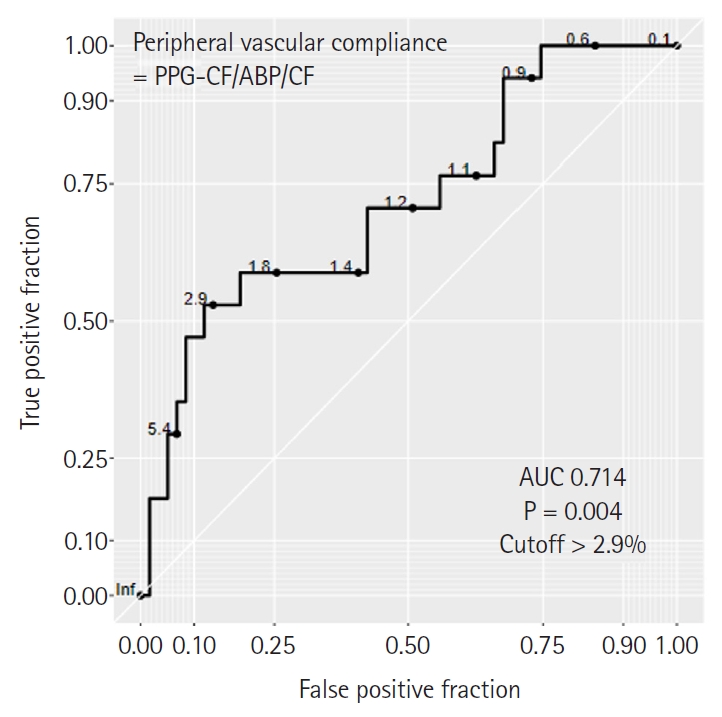
ROC curves of peripheral vascular compliance derived from frequency domain analysis of PPG and ABP for predicting high vasoactive inotropic use. Peripheral vascular compliance with cut-off > 2.9 can predict a higher VIS > 7 (AUC of 0.714 [95% CI 0.599, 0.812], P = 0.004). Peripheral vascular compliance is defined as the ratio of amplitude density of PPG at the CF (PPG-CF) to the amplitude density of ABP at the CF (ABP-CF). ABP: arterial blood pressure, AUC: area under the curve, CF: cardiac frequency, PPG: photoplethysmography, ROC: receiver operating characteristic, VIS: vasoactive inotropic score.
A representative example is shown in Fig. 5. There was a significant difference in PPG-DC% and PPG-AC% between patients who received a larger volume of fluid and those who did not. On the other hand, the difference in ABP-DC% and ABP-AC% was not significant (Fig. 5).
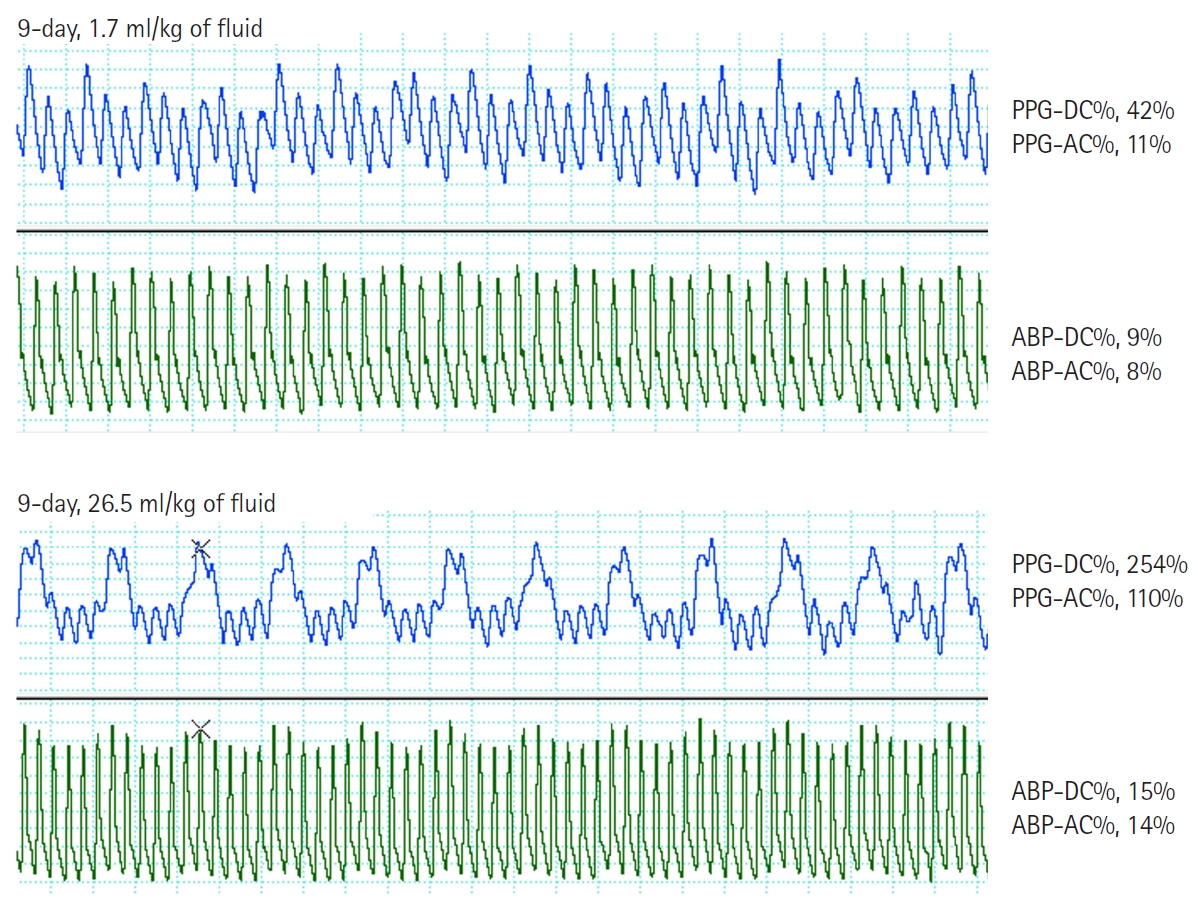
Representative waveforms of PPG and ABP. One patient who postoperatively received 26.5 ml/kg of fluid shows markedly higher values of PPG-DC% and PPG-AC% than a patient with the fluid requirement of 1.7 ml/kg. In comparison with PPG variables, ABP-DC% and ABP-AC% are not significantly different between the two patients. PPG: photoplethysmography, DC: baseline modulation at respiratory frequency, AC: amplitude modulation at respiratory frequency, ABP: arterial blood pressure. For intraindividual normalization of DC and AC parameters, all frequency domain parameters are divided by the amplitude density of the peak at the cardiac frequency on the spectrum of each waveform analysis (DC% and AC%).
Discussion
The present study showed that the frequency domain analysis of PPG and ABP waveforms can predict the requirement of fluid by providing information on the fluctuation in intravascular volume according to ventilation. Specifically, we found that the baseline modulation of PPG (PPG-DC%) was a more reliable predictor of fluid requirement compared to that in ABP-derived indices. Waveforms of PPG can be distinguished from waveforms of ABP in that a pulse of PPG reflects a change in blood volume within the peripheral blood vessels beneath the pulse oximetry sensor [8]. Based on the principles of pulse oximetry, baseline modulation refers to changes in non-pulsatile venous blood volume, while modulation of the cardiac pulse reflects changes in arterial blood volume, represented by PPG-DC% and PPG-AC%, respectively [10,12]. In this study, the correlation between PPG and ABP was statistically significant for DC% and AC%; however, the correlation coefficient was relatively low. This can be attributed to the difference in what PPG and ABP represent. PPG reflects changes in blood volume, whereas ABP reflects changes in pressure as represented by each waveform. It was observed that fluid requirements and VIS exhibited no significant linear correlation with the frequency domain variables. This result suggests that the degree of increase in the frequency domain variables does not linearly reflect the level of fluid requirement or dose of vasoactive inotropic agents.
When intravascular volume begins to decrease, the venous reserve volume will decrease first to maintain effective circulating volume in the arterial system [10]. Additionally, it is known that the AC component of PPG varies depending on the vascular compliance affected by the sympathetic tone [16]. Therefore, fluctuations in peripheral venous volume occur earlier than those in arterial pulsation, and PPG-DC%, indicating venous reserve, may be more predictable for the early detection of hypovolemia compared to PPG-AC%.
In contrast, ABP waveforms are formed by changes in pressure. As pressure is influenced by heart rate and vascular resistance/compliance, as well as volume, oscillation in ABP solely reflects intravascular volume status. In children, the unreliability of ABP-derived dynamic indices can be mainly explained by increased vascular compliance [17,18]. Theoretically, the non-pulsatile venous blood volume of baseline modulation of PPG is nearly impervious to local vascular compliance [16,19]. Therefore, ABP-DC% and ABP-AC% may be insufficient as indices for predicting fluid responsiveness (Fig. 5).
Frequency domain analysis using the fast Fourier transform allows us to isolate oscillations in waveforms at specific frequencies. This method enables the quantification of oscillatory magnitude at cardiac or respiratory frequencies, as needed. Particularly for young infants with rapid respiratory rates, low tidal volume, and subtle changes in low amplitude, spectral analysis may be a preferable method for integrating changes across a time window sufficient to reflect heart-lung interaction.
Arterial compliance can be calculated from the pressure-volume relation that is defined as volume divided by pressure. Similarly, peripheral vascular compliance, as determined by the frequency domain analysis, is regarded as the ratio of the amplitude density of PPG at the CF (PPG-CF, corresponding to Δ volume) to the amplitude density of ABP at the CF (ABP-CF, corresponding to Δ pressure) [12,20]. Previous reports have demonstrated substantial changes in peripheral vascular compliance derived from PPG in patients with pheochromocytoma under the influence of vasodilators (e.g., nitroprusside) or surgical stimulation [12].
In the current study, we established the cutoff values for higher requirements of fluid and vasoactive inotropic agents using the third quartile of each variable. While there are limited studies on higher fluid requirement in children immediately after cardiac surgery, one study showed that the median fluid bolus dose in a cardiac ICU for children with hypotension was 5 ml/kg [21]. Although the cutoff values were derived from our study’s dataset, they may be broadly applicable, as most studies investigating fluid responsiveness have selected a fluid bolus dose of 10 ml/kg [6]. Regarding higher VIS, it has been reported that VIS > 5–10 is associated with postoperative outcomes [22,23].
Patients with higher VIS experienced a more prolonged duration of mechanical ventilation and ICU stay compared to those with lower VIS. This finding can be explained by the observation that younger patients, including neonates, are more susceptible to cardiovascular dysfunction immediately after cardiopulmonary bypass [24]. Consequently, they require a higher dose of vasoactive inotropic agents to maintain hemodynamic stability. Intraoperative ABP just before leaving the operating room did not differ between patients with higher VIS and lower VIS, whereas peripheral vascular compliance was significantly different between the two groups. This result supports the hypothesis that PPG-CF/ABP-CF, as an index reflecting early changes in vascular compliance, could help determine whether the addition of vasoactive inotropic agents is needed to maintain adequate ABP.
In our study, approximately 20% of patients had pulmonary hypertension. Among infants undergoing congenital heart surgery, ventricular septal defects with unrestricted left-to-right shunts were the most common. These patients often experience impaired cardiac function immediately after surgery, requiring caution in fluid administration. However, conventional indicators are known to be less reliable in cases of right ventricular dysfunction or pulmonary hypertension due to the influence of the heart-lung interaction [25,26]. Considering the possible impact of the cardiac-pulmonary interaction on the waveform changes of PPG and ABP in our study, careful interpretation is necessary. In this study, statistical significance in the sub-group analysis of pulmonary hypertension couldn’t be reasonably assured due to the small sample size. Nevertheless, among patients with pulmonary hypertension, those requiring higher fluid showed elevated PPG-DC% and the high VIS group exhibited increased peripheral vascular compliance. These findings support the fact that PPG-DC% may be less affected by right ventricular dysfunction or pulmonary hypertension compared to other indicators, as it reflects the reserve of basal venous blood flow. However, a fluid challenge may not induce an increase in the LV preload and stroke volume since the venous return into the right heart with pulmonary hypertension may not produce adequate ejection to the left heart [26]. Further research is needed to investigate the predictability of fluid responsiveness using frequency domain analysis of PPG in patients with right ventricular dysfunction, including pulmonary hypertension.
This study has some limitations. Firstly, we investigated the abilities of the frequency domain variables from PPG and ABP waveform analysis to predict hypovolemia or increased vascular tone in advance. Additionally, this study was performed retrospectively that inherently limited our control over intraoperative and postoperative management, despite having a predefined and standardized protocol. Therefore, prospective studies are needed to elucidate the reliability of frequency domain variables as functional hemodynamic monitoring tools, by directly measuring changes in cardiac output or vascular compliance in response to fluid/drug challenges. Secondly, there is currently no known method to calibrate one’s PPG waveform for inter-personal comparison using absolute values. Moreover, commercial pulse oximetry devices have functions such as auto-gain and filtration to optimize PPG display [27]. Therefore, we applied normalization of parameters derived from PPG fluctuations by dividing the amplitude of the cardiac pulse [10]. This method has been previously employed in known time-domain variables such as ΔPOP and pulse pressure variation by dividing the differences in the maximum and minimum amplitude by the average value of the maximum and minimum amplitude [28]. In addition, rapid changes in the body temperature related to cardiopulmonary bypass can lead to differences between the central and peripheral blood pressure. Even though the difference between the central and peripheral pressures is less significant in infants compared to adults, it may not be eliminated [29]. Therefore, ABP-derived dynamic indices that are primarily influenced by vascular compliance may be less reliable immediately after cardiopulmonary bypass. The vasomotor changes that occur immediately after cardiopulmonary bypass also affect the PPG waveform [8,30]. To minimize this effect, we used PPG waveforms obtained stably at normal body temperature during skin closure. Additionally, we excluded the data considering poor signal quality based on the PPG reliability index.
In children immediately after cardiopulmonary bypass for congenital heart surgery, determining whether the patient requires fluid or vasoactive inotropic agents when hemodynamic instability occurs is crucial. Our study demonstrated that increased respiratory baseline modulation in PPG waveforms (PPG-DC%) is a more reliable predictor of fluid requirements compared to ABP-derived parameters. In addition, vascular compliance, assessed using frequency domain analysis of PPG and ABP (PPG-CF/ABP-CF), can predict the immediate postoperative need for vasoactive inotropic drugs. Current PPG waveform monitoring provides information such as arterial oxygen saturation and PVI. However, by incorporating spectrogram analysis through software or algorithms into existing monitoring systems, real-time changes in the PPG waveform according to respiration can be easily visualized, making it applicable in clinical settings. Further studies are needed to validate whether frequency domain variables of PPG and ABP could be considered as indices reflecting the response of stroke volume to the fluid challenge using echocardiography, and to establish applicable methods for timely resuscitation in clinical practice.
Notes
Funding
This study was partly supported by the Korea Health Technology R&D Project through the Korea Health Industry Development Institute, funded by the Ministry of Health & Welfare of the Republic of Korea (HR20C0026). The authors have reported that they have no relationships relevant to the contents of this paper to disclose.
Conflicts of Interest
Won-Jung Shin has been an editor for the Korean Journal of Anesthesiology since 2018. However, she was not involved in any process of review for this article, including peer reviewer selection, evaluation, or decision-making. There were no other potential conflicts of interest relevant to this article.
Data Availability
The datasets generated during and/or analyzed during the current study are available from the corresponding author on reasonable request.
Author Contributions
Hwa-Young Jang (Data curation; Writing – original draft)
In-Kyung Song (Data curation; Interpretation of data)
Sung-Hoon Kim (Data curation)
Won-Jung Shin (Conceptualization; Formal analysis; Writing – original draft; Writing – review & editing)
Supplementary Materials
Diagnosis of congenital heart disease according to the presence of pulmonary hypertension.
Patient characteristics and hemodynamic parameters based on the presence of pulmonary hypertension.
Comparison of hemodynamic parameters derived from frequency analysis in relation to fluid requirement and VIS, based on the presence of pulmonary hypertension.