With the advent of wearable devices capable of easily measuring patients’ respiratory rate, heart rate (HR), and heart rate variability (HRV), early signs of illness can potentially be identified. Patients’ respiratory and HR are typically elevated by illness, whereas HRV is generally decreased [1].
Smart watches and wristbands are important accessories for fitness, but their application in healthcare is still in its early stages. Tanwar et al. [2] hypothesized that a consistent decline in the values of major HRV components could be attributed to the onset or worsening of SARS-CoV-2 infections.
Hasty et al. [3] reported that substantial decreases in HRV preceded elevations in C-reactive protein (CRP) levels in the ensuing 72 hours with a 90.9% positive predictive value and a 0.187 error rate (sensitivity: 83.3% and specificity: 75%). The ability to detect an early increase in the inflammatory response might prove to be vital for mitigating the deleterious effects of Coronavirus disease 2019 (COVID-19) over time. These authors demonstrated the potential value of short-segment intermittent HRV analyses in this patient population. However, there are very few studies in the literature related to HRV in patients with COVID-19, even though HRV has been identified as a useful noninvasive method for monitoring the clinical evolution of COVID-19.
In a prospective observational pilot study, Aragón-Benedí et al. [4] hypothesized that a depletion of the sympathetic nervous system and a predominance of parasympathetic activity reflected a compensatory anti-inflammatory response in severely ill COVID-19 patients.
We report the case of a 52-year-old patient with moderate asthma, hypertension, and obesity and a surgical history of a total thyroidectomy many years prior for a benign colloid goiter, who developed COVID-19 with moderate symptoms without the need for hospitalization. He used a wearable device (Polar 7©, developed by Polar Electro on 2007, USA) connected to a mobile application (CardioMood©, developed by CardioMood SA, Switzerland) to monitor HRV during his illness.
Case Report
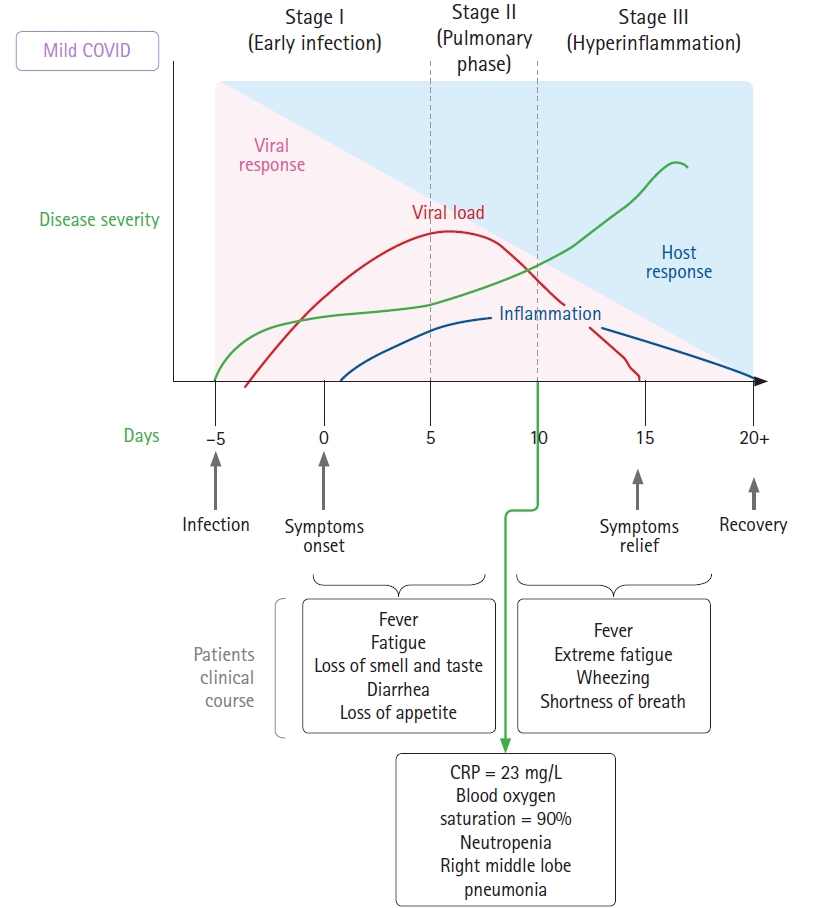
During the last few days of August 2020, the patient began experiencing symptoms and tested positive for COVID-19 using reverse transcription polymerase chain reaction. His symptoms started with fatigue, headache, body ache, and fever at approximately 38°C, followed by sore throat and congestion. He went to the hospital and was advised to maintain home isolation (Fig. 1). On the second day after the onset of symptoms, he lost his sense of smell and taste, had an immediate loss of appetite, and developed diarrhea. During the first week, all symptoms remained stable. By the morning of the sixth day, his fever had resolved. He had a fever relapse on day 7, along with extreme fatigue and diarrhea. By day 10, he developed wheezing and shortness of breath, which were evaluated in a hospital. Chest radiography showed an opacity in his right lung, his SaO2 was 90%, and his laboratory results were altered, showing neutropenia and high CRP levels. He resumed his scheduled asthma treatment, though he was non-compliant and experienced multiple exacerbations. On day 11, his feet felt cold, and he reported paresthesia. He had a persistent fever of approximately 38°C. On day 12, his fever resolved spontaneously, and hospital admission was therefore not necessary.
He began monitoring his HRV during the second week of his illness, with a chest band device for HR monitoring (Polar 7©, developed by Polar Electro on 2007, USA). He had a mobile application and was able to obtain inter-beat intervals between all successive heartbeats (RR intervals). This device has been used for monitoring athlete training and have recently been validated for use in healthcare [5].
We obtained raw data (RR intervals) from measurements obtained during the second week of the patient’s illness, when he had already been diagnosed with unilateral SARS-CoV-2 pneumonia, with a low-grade fever of approximately 38°C and an oxygen saturation of approximately 90%. Measurements were conducted at rest in the afternoon from days 8 to 12. Another measurement was performed a week later when home isolation was discontinued. The mobile application was used only for data collection. The Kubios© (Kubios Oy, Finland) standard software [6] (https://pubmed.ncbi.nlm.nih.gov/24054542/, cited by 458 articles by 2021) and ARTiiFACT© (developed by Tobias Kaufmann, Germany) software [7] (https://pubmed.ncbi.nlm.nih.gov/21573720/, cited by 74 articles by 2021), which have been cited by multiple previous reports, were used for HRV data analysis, and both yielded similar results. We also performed time-domain analysis using Python scripts to validate the results and to perform a visual exploratory analysis, plotting circles with the intent of showing the sympathetic nervous system (SNS) tone variations for each day. The working IPython notebook is available from https://colab.research.google.com/drive/1qcL2tdfrdlejoXjsKVWQW9IEr4Hxj0iR?usp=sharing.
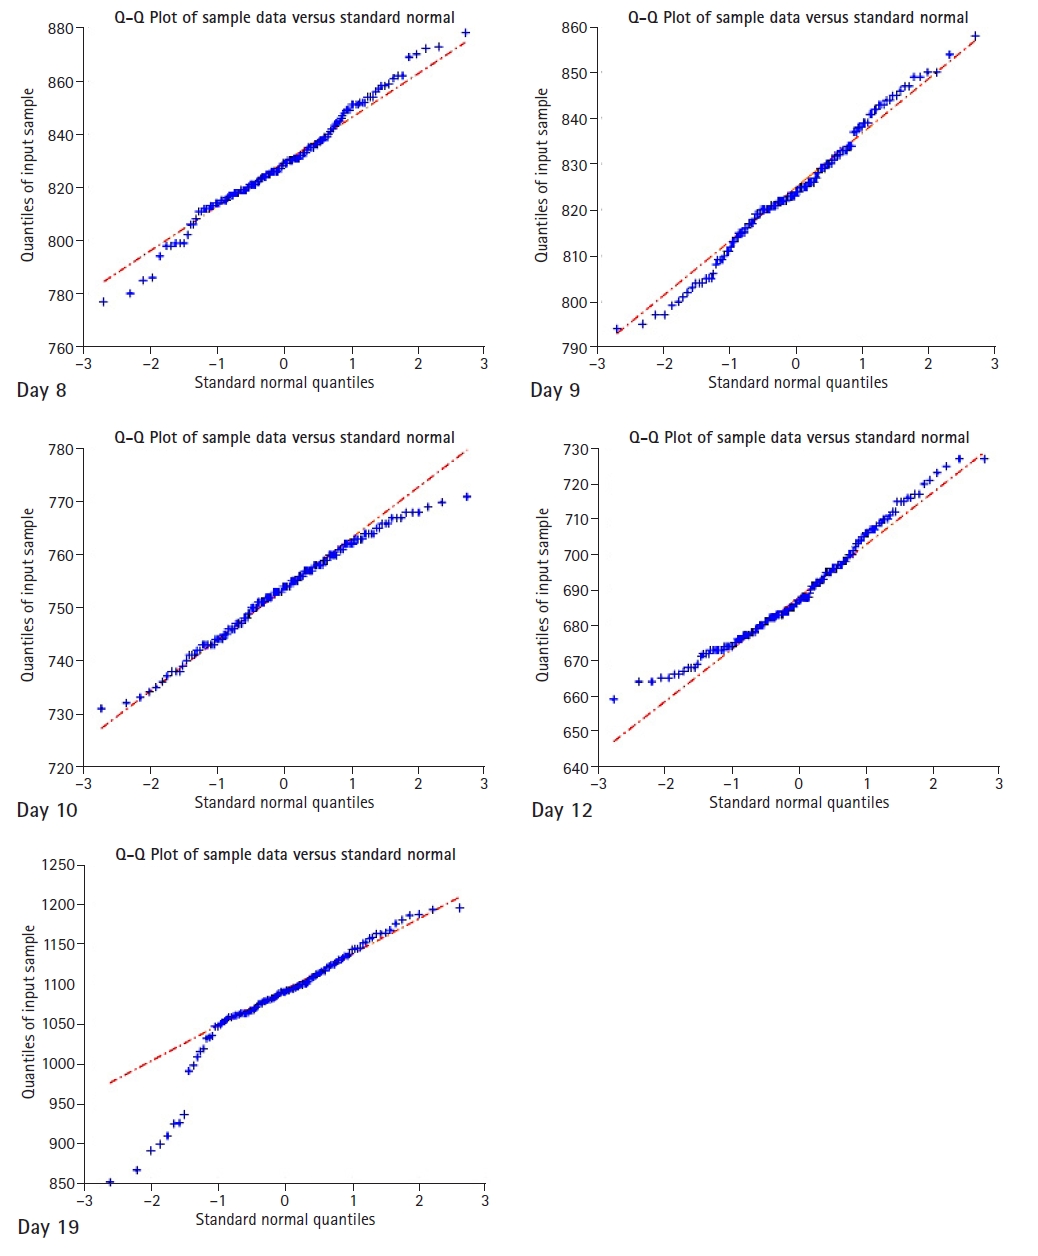
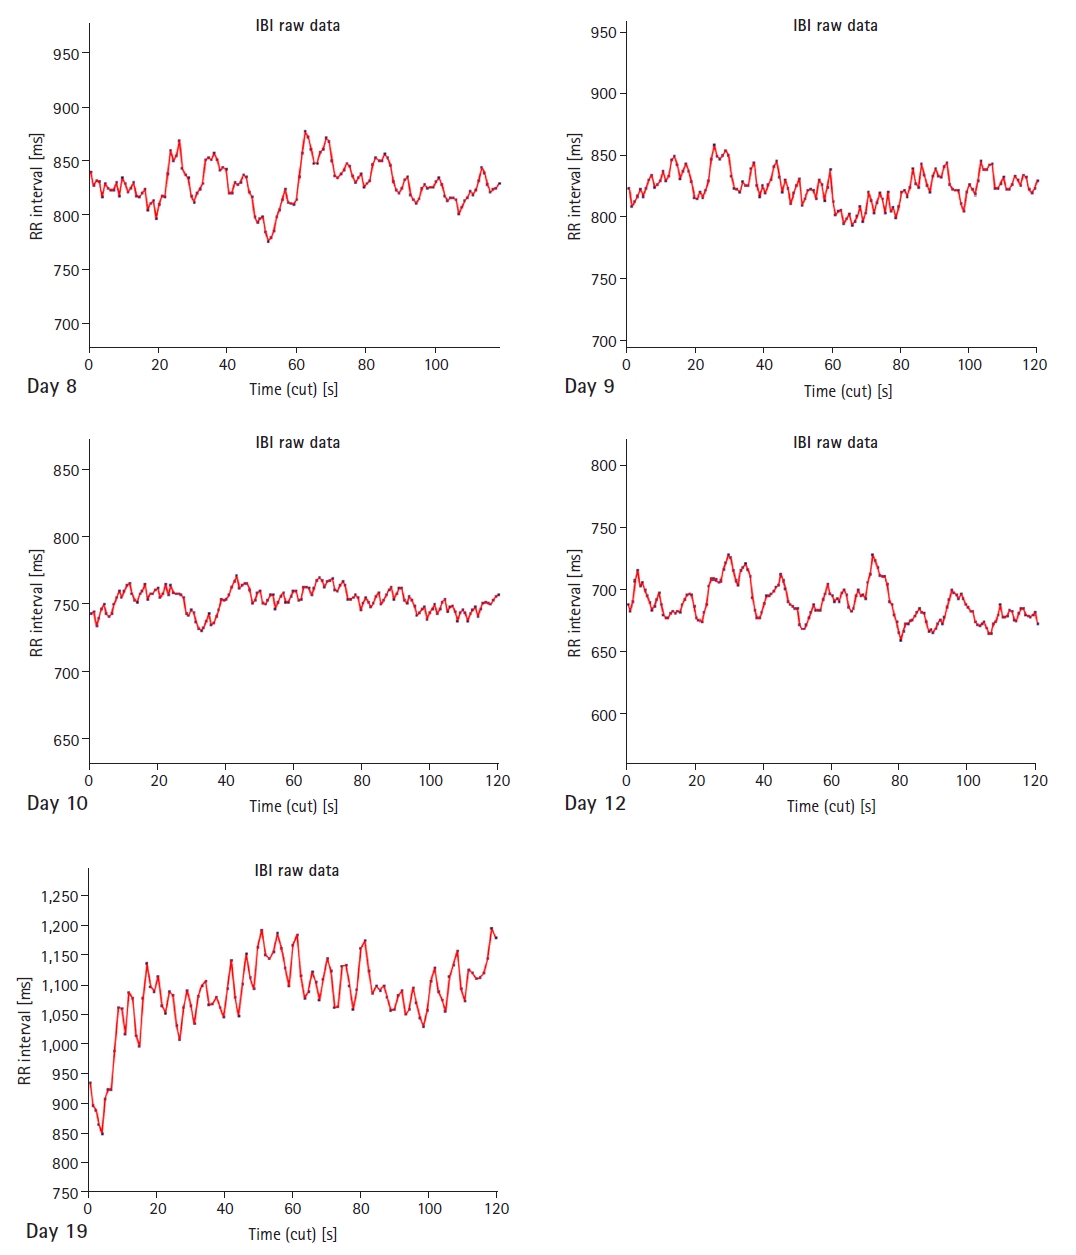
Normal distributions of data from each sample were tested and QQ plots (quantile-quantile: standard distribution quantiles vs. sample quantiles plot) were drawn using the ARTiiFACT© software (Fig. 2). All patient samples appeared to follow a normal Gaussian distribution, except for the sample from day 19, when it appears to be skewed to the left. This might have been caused by an artifact in the first few seconds of the sample (Fig. 3, day 19 sample).
The time series graphs of the RR intervals for each sample are shown in Fig 3. The differences between the ill and normal states are immediately evident. The RR intervals were higher when the patient recovered.
Discussion
HRV is defined as the variation in the elapsed time between consecutive heartbeats, measured in milliseconds. A person’s HRV is governed by two aspects of the autonomic nervous system: the sympathetic and parasympathetic branches [8].
The sympathetic branch regulates the body’s reactions to mental and physical stress by releasing suitable hormones, thereby causing an increase in heart contractions and reducing HRV. Its counterpart, the parasympathetic branch, regulates the body when it must recover from a stressful state. To do this, the parasympathetic branch slows down the HR and thus increases HRV. Studies have shown that HRV can be used to predict morbidity caused by mental disorders such as depression and posttraumatic stress disorder or physical afflictions such as diabetes, concussions, and asthma. [9] Therefore, HRV is a good indicator of underlying health issues and is an important factor that can be used to reduce the likelihood of mortality.
Kleiger et al. [10] published a milestone study in the late 1980s that established HRV as an independent predictor of mortality in patients with acute myocardial infarction. For a historical perspective of HRV, refer to the comprehensive review conducted by Nicolini et al. [11].
In 1996, a consensus statement was issued by the Task Force of the European Society of Cardiology and the North American Society of Pacing and Electrophysiology, specifying standards of measurement for time- and frequency-domain measures [12], providing a summary of the main HRV measures, and discussing methods of evaluation, duration of electrocardiogram (ECG) recording, and nomenclature. The duration of the recordings included in this case report was 2 min. There is evidence in the literature that 3 min recordings should be used for time- and frequency-domain methods, and 2 min recordings can be used for frequency-domain methods alone, although the task force recommended 5 min recordings. Recordings < 2 min are considered ultrashort.
The discussion of HRV measurements has been centered on a reductionistic model of sympathovagal balance between the parasympathetic nervous system (PNS) and the SNS. The application of nonlinear dynamics to HRV calculations produces nonlinear measurements that might best capture system complexity. It is widely accepted that the SNS tone has an arrhythmogenic and pro-ischemic effect, while the PNS is protective. The concept of autonomic modulation in a complex system is gaining support, although we will use a reductionist model centered on the autonomic tone and the heart to interpret our findings given the small number of measurements in this study. Time-domain calculations are used to quantify the variability between inter-beat intervals. Optimal HRV is associated with health, adaptability, and resilience. HRV declines with age and increases with increased aerobic fitness. Women show relative PNS dominance, while men show relative SNS dominance. Autonomic nervous system dysfunction is a common systemic indicator of poor health [13].
Table 1 summarizes all our time-domain calculations using the ARTiiFACT© software. The mean RR interval shows parasympathetic cardiac activation when its value is higher. When actively ill with COVID-19, our patient had lower discharge values. All samples taking during the patient’s COVID-19 illness had similar mean RR intervals.
Results were similar regarding the root mean square of successive differences between RR intervals (RMSSD). This measurement reflects the beat-to-beat variation in HR, which is less influenced by respiratory sinus arrhythmia (RSA) than other time-domain parameters supposed to index vagal tone, and is used to estimate PNS-mediated changes in HRV. Our patient had a lower RMSSD when ill than when he had recovered. Our patient also had a lower standard deviation (SD) of normal-to-normal (NN) intervals (SDNN), which is the “gold standard” for medical stratification of cardiac risk since it is more accurate when calculated over a 24 h period. SDNN values < 50 ms are unhealthy or high risk, those between 50 and 100 ms indicate moderate risk, and values > 100 ms are considered normal. For short-term recordings taken at rest, the primary source of these variations is parasympathetically mediated respiratory baroreflex activity.
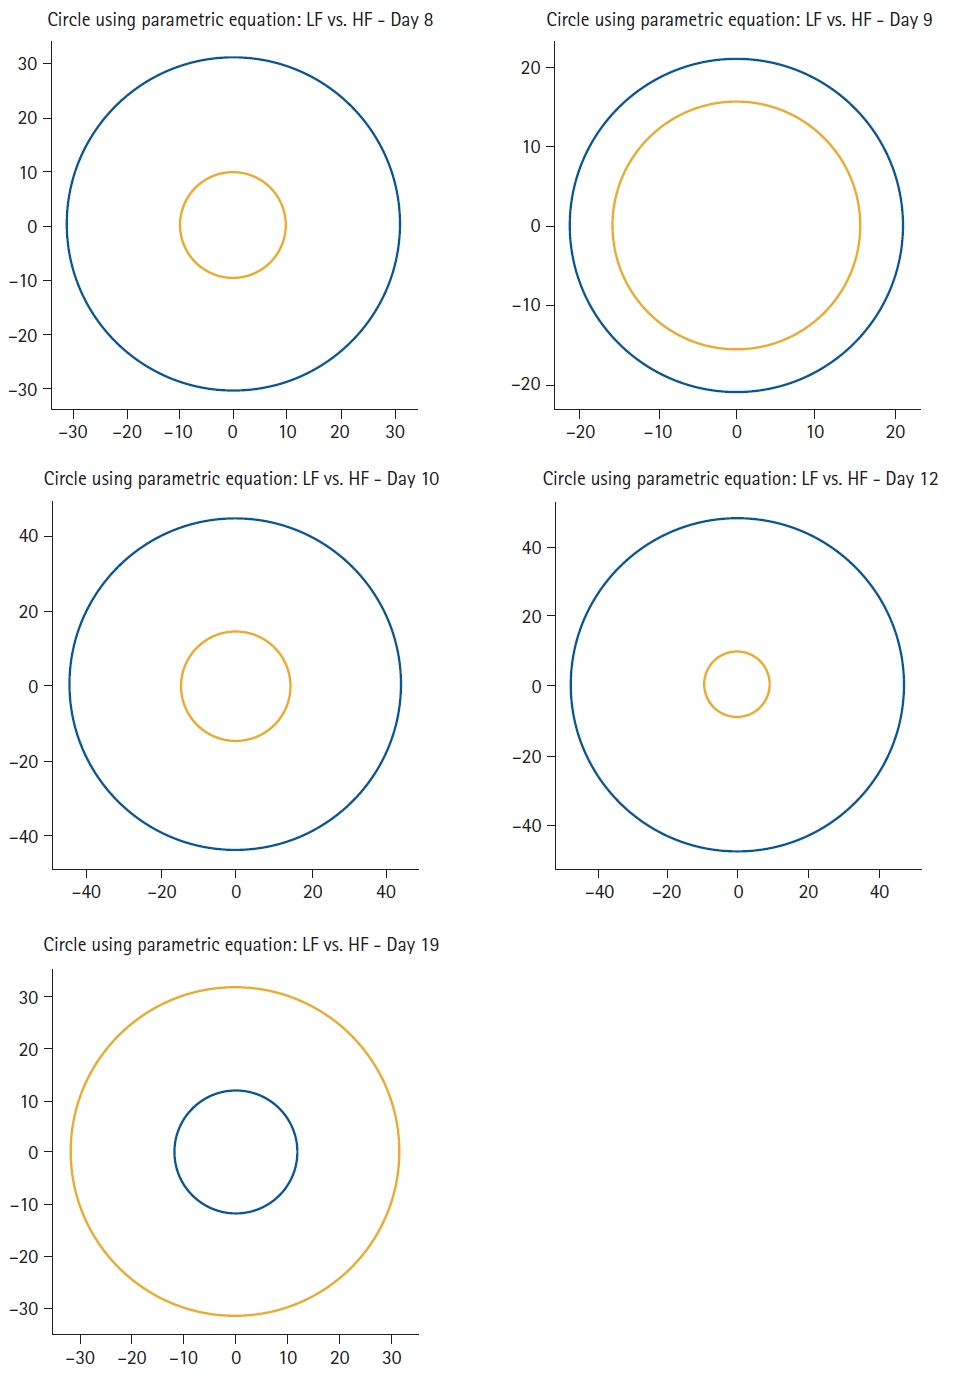
Frequency-domain measurements are used to estimate the distribution of the signal energy within four frequency bands, and are expressed as the relative or absolute power. The low-frequency band (LF: 0.04–0.15 Hz) is called the baroreceptor band because it reflects baroreceptor activity at resting conditions and is also influenced by low respiratory rates or deep breathing. The high-frequency band (HF: 0.15-0.40 Hz) is known as the respiratory band because it is influenced by RSA. It reflects PNS activity but cannot be considered a pure index of cardiac vagal control. It is highly correlated with time-domain measures, such as the RMSSD and the proportion of successive NN intervals > 50 ms (pNN50). Lower power of HF is correlated with stress, anxiety, or worry. The LF/HF ratio might be related to the SNS and PNS ratio, with a lower ratio reflecting PNS dominance and a higher ratio reflecting SNS dominance. Since this is a reductionist approach to the complex relationship between SNS and PNS, this assumption may be controversial. Our patient had higher LF values than HF values during his COVID-19 illness. The relationships between these two frequency-domain measurements are graphically summarized in Fig. 4. It is evident that the relationship was completely inverted when the patient had recovered.
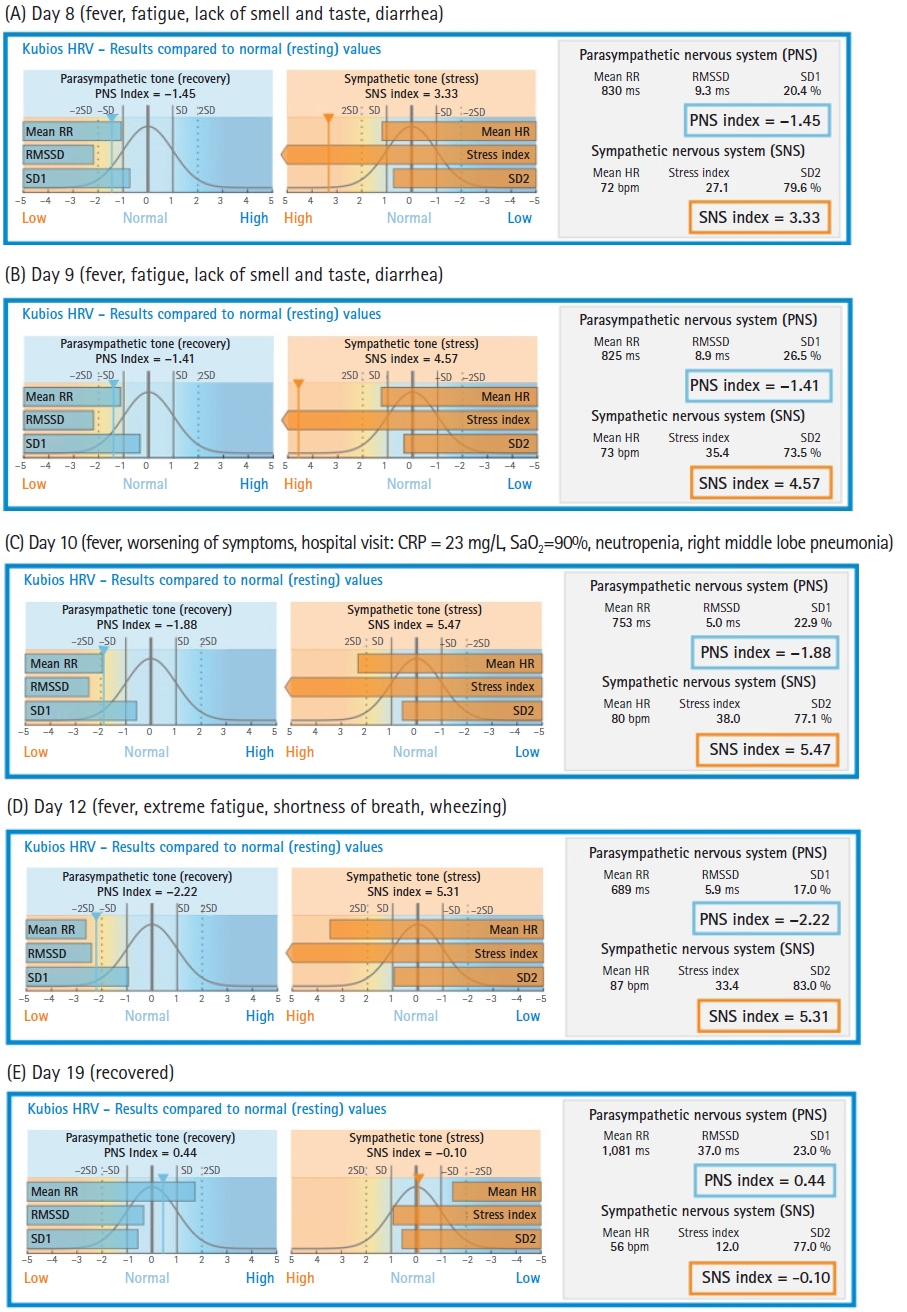
Time-domain norms have been reviewed in previous short-term HRV studies and 24-h measurements [14]. These norms are used by the Kubios© software (developed by Kubios Oy, founded in 2016 in Kuopio, Finland as a spin-off company from University of Eastern Finland) to report results (Fig. 5). Our patient had a low parasympathetic tone during his COVID-19 illness, which decreased every day until it reached almost 2 SDs lower than normal at the end of the second week. Conversely, his sympathetic tone was very high and reached at > 3 SDs up to > 5 SDs from normal values. These results suggest that an alteration in the modulation of the SNS and PNS occurred, which apparently augmented sympathetic tone and decreased parasympathetic tone. The clinical value of short-term measurements of HRV in COVID-19 patients is yet to be established. However, in an observational pilot study of patients with COVID-19 on mechanical ventilation, Aragón-Benedí et al. [4] found that the normalized high frequency component (HFnu) was higher in the non-survivor group and was correlated with higher IL-6 levels. A cut-off value of 80 predicted mortalities with a sensitivity of 100%, specificity of 85.7%, positive predictive value of 87.5%, and negative predictive value of 100% was found. The non-survivor group had values > 80. The receiver operating characteristic curve demonstrated that the HFnu could predict mortality with an area under the curve of 0.980. Our patient had surpassed the threshold of 80 on day 12, although he did ultimately recover.
The medical stratification of cardiac risk was performed using 24 h HRV recordings. The results from the recordings that were < 5 min in length should be interpreted with caution and should not be compared with long recordings. The patient’s values returned to normal one week after home isolation was discontinued (Fig. 5E).
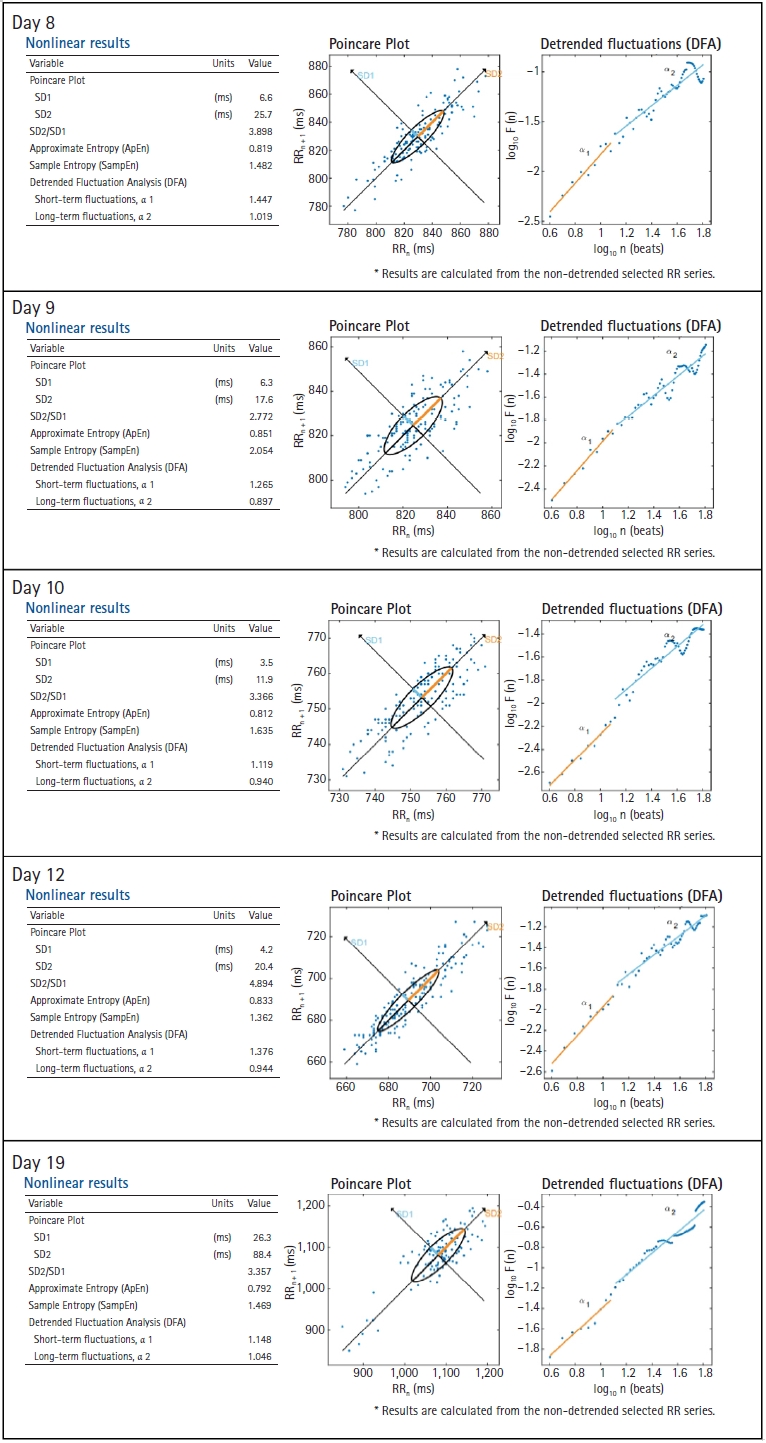
Nonlinear measurements index the unpredictability of a time series. The Poincaré plot is a scatter plot of the RR interval against the prior interval. The area of the ellipse is the total HRV and is correlated with the baroreflex sensitivity, LF and HF power bands, and RMSSD. Researchers use it to visually search for patterns hidden within a time series. The SD of the distance of each point from the y = x axis, perpendicular to the line of identity (SD 1), and the SD of each point from the y = x + average R–R interval, along the line of identity (SD 2) values were much lower during the patient’s illness than after recovery (Fig. 6). The SD 1/SD 2 ratio correlated with the LF/HF ratio.
Although we were able to obtain raw data from the CardioMood website (https://www.cardiomood.com/), we could only obtain the RR interval time series. Since we did not determine the sampling frequency rate, we were not able to replicate the same results using the RHRV package in R commander. The device we used was a photoplethysmography-based (PPG) biosensor, which is less accurate than ECG-based biosensors. Data were captured over a short period lasting 120 s, and the frequency-domain analyses may have been inaccurate for measurements < 300 s. According to Laborde et al. [15], a 5-min recording is recommended, when possible, as it enables comparisons between clinical studies. Short-term values are only appropriate when a patient is breathing at a normal rate (11–20 bpm); however, we could not obtain data regarding the respiratory rate of our patient [13].
The value of HRV as a predictor of COVID-19 mortality is yet to be established. If HRV is considered a marker of autonomic nervous system modulation, the influence of erratic rhythm should be considered because it affects short-term time- and frequency-domain measures. Nonlinear measurements of HRV can detect a decrease in autonomic nervous system modulation and loss of complexity, which might imply a worse prognosis. Population norms should be further studied for patients with COVID-19 using short-term and 24 h HRV measurements. ECG-based wearable devices have been shown to be more accurate for HRV calculations than PPG-based devices, and some have been validated for clinical use [5]; therefore, we recommend their use in patients with COVID-19. These devices are widely available at a low cost and can be used to monitor the clinical evolution of patients with COVID-19 who are isolated at home. In desperate circumstances, where there is an insufficient number of hospital beds, this method might be useful for anticipating worsening symptoms and for admitting only those patients at risk of developing severe COVID-19 to the hospital. We strongly recommend further explorations of HRV in the COVID-19 population.