Introduction
It is a crucial process to calculate the sample size before beginning a clinical study is a very important process to demonstrate its validity, accuracy, and reliability. However, not all studies require the calculation of a sample size. It is essential to determine whether or not the study is a pilot and exploratory study along with the purpose of testing the hypothesis of interest. Since most animal experiments are pilot and exploratory studies, it may be more appropriate to consider other things that can be tested while maintaining scientific and qualitative levels than estimating sample size. This is because new hypotheses may be established based on the results of the pilot and exploratory studies. Additionally, even if a hypothesis exists in this study, it may be newly redefined.
In some cases, an animal study for a pre-defined hypothesis testing may not be able to perform the experiment with an estimated sample size. For example, if the subject of the experiment is a monkey, it can be difficult to conduct the research with just one monkey due to reasons such as cost or experimental environment. Liu et al. [1], stated that it is difficult to obtain a larger number of animals as the use of nonhuman primates is strictly regulated.
The number of subjects that should be studied is critical to show clinically meaningful differences and statistical power. When estimating the sample size, however, a limited budget or research environment may require a trade-off between cost-effectiveness and power [2].
Ethical issues should be also considered while determining the sample size in animal studies. Russell and Burch [3] in the Principles of Humane Experimental Technique (1959) proposed that the 3Rs are similar to ethical considerations applied to any animal experiment by researchers and other institutes conducting these studies. The 3R principles are the harmonization of science and ethics in the field of animal experimentation, and includes replacing, refineration, and reduction.
The purpose of this paper is to guide researchers a method for estimating the appropriate sample size in animal studies. Furthermore, this paper helps to understand the calculation of the sample size depending on the stage (pilot, exploratory, and confirmatory study) and the comparison type of the study.
Pilot and exploratory experiments
Pilot studies are performed to check the feasibility of the measurement precision of the variables that are intended to be measured in the main study or pivotal study and to verify the logistic nature of the proposed experiment. The sample size of the pilot study is based on the researcher’s previous experience or guesswork because previous data are not available. Exploratory studies are also conducted to create new hypotheses. In other words, the purpose of these studies are to determine the trend or pattern of responses; therefore, it does not require a significance test. The sample sizes for these studies are sometimes calculated based on previous studies. The data obtained from these studies (standard deviation, the mean difference between the two samples, etc.) is used to calculate the sample size for a pivotal study [4].
Confirmatory study
A confirmatory study is a controlled study in which the study hypotheses are stated in advance and well-designed. The hypothesis of interest follows directly from the primary objective of the study, is always pre-defined, and is the hypothesis that is subsequently tested after completing the trial [5].
In these studies, it is very important to estimate with due precision the size of the effects attributable to the treatment of interest and to relate these effects to their clinical significance. In confirmatory study, sample size calculation plays an important role in providing evidence to support the claims. Therefore, estimating a valid sample size for the study is particularly important.
General considerations prior to sample size calculation
Several factors must be considered when calculating the sample size, such as the study’s purpose, study phase, type of comparison, primary variable and its characteristic, clinically meaningful difference, experimental design, statistical test, number of controls, randomization ratio, dropouts, covariates, and so on.
Type of comparison
It is important to clearly state the objective of the intended study because the objective influences the hypothesis of the study. For the study objective, there are four types of comparisons: test for equality, superiority, non-inferiority, and equivalence. The equality test is a two-sided test, while the others are one-sided test (test for equivalence is a two one-sided test). The test for equality is often used to demonstrate the intended objective in pilot and exploratory studies and pre-clinical studies, such as animal studies. In other words, since confirmatory studies are commonly performed after many pilot/exploratory studies, the equality test is often conducted in pilot/exploratory studies, such as animal studies.
To demonstrate the objectives, hypotheses are usually formulated based on the primary study objectives. If it is explained using statistical notations to facilitate understanding, it is expressed as follows (Table 1). H1 and H0 are the alternative and null hypotheses, respectively. Let μt and μc be the true mean of the test and control group and pt and pc be the true proportion of the test and control group, respectively. Additionally, let δ be the clinically significant difference in the equality test, the non-inferiority margin in the non-inferiority test, the superiority margin in the superiority test, and the equivalence margin in the equivalence test.
We assume that the difference (μt – μc) > 0 is considered an improvement of the test group as compared to the control group. A typical approach to compare the mean or proportion differences in a study with two independent samples (groups) is to test the following hypotheses shown in Table 1.
Primary variable
The outcomes from animal studies are distinguished from quantitative variables, whose values result from counting or measuring something, and qualitative variables as categorical variables. Sample size calculation is often performed based on statistical inference of the primary variable [2]. This paper deals with continuous and categorical variables, including dichotomous variables which define one of the outcomes as a “success” and the other a “failure.”
Errors
The significance level (α) and statistical power (1 – β) must be considered when calculating a sample size. The significance level is the maximum allowable value of the type I error. The type I error indicates the probability of rejecting the null hypothesis when it is true. Statistical power is the probability of rejecting H0 when it is false. If the type II error is set to β, then the statistical power is set to 1 – β. The power analysis is a method of sample size calculation that can be used to estimate the sample size required for a study, given the significance level and statistical power.
Table 2 displays the four situations that can be considered for decision-making on unknown facts when testing the hypotheses.
Sample size calculation
Calculation of the sample size before beginning the study is desired to test the intended research objective. Too small sample size can cause lower the sensitivity of the experiment to identify significant differences, whereas too large sample size can waste time, cost, and resources or important investigational endpoint [6]. In the latter case, a trade-off may often occur between the cost-effectiveness and detecting power [2]. As such, it is difficult to determine the sample size for studies, especially in confirmatory studies.
Several studies have introduced methods to easily calculate the sample size. Arifin and Zahiruddin [7] introduced a method to calculate the sample size in animal studies, which are pilot and exploratory in nature, through a simple formula using an ANOVA design. The sample size in animal studies can be calculated for various situations. The statistical approaches also vary including precision analysis, power analysis and so on.
Precision analysis
Precision analysis is one of the methods for calculating the sample size. This approach chooses the sample size in such a way that there is a desired precision at a fixed confidence level, that is, a fixed type I error. It is simple and easy to calculate but may have a small probability of detecting a true difference.
The precision of the interval, 100(1 – α)% confidence interval, depends on its width. Because a narrower interval has a more precise interval, this method considers the maximum half-width of the 100(1 – α)% [2].
When σ2 is known, the formula of sample size required from a 100(1 – α)% confidence interval for μ can be chosen as
where,
Power analysis
The power analysis method is usually used to estimate the sample size in a clinical research. It selects the required sample size to achieve the desired power for detecting a scientifically or clinically meaningful difference at a fixed type I error [2].
The simple illustration in Table 3 has several assumptions: (1) two sample parallel design, (2) σ2 is the known population variance, (3) the population variances of test and control group are equal to σ2, (4) μt – μc is the true mean difference between a test group (μt) and a control group (μc), (5) μt – μt > 0 is considered an indication of improvement of the test group as compared to the control group, (6) δ is the clinically significant difference in the equality test, the non-inferiority margin in the non-inferiority test, the superiority margin in the superiority test, and the equivalence margin in the equivalence test, (7) k is a constant for the allocation rate, (8) nt is the sample size of the test group, and nc is the sample size of the control group, and (9) z α 2 z β 2 α 2 t h β 2 t h
Other formulae of sample size calculation
Sample size for dichotomous data
Fleiss [8] provided an equation to compare the proportions in the two groups. Let an outcome be an event of interest, such as the occurrence of a disease or death, and proposed the following hypothesis:
H0: pc – pt = 0 versus H1: pc – pt ≠ 0
Let
rc : the number of outcomes in the control group
rt : the number of outcomes in the test group
Nc : the total number of animals in the control group
Nt : the total number of animals in the test group
The sample size per group(n) needed to achieve power 1 – β can be obtained by following equation:
where,
d = | pc – pt |
C : a constant that depends on the values chosen for α and β, and is for two-sided test
Table 4 can be used to obtain the solution for the above formula and shows sample sizes per arm based on given C values, significance levels, and power, assuming s is 4 and d is 3.
Sample size for comparing two group means
Snedecor and Cochran [9] suggested a method for estimating sample size by comparing the mean differences between two group. To show the mean difference between two groups in parallel design, the following hypotheses are considered:
H0: μc – μt = 0 versus H1: μc – μt ≠ 0
Where,
μc : population mean of the control group
μt : population mean of the test group
Then, the sample size needed to achieve a power of 1 – β can be obtained from the following formula:
where,
s : standard deviation
d : the difference to be detected
C : a constant that depends on the values chosen for α and β, and is for a two-sided test
Table 5 can be used to obtain the sample size per arm for the above formula and shows sample sizes per arm based on given C values, significance levels, and power, assuming s is 4 and d is 3.
Sample size for paired studies
The equation suggested by Snedecor and Cochran [9] can be used when comparing values in paired studies. The following hypotheses are considered:
H0: μbefore – μafter = 0 versus H1: μbefore – μafter ≠ 0
The sample size needed to achieve power 1 – β can be obtained using the following equation:
where,
s : standard deviation
d : the difference to be detected
C : a constant that depends on the values chosen for α and β, and is for a two-sided test
Table 6 can be used to obtain the sample size per arm for the above formula and shows sample sizes per arm based on given C values, significance levels, and power, assuming s is 4 and d is 3.
Nonparametric
In many cases, parametric methods are used to estimate the sample size. However, the estimation of sample size can also be done in a nonparametric way if it is not possible to use large sample sizes, such as animal study. Estimating sample sizes by nonparametric methods is applicable when the sample size is small or when the assumption of normality is not guaranteed. In some animal studies, the assumption of normality may not be fulfilled during the estimation of sample size. Practically, the primary assumptions of the underlying population may not be satisfied. In such cases, nonparametric methods can be considered for testing the differences of location.
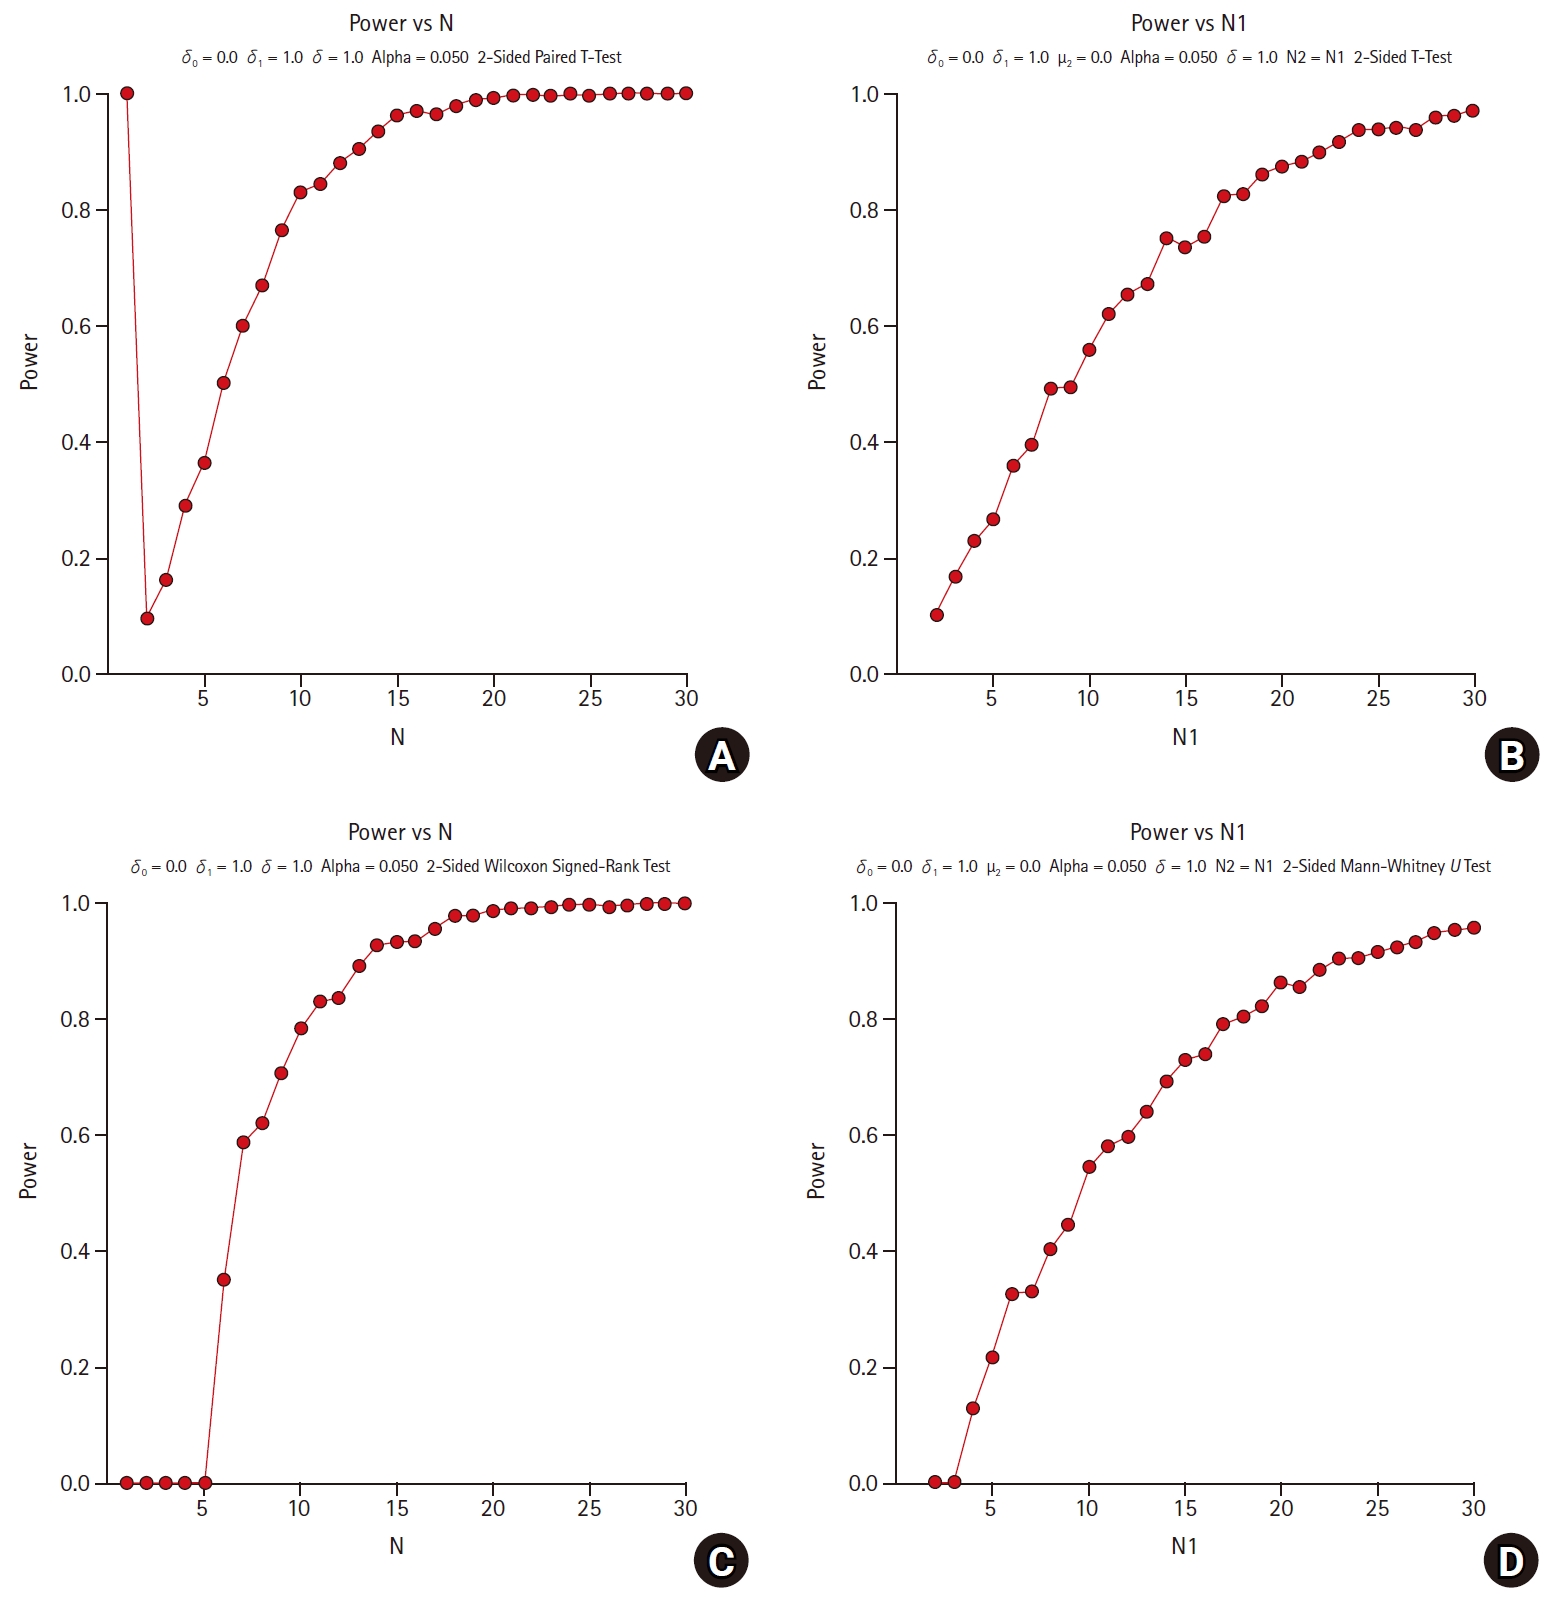
Fig. 1 shows the comparison of the statistical power calculated using the parametric and nonparametric methods through 1,000 simulations as increasing the sample size from 1 to 30 by 1. For (a) and (b), paired t-tests and independent two-sample t-tests are applied, respectively, which are parametric methods. For (c) and (d), Wilcoxon’s signed rank test and Wilcoxon’s rank sum test (Mann-Whitney’s U test) are applied, respectively, which are non-parametric methods. Non- parametric methods of (c) and (d) are corresponding to the parametric methods of (a) and (b), respectively. All alternative hypotheses are two-sided tests for equality with a significance level of 0.05, and the power is calculated by PASS 2020 [10].
Fig. 1 shows the consistency in the statistical power of the parametric and nonparametric methods as the sample size increases. When estimating the sample size using non-parametric methods, there are some practical issues in which the power under the alternative hypothesis has not been fully studied. However, these non-parametric approaches can be helpful in exploratory studies.
Software for calculating sample size
The sample size can be easily calculated using various formulae. However, it can be difficult to calculate directly using formulae and may be calculated using computer algorithms. In some cases, computer simulations can be used to determine an appropriate sample size. Some well-known software that researchers can use for clinical researches are:
(1) Power Analysis and Sample Size (PASS) software, sample size tools for over 965 statistical tests and confidence interval scenarios. (2) nQuery 7.0 Advisor program (Ireland), sample size, and power calculations. (3) G*Power 3 (Faul, Erdfelder, Lang, & Buchner), a flexible statistical power analysis program for the social, behavioral, and biomedical sciences. (4) SAS® version 9.4 (SAS institute Inc., USA) using POWER and GLMPOWER procedures. (5) R version 3.6.5 (R Foundation for Statistical Computing, Austria) using “pwr” package, which is free and open source. (6) Sample Power (SPSS Inc., USA) is a tool for estimating the sample size on the various statistical studies.
More detailed information for comparing software for sample size determination can be found in a paper written by Dattalo [11].
There are many commercial and free software available on the Internet besides those mentioned above. It is also important for the user to check the accuracy and validity of the sample size whether it is appropriately calculated according to the study objectives as well as whether the algorithm of formula provided is accurate.
Conclusion
When estimating the sample size, there are several assumptions and conditions which are defined before beginning the study. Most animal studies are in the pilot and exploratory phase; therefore, it may be difficult to predefine the sample size for the study. Additionally, the ethical issues in animal studies and the sample size calculation in accordance with the 3R principle should be fully reviewed for any animal study. Nevertheless, at the planning stage, calculation of sample size plays a very important role in clarifying the intended objectives of the study. Sometimes, a problem of trade-off might happen when estimating the sample size. The careful appreciation of experimental design and statistics before data collection is the key of successful experiment when conducting an animal study.