Introduction
Postoperative pressure ulcers are important indicators of perioperative care quality, and are significant and expensive complications during critical care that can result in unexpected morbidity. A report from the Centers for Medicare and Medicaid Services revealed that Medicare pays approximately $146 million per year to cover treatment for six hospital-acquired conditions, including severe pressure ulcers, and that pressure ulcers had the second highest cost per episode [1]. Therefore, the prevention of pressure ulcers can help reduce healthcare costs and improve patient outcomes.
Anesthesiologists may not consider the risk of postoperative pressure ulcers, as only patient positioning has been considered the primary responsibility of anesthesiologists [2]. However, postoperative pressure ulcer development is associated with many other variables, such as the length of surgery, and anesthesiologists' limited inability to control these variables may have prevented them from playing a more active role in pressure ulcer prevention. Furthermore, there is no ideal method for identifying patients who are at risk of developing postoperative pressure ulcers. The Braden scale has been used for surgical patients, although it has low sensitivity and modest specificity for predicting pressure ulcers [3].
O'Brien et al. [4] have recently investigated intraoperative risk factors for postoperative pressure ulcers, and found that only the intraoperative use of blood products was independently associated with pressure ulcer development. No significant associations were observed for operation length, hypotension, or vasopressor use. These findings highlight the possibility that pressure ulcer development is not related to distinct intraoperative factors, although that study did not consider the association of the patients' pre-existing conditions (e.g., nutritional status) with pressure ulcer occurrence. In addition, there is a validated scoring system that is commonly used in the critical care setting to identify patients with a high risk of developing pressure ulcers [5], although the score may not be updated to reflect the patient's altered mobility after surgery [6]. Therefore, the present study aimed to identify perioperative factors that could identify patients who were at risk of developing postoperative pressure ulcers and to develop a model for predicting pressure ulcer development after surgery.
Materials and Methods
This retrospective case-control study evaluated data from 129 patients who underwent major surgery between January 2012 and December 2013 at the Severance Hospital of the Yonsei University Health System (Seoul, Korea). Institutional Review Board approval was obtained (4-2014-0323) and this study was registered at www.ClinicalTrials.gov (NCT02279355). The exclusion criteria were pediatric cases and cases with preoperative pressure ulcers. The patients' baseline data included demographic characteristics, physiological parameters, comorbidities, functional status, and nutritional status. Each case was paired with two controls that were matched for age (± 5 years), sex, surgery, and comorbidities within the same period.
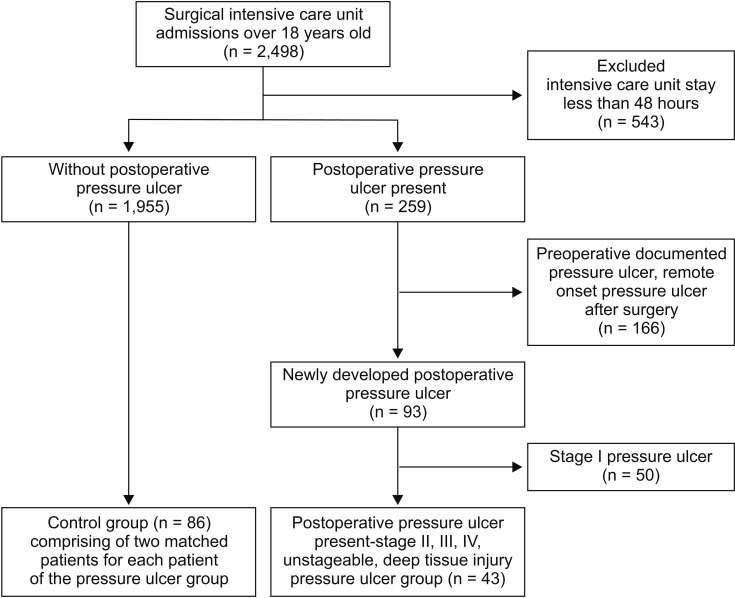
The potentially eligible population included 2,498 patients who were discharged from the surgical intensive care unit (ICU) after surgery. New-onset postoperative pressure ulcers (within one month after surgery) were identified based on nursing notes in the patients' electronic medical records. Based on the pressure ulcer staging guidelines of the National Pressure Ulcer Advisory Panel [7], 43 patients were found to have developed pressure ulcers of stage 2 or higher (stage 2: 28 patients, stage 3: 12 patients, deep tissue injury: 1 patient, unstageable ulcers: 2 patients). In this staging system, the degree of tissue damage increases at higher stages. Stage 1 involves intact skin with a localized area of non-blanchable erythema, which may appear different in darkly pigmented skin and is usually temporary and reversible. Because of their immobilization, patients commonly experience a stage 1 pressure ulcer at weight-bearing sites immediately after surgery. Therefore, the initial management of stage 1 pressure ulcers only involves a protective dressing with observation, and stage 1 pressure ulcers are not routinely treated by a wound care nurse. Stage 2 involves partial-thickness skin loss with exposed dermis in a red or irritated area, and can involve a blister or open sore. Stage 3 involves full-thickness skin loss with adipose tissue that is visible in the ulcer, and granulation tissue and epibole are often present. Stage 4 involves full-thickness skin and tissue loss with exposed or directly palpable fascia, muscle, tendon, ligament, cartilage, or bone. Unstageable pressure ulcers involve full-thickness skin and tissue loss that is obscured by slough or eschar, which prevents direct visualization of the extent of tissue damage. If the slough or eschar is removed, a stage 3 or 4 pressure injury will be revealed. Deep tissue pressure injury involves persistent non-blanchable deep red, maroon, or purple discoloration.
The preoperative data included comorbidities, age, sex, body mass index (BMI), corticosteroid use, diabetes, neurological disease, serum albumin levels, hemoglobin levels, creatinine levels, prothrombin time, hemoglobin levels, total bilirubin levels, and lactate levels. The intraoperative data included duration of anesthesia, intraoperative patient position, anesthesia type (general or regional anesthesia), hypotension (a 40% relative decrease in mean arterial pressure compared with baseline mean arterial pressure), vasopressor use, volume of blood loss, number of packed red blood cell (pRBC) units transfused, and intraoperative urine output. The postoperative data during the first week included the length of ICU stay, length of hospital stay, Acute Physiologic and Chronic Health Evaluation (APACHE II) score, Braden scale score, use of restraints, total parenteral nutrition, ventilator care, use of vasopressors, in-hospital mortality, and laboratory data, which included prothrombin time and levels of serum albumin, hemoglobin, creatinine, total bilirubin, and lactate. The Braden scale is a tool for predicting the risk of pressure ulcers, which was developed in 1987 by Braden and Bergstrom [8]. The Braden scale is based on six criteria: sensory perception, moisture, activity, mobility, dietary habits, and friction and shear. A nurse performed bedside assessments immediately after the patient arrived at the ICU. Patients who required postoperative ventilator care received sedatives and analgesics to maintain light sedation (Richmond agitation sedation scale: −2 to 0) which helped synchronize the patient's spontaneous breathing with the mechanical ventilation.
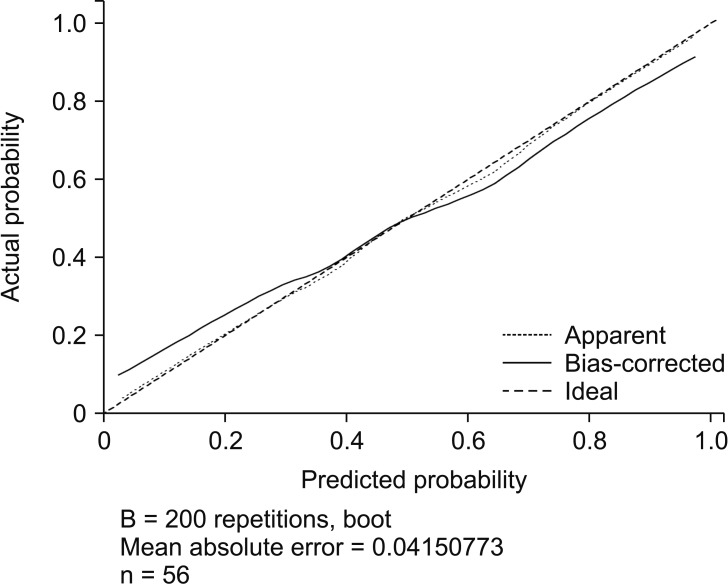
All statistical analyses were performed using R software (version 3.0.1; The R Foundation for Statistical Computing, Vienna, Austria). Results were considered statistically significant at a P value of < 0.05. Categorical variables were evaluated using two-tailed Fisher exact tests for 2 × 2 tables and the likelihood ratio chi-square test was used for larger tables. Continuous variables were inspected visually and tested for normality using the Kolmogorov-Smirnov test. Normally distributed data were evaluated using a two-sample test, and non-normally distributed data were evaluated using the Mann-Whitney U test. Survival rates were estimated using the Kaplan-Meier method. Risk factors that were significantly associated with postoperative pressure ulcer development were integrated into a logistic regression model. The predictive power of the model was evaluated using a receiver operating characteristic (ROC) curve and the area under the curve (AUC). The nomogram's discrimination and calibration were tested as previously reported [9], and the bootstrap method (200 repetitions) was used to obtain relatively unbiased estimates of the model's performance.
Discrimination (i.e., whether the relative rankings of individual predictors of postoperative pressure ulcers were in the correct order) was quantified using the AUC value and its 95% CI. We also performed graphic calibrations of the relationship between the observed outcome and expected probabilities. The clinical significance of the calibration represents the accuracies of individual predictors of postoperative pressure ulcers.
Results
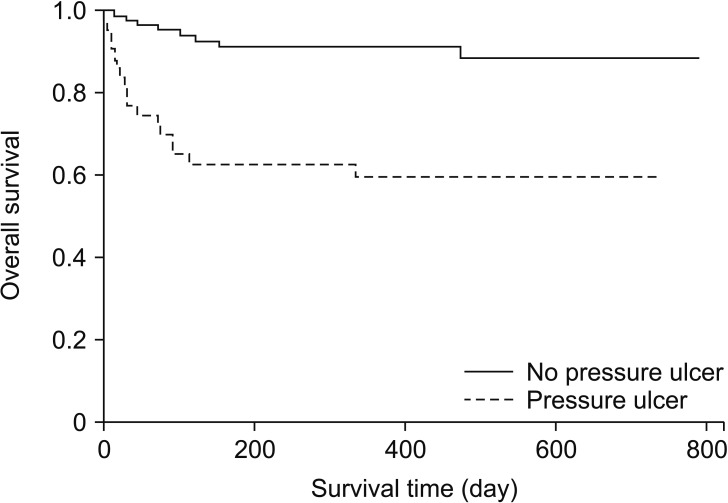
Among the 2,498 assessed patients, 43 patients developed postoperative stage 2 or higher pressure ulcers (Fig. 1). Each case and its two matched controls had identical values for the matched factors (Fig. 1). The patients' baseline characteristics are summarized in Table 1. The two groups had similar baseline values for diabetes, steroid use, BMI, and American Society of Anesthesiologists physical status classification score. Compared with the control group, the pressure ulcer group had lower baseline values for hemoglobin and albumin levels (P = 0.014) and higher baseline lactate levels (P = 0.001). Both groups had similar total anesthesia times (P = 0.575). The pressure ulcer group had a higher volume of blood loss and more transfused pRBC units, compared with the control group (P = 0.002). Among the postoperative variables, the pressure ulcer group had higher APACHE scores (P = 0.003), higher Braden scale scores at admission (P < 0.001), longer ICU stays (P < 0.001), and higher likelihoods of requiring mechanical ventilation (P < 0.001), physical restraint (P < 0.001), and mortality (P < 0.001). There were no intergroup differences in intraoperative positioning. The Kaplan-Meier survival estimates revealed that, compared with the control group, the pressure ulcer group had significantly higher mortality rates at 90 days (33.6% vs. 4.7%, P < 0.001) and one year (40.3% vs. 8.6%, P < 0.001) (Fig. 2).
Table 2 shows that stage 2 and higher pressure ulcers were primarily located on the coccyx (79.1%), heel (9.3%), and occiput (7.0%). The univariate analysis revealed that pressure ulcer development was significantly associated with preoperative hemoglobin levels, albumin levels, lactate levels, intraoperative blood loss and number of pRBC units, postoperative APACHE score, Braden scale score, postoperative ventilator care, and physical restraint (Table 3). After considering multicollinearity between multiple variables, intraoperative preoperative albumin, and lactate levels, the intraoperative number of pRBC units, postoperative ventilator care, and Braden scale score were entered into the multiple logistic regression model. Pressure ulcer development was independently predicted by lower preoperative albumin levels (odds ratio [OR]: 0.2, 95% CI: 0.05–0.82; P =0.025) and higher lactate levels (OR: 1.7, 95% CI: 1.07–2.71; P = 0.026). The number of pRBC units, postoperative Braden scale score, and postoperative ventilator care were not significantly associated with the risk of pressure ulcer development in the multivariate analysis (all P > 0.05).
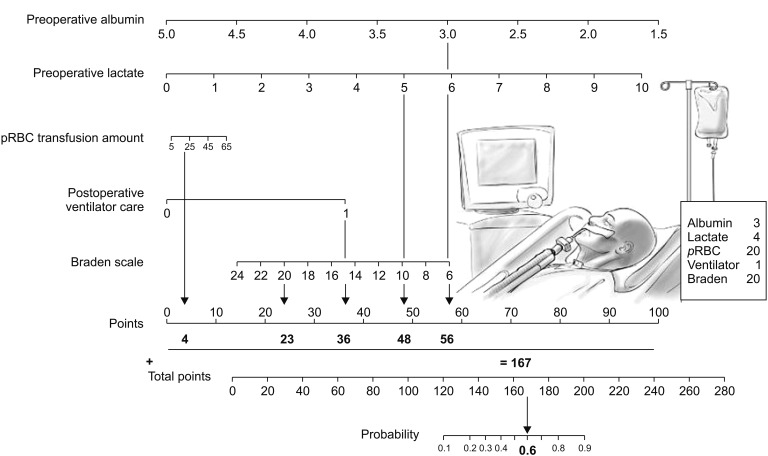
Based on these findings, we constructed a clinical model for predicting postoperative pressure ulcer development. The model also included the number of pRBC units, postoperative ventilator care, and Braden scale score, because they are known risk factors for pressure ulcer development. The model's predictive power was tested using an ROC curve, which had an AUC of 0.88 (95% CI: 0.79–0.97; P < 0.001). Fig. 3 shows the nomogram, and the validation set was used to compare the nomogram-predicted pressure ulcer rate to the observed rate. The nomogram accurately predicted postoperative pressure ulcer development (Fig. 4).
Discussion
The present study aimed to identify perioperative factors that predicted postoperative pressure ulcers among surgical patients, and revealed that preoperative low albumin levels and high lactate levels were independent risk factors. Previous studies have reported broad variability in the rate of pressure ulcer development in the surgical setting (2.8–12%) [10,11], and the present study revealed that 10.2% of patients had stage 2 or higher postoperative pressure ulcers. After we excluded patients with preoperative pressure ulcers, we found that the incidence of postoperative pressure ulcers was 3.7% (Fig. 1).
There is an increasing amount of literature regarding the risk factors for postoperative pressure ulcers [4,12,13]. For example, patients who undergo surgical procedures are immobile for prolonged periods, are unable to change positions, and have a higher risk of pressure ulcers, compared to mobile patients [14]. Furthermore, patients under general anesthesia cannot sense numbness or pain, and are unable to change position to relieve focal pressure. Although, patients are positioned intraoperatively to reduce pressure, pressure ulcers remain fairly common among patients who require postoperative critical care. One literature review has indicated that the proposed mechanism for pressure ulcer development is multi-factorial [15]. For example, mechanical loading may be sufficient to cause occlusion of capillaries, which results in ischemia and cell death [15]. In addition, intrinsic patient factors and extrinsic environmental factors have been implicated in pressure ulcer development. The known intrinsic factors include advanced age, comorbidities, poor nutritional status, abnormally low or high BMI, poor circulation, diabetes, and low hematocrit levels. The known extrinsic risk factors include type of anesthesia, duration of surgery, hypothermia, applied moisture, bed type, surgical position, type of surgery, and use of on-pump cardiac surgical procedures [4,10,11,16,17]. Thus, the present study used a matched casecontrol design to exclude unmodifiable extrinsic factors and minimize the effects of confounding factors, and we found that the cases and controls were accurately matched for age (± 5 years), sex, surgical procedure, and comorbidities.
The univariate analysis revealed that postoperative pressure ulcer development was significantly associated with preoperative hemoglobin levels, albumin levels, lactate levels, intraoperative blood loss, pRBC units, postoperative APACHE II score, Braden scale score, postoperative ventilator care, and patient restraint. However, in the multivariate analysis, only baseline lactate and albumin levels were significantly associated with the development of pressure ulcers. In previous studies, van Stijn et al. [18] found that preoperative albumin levels were associated with postoperative outcomes among elderly patients, and Mistrik et al. [19] found that skin blood flow (measured using a laser Doppler line scanner) was significantly associated with serum albumin levels among patients on chronic hemodialysis. Given that circulating albumin levels are assumed to reflect the rate of synthesis, plasma albumin levels are also widely used as an indicator of nutritional status [20,21]. Protein-energy malnutrition is also recognized as a major risk factor for pressure ulcers [22], and the National Pressure Ulcer Advisory Panel and Japanese Society for Parenteral and Enteral Nutrition recommend supplementary high-protein mixed oral nutrition and tube feeding for individuals with a high risk of developing pressure ulcers [7,23]. Based on these results, preoperative low albumin levels might indicate poor nutritional status, which might explain its significant positive association with the development of pressure ulcers.
One unanticipated finding of our study was the association of high lactate levels with the development of pressure ulcers (P = 0.001). Lactate is produced as an end-product of anaerobic metabolism, and normal physiological metabolism does not favor lactate formation, as this pathway only accounts for 10% of total pyruvate metabolism [24]. Previous studies have confirmed that tissue hypoxia, which is characterized as supply-dependent oxygen consumption, can cause elevated levels of lactate [25,26], which are nearly always pathological in cases with prolonged elevation [27,28]. The association between baseline lactate levels and postoperative pressure ulcers is interesting because previous studies have not considered this biomarker, although elevated lactate levels are known to be associated with tissue hypoperfusion and increased rates of morbidity and mortality [27,28,29]. Thus, lactate may be a useful biomarker for predicting pressure ulcer development.
Hospital and ICU stays were also associated with pressure ulcer development in the present study, and could be both causes and effects of pressure ulcer development. This is because the risk of developing a pressure ulcer theoretically increases during prolonged hospitalization. However, the association may also reflect the patient's poor general condition and subsequent need for a prolonged recovery period (Table 1).
During the immediate postoperative period, grade 1 pressure ulcers are frequently reported at pressure sites based on the patient's intraoperative position. However, the present study only included pressure ulcers of grade 2 or higher, and most of the pressure ulcer sites were on bony prominent areas that contact the table while the patients are in the supine position. Seven patients who developed pressure ulcers underwent surgery in the lateral position, although no pressure ulcers occurred on the pressure bearing areas for this position. Similar results have been observed in an earlier study, as Lumbley et al. [30] reported that the most common pressure ulcer locations were the sacral/coccygeal and buttock regions, which were not correlated with the surgical posture. Although studies have evaluated the pressure interface that is associated with each posture, no studies have evaluated the risk of pressure ulcers based on the patient's surgical position.
Based on our newly identified risk factors and the known risk factors (pRBC units, postoperative ventilator use, and Braden scale score), we developed a simple nomogram to predict postoperative pressure ulcers among surgical patients. The model was able to identify patients who developed pressure ulcers, and provided an AUC of 0.88 (95% CI: 0.79–0.97; P < 0.001). These results indicate that a patient's risk of pressure ulcer development can be accurately predicted by combining their preoperative and intraoperative data. As our nomogram could identify patients who were at risk for pressure ulcer development, it may be useful for guiding more appropriate positioning and the use of a pressure-reducing surface for these patients.
The most important limitation of this study is its casecontrol design, which is associated with known risks of recall bias and exposure misclassification. In addition, we focused on modifiable factors that were associated with the risk of pressure ulcers, although numerous unmodifiable factors have already been identified (e.g., the surgical procedure). Furthermore, the limited sample size is also associated with known risks of bias. Moreover, our study requires external validation to confirm the accuracy and reproducibility of our findings. Therefore, future research is needed to test our model, and to investigate the role of preoperative nutritional support in preventing pressure ulcer development.
In conclusion, we evaluated perioperative factors that may predict pressure ulcer development after surgery, and found that preoperative low albumin levels and high lactate levels were independent risk factors. Using these newly identified risk factors, as well as previously established risk factors, we developed a simple clinical nomogram for predicting postoperative pressure ulcer development among surgical patients. This nomogram may allow clinicians to plan the patient's postoperative ICU care and develop strategies to prevent pressure ulcer development, which may reduce the associated rates of morbidity and mortality.