Introduction
Target-controlled infusion (TCI) systems were developed to administer intravenous agents during anesthesia. This is a logical approach for the fine titration of intravenous hypnotics and opioids and is based on the pharmacokinetic model that describes the disposition of the drug. For targeting effect-site concentrations, the TCI system should incorporate pharmacokinetic parameters, such as the distribution volume and clearance, and the blood-brain equilibration rate constant (ke0). Pharmacokinetic parameters can be determined by assessing the time course of the drug. On the other hand, ke0 can be estimated using pharmacokinetic/pharmacodynamic modeling of a single population (ke0_model) or by calculating model-independent time-to-peak effects (ke0_tpeak) [1,2]. Although integrated pharmacokinetic/pharmacodynamic modeling of a single population is the standard method for obtaining ke0, this is complicated by the need for blood samples and the frequent measurement of drug effects. As a result, the pharmacokinetic model for propofol that was reported by Marsh et al. [3], a popular model used in clinical situations, only estimates pharmacokinetic parameters without ke0.
The time of peak effect after bolus injection, tpeak, could be used to link separate pharmacokinetic and pharmacodynamic studies [2]. The tpeak method is based on the assumption that the time required to reach the maximal effect-site concentration is identical to the time required to produce the maximal drug effects. Minto et al. [2] reported that the tpeak method, which is an alternative approach that can be used to obtain ke0, can also be used to obtain better approximations of the postulated "true" time course of propofol effects in comparison with the naive method. The observed tpeak of propofol was 1.6 minutes in a previous study [1], which was then used to calculate ke0 using differential equations. The ke0 of long-chain triglyceride (LCT) propofol, which was calculated as 1.2152/min using the tpeak method, is included the Orchestra workstation (Fresenius Kabi AG, Germany) and was previously modified by Marsh et al. [4].
Microemulsion propofol (Aquafol; Daewon Pharmaceutical Co., Ltd, Seoul, Korea) was originally developed to overcome the drawbacks of LCT propofol [5]. Sequential pharmacokinetic/pharmacodynamic modeling of microemulsion propofol was performed in healthy volunteers [6]. The comparison of appropriateness between ke0s derived from different methods in target effect-site concentration controlled infusion of propofol has yet to be fully elucidated. The aim of this study is to compare predictive performance in bispectral index (BIS, Aspect Medical Systems, Newton, MA, USA) prediction during target effect-site controlled infusion of propofol using different ke0s in the same pharmacokinetic model.
Materials and Methods
Part 1: Patient population and study procedure used to determine the ke0 value of microemulsion propofol using the tpeak method
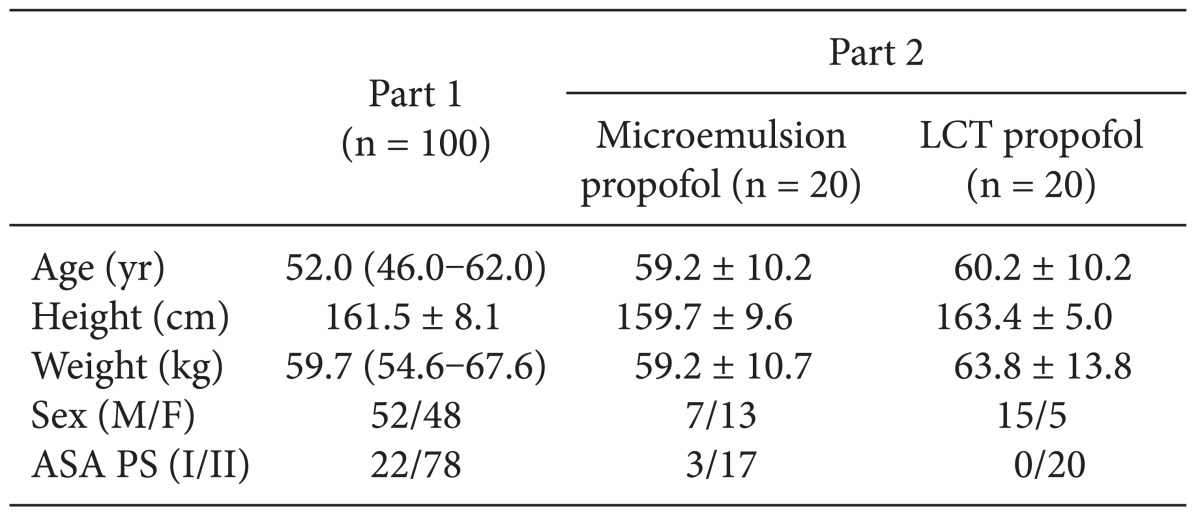
After obtaining approval from the Institutional Review Board of our institution and signed informed consent from all patients, a total of 100 patients diagnosed as American Society of Anesthesiologist (ASA) physical status (PS) 1 or 2 who were scheduled for stomach or colorectal surgery under general anesthesia were enrolled in this study. Patients with known or suspected cardiac, liver, or renal disease, significant obesity (> 120% of ideal weight), patients currently receiving sedative or analgesic drugs, and patients with known adverse effects to propofol were excluded. The patient characteristics are shown in Table 1. All patients were required to fast starting the midnight before the operation without receiving premedication. Once in the operating room, patients were monitored using electrocardiography, pulse oximetry, end-tidal carbon dioxide partial pressure, noninvasive blood pressure monitoring (Datex-Ohmeda S/5; Planar Systems, Inc., Beaverton, USA), and BIS. Using RS232C cables, all data were continuously downloaded onto a personal computer until recovery from anaesthesia. An 18-gauge catheter was inserted into a large vein in the wrist. Forty milligrams of lidocaine were intravenously administered prior to propofol injection, then an intravenous bolus of 1 mg/kg microemulsion propofol was administered. After observing the maximal reduction in BIS from baseline, propofol and remifentanil were administered by effect-site target-controlled infusion (Asan Pump, version 2.1.3; Bionet Co., Ltd., Seoul, Korea).
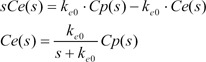
The differential equation describing effect-site concentration as a function of time t was presented as equation (1)

Equation 2 shows the Laplace transform of Equation (1).
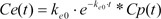
Equation 3 shows the inverse Laplace transform of the conversion of the time domain.
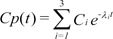
Equation 4 shows the unit disposition function of the plasma concentration determined in a 3-compartment mammillary model.
Starting with Equation 3, the convolution of the input and disposition functions is shown in Equation 5.

As a result of Equation 5, the effect-site concentration of the 3-compartment mammillary model can be summarized using Equation 6.

where Ci and ╬╗i are the coefficients and exponents of the pharmacokinetic model, respectively.
Because tpeak is the time at which effect-site concentration (Ce) reaches its maximal value, the derivative of Ce with respective to t should be 0 at t = tpeak.

Thus, Equation 6 can be used to mathematically determine ke0.
Part 2: Patient population and study procedure used to compare BIS predictions during TCI based on the 2 ke0 values determined in pharmacokinetic propofol models
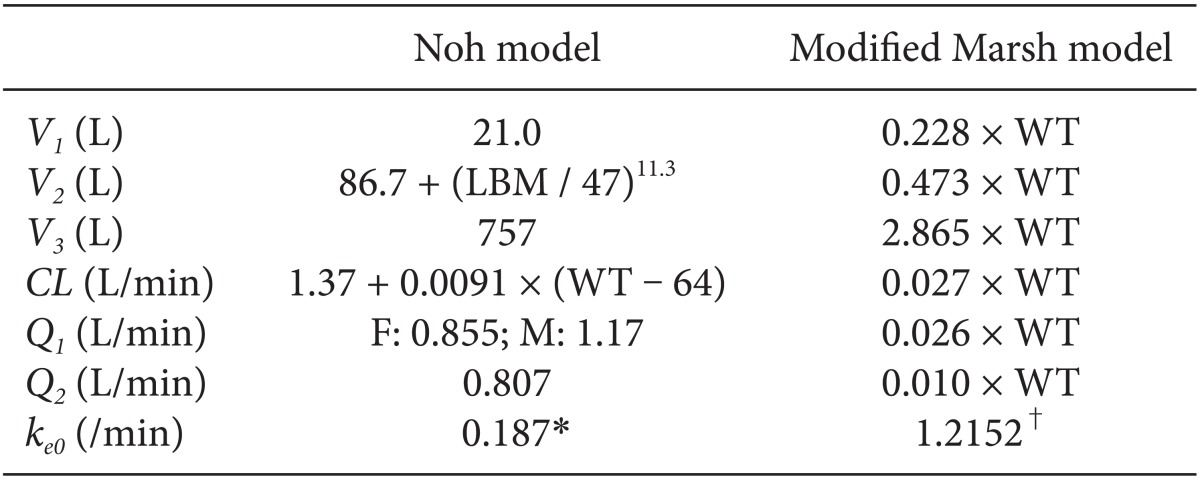
A total of 40 ASA PS 1/2 patients who were scheduled for stomach, breast, or colorectal surgery were randomly divided and assigned to receive microemulsion (n = 20) or LCT propofol (n = 20; Pofol, Jeil Pharmaceutical Co., Ltd, Seoul, Korea). The patient characteristics are shown in Table 1. All patients were required to fast starting the midnight before surgery without receiving any premedication. Once in the operating room, patients were monitored using electrocardiography, pulse oximetry, end-tidal carbon dioxide partial pressure, noninvasive blood pressure monitoring, and BIS. Using RS232C cables, these data were continuously downloaded onto a personal computer until recovery from anaesthesia. Each patient was preoxygenated with 100% oxygen via a facemask. Microemulsion propofol was administered via effect-site target-controlled infusion based on the Noh model, and a modified version of the Marsh model was used to administer LCT propofol to the other group of patients. The pharmacokinetic parameters and ke0 values of the Noh and modified Marsh models are shown in Table 2 [4,6]. Remifentanil were administered via effect-site target-controlled infusion based on the Minto model [7]. Propofol and remifentanil were infused using TCI software, and the infusion histories of the patients were automatically recorded onto comma separated values (.csv) files. The pharmacokinetic parameters and ke0 values shown in Table 2 were programmed into the Asan pump. Tracheal intubation was facilitated by administering 0.12 mg/kg vecuronium. Patients were then ventilated with a mixture of oxygen and air (delivered at a 1 : 2 ratio), and the ventilation rate was adjusted to maintain the end-tidal carbon dioxide partial pressure between 35-45 mmHg. The target site-effective concentration of propofol was adjusted to maintain BIS values < 60. Target site-effective concentrations of remifentanil were titrated to maintain stable hemodynamics (i.e., systolic blood pressure [SBP] > 80 mmHg and heart rate [HR] > 45 beats/min). If necessary, ephedrine or atropine was administered to maintain SBP > 80 mmHg and HR > 45 beats/min during anesthesia. Neuromuscular blockade was reversed by administering neostigmine and glycopyrrolate at the end of surgery.
Part 3: Simulation based on the infusion propofol history described in Part 2
The infusion history of propofol determined in Part 2 was used to simulate the effect-site concentration of propofol using different ke0 values in same pharmacokinetic model. In part 2, patients received microemulsion propofol using TCI with ke0 obtained by ke0_estimation method. On the other hand, patients received LCT propofol using TCI with ke0 obtained by ke0_tpeak method. For simulation, ke0s of microemulsion and LCT propofol was changed to different ke0s obtained by ke0_tpeak method for microemulsion propofol and ke0_estimation method for LCT propofol. ke0_estiation value for LCT propofol was obtained from the result of Billard et al. [8]. After each csv files was loaded in Asan Pump, ke0s of propofol were changed to 0.26/min for LCT propofol and result of part 1 for microemulsion propofol [8], and simulations of individual patients were performed by Asan Pump. Model summary for TCI and simulation of microemulsion and LCT propofol is shown in Table 3.
Predictive performance
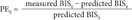
In accordance with a previous method [9], the predictive performance of the TCI system was determined using the pharmacokinetic parameters and the ke0 values for each type of propofol were characterized based on 2 parameters: bias and inaccuracy. BIS values (measured from the induction of propofol infusion to intubation) and recovery periods (measured from the discontinuation of propofol infusion to extubation) were used to analyze the results of the present study. For each BIS value, the performance error (PE) of the ith patient was calculated as follows:

where predictedij represents the predicted BIS value at the jth sampling point of the ith patient and measuredij is the observed BIS value.
The sampling interval (tj-tj-1) for BIS measurement was 10 seconds. The predicted value of BIS for each sample was calculated using the inhibitory sigmoid Emax model:
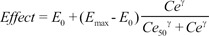
where Effect is the BIS value, E0 is the baseline BIS value when no drug is present, Emax is the maximal possible drug effect on BIS, Ce is the predicted site-effective concentration of propofol determined in Part 3, Ce50 is the site-effective concentration associated with 50% of the maximal drug effect on BIS, and ╬│ is the steepness of the site-effective concentration vs the BIS relationship.
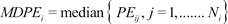
Various pharmacodynamic parameters for microemulsion and LCT propofol, such as E0, Emax, Ce50, and ╬│, were determined in our previous studies [5,6]. The first performance measure, the bias (i.e., the direction and size of deviation from the target) of the ith individual, was calculated as the median performance error (MDPEi) as follows:
The inaccuracy of BIS prediction (i.e., the size of the typical miss) of the ith individual was calculated as the median absolute performance error (MDAPEi) as follows:
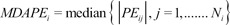
where Ni is the number of blood sampling points for the ith individual.
The pooled-data approach was used to obtain population estimates for bias and inaccuracy (fit4NM 3.5.1, Eun-Kyung Lee and Gyu-Jeong Noh, http://www.fit4nm.org/download, last accessed: Oct 17, 2011).
Statistical analysis
All statistical analyses were conducted using R software (version 2.13.1; R Foundation for Statistical Computing, Vienna, Austria) or SigmaStat 3.5 for Windows (Systat Software, Inc., Chicago, IL). Data are expressed as the mean ┬▒ standard deviation (SD) for normally distributed continuous variables, the median (range: 25-75%) for nonnormally distributed continuous variables, and as counts and percentages for categorical variables. The relationship between age, time-to-peak effects, and BIS was analyzed using linear regression. All P values < 0.05 were considered statistically significant.
Results
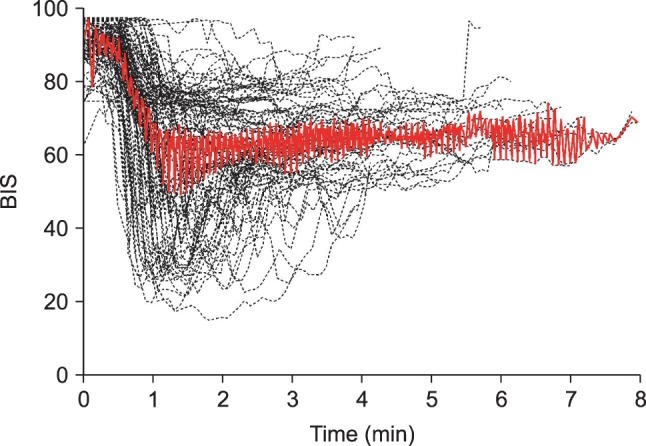
All patients enrolled in the study of obtaining ke0 of microemulsion propofol calculated by tpeak method were included in order to analyze the time to peak effect. Time course of BIS values after an intravenous bolus injection of microemulsion propofol 1 mg/kg are shown in Fig. 1. Median (25-75%) value of the time to maximally reduced BIS from baseline value was 1.68 (1.24-2.45) min. Also, relationship between age and time to peak effect in BIS are presented in Fig. 2, where, with increasing age, time to peak effect (tpeak) increased.
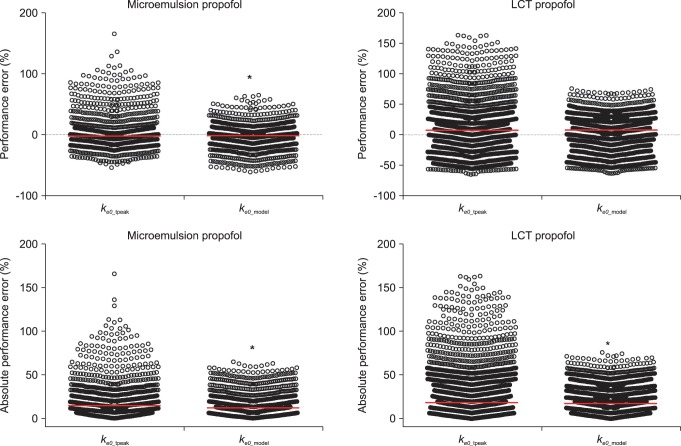
A total of 1,027 BIS values (average value: 63.3 ┬▒ 16.9, sampling duration: 17.1 ┬▒ 3.5 min) from 20 patients receiving microemulsion propofol and 1,878 BIS values (average value: 59.3 ┬▒ 17.7, sampling duration: 24.0 ┬▒ 7.2 min) from 20 patients receiving LCT propofol were used to determine predictive performance in BIS prediction. Performance error (PE) and absolute performance error (APE) in BIS values for microemulsion propofol and LCT propofol according to the different ke0s were depicted in Fig. 3. PE of ke0_estimation was significantly lower than that of ke0_tpeak in microemulsion propofol (P = 0.013, Mann-Whitney rank sum test). APE of ke0_estimation showed significant differences in both formulations, compared with ke0_tpeak (P < 0.001, Mann-Whitney rank sum test). Bias (median performance error) and inaccuracy (absolute performance error) in BIS prediction values for microemulsion and LCT propofol in same pharmacokinetic model with different ke0s are demonstrated in Table 4. BIS values predicted by ke0_estimation method showed higher accuracy than those predicted by ke0_tpeak method.
Discussion
The median tpeak of microemulsion propofol was 1.68 min. The ke0 derived from sequential pharmacokinetic and pharmacodynamic modeling showed higher accuracy in BIS prediction than that of ke0 calculated by the time to peak effect in both propofol formulations.
The tpeak method should be used only for linking separate pharmacokinetic and pharmacodynamic studies for the same drug, as employed in an earlier study [1], where tpeak increased with age and this finding was consistent with our results. In other study [10], tpeak was not affected by age, which may be explained by the fact that distribution of age was relatively narrow (49 ┬▒ 16 yr). Age of patients enrolled in present study for obtaining ke0 of microemulsion propofol calculated by tpeak method was 24-86 yr, which was similar to the previous study (25-81 yr) [1]. Overall, elderly patients showed prolonged onset of action on administration of drug [11,12]. Age was a significant covariate for ke0 in population pharmacodynamic modeling of remifentanil, where t2/1ke0 increase with increasing age [7,13]. These facts may be explain the relationship between age and time to peak effect, even though effect of age on ke0 of propofol using population pharmacodynamic analysis has not yet been elucidated.
In Noh model, lean body mass, weight and sex were significant covariates for V2, CL and Q1, respectively, resulting in different hybrid constants according to the individual patients. Hence, ke0s of microemulsion propofol calculated by tpeak method have different values when height, weight and sex are not identical each other. On the other hand, in modified Marsh model, weight was a significant covariate for all pharmacokinetic parameters in volume and clearance domain, resulting in same hybrid constant due to reducing a fraction with weight. The ke0 of LCT propofol calculated by tpeak method is identical (1.2152 /min) in modified Marsh model, irrespective of patients' demographics.
In general, predictive performance of a TCI system was clinically acceptable when inaccuracy is less than 20-30 % [9]. Pharmacodynamic predictions as described by BIS exhibited smaller bias and inaccuracy in present study. Theoretically, because effect-site concentration per se should be statically related to effect, target effect-site controlled infusion using Noh or modified Marsh models can be available to predict BIS approximately, irrespective of method for obtaining ke0.
Biases and inaccuracies of a TCI system may be smallest when it incorporates pharmacokinetic parameters and ke0 obtained from a single population. Potential causes of performance errors in the predictive performance of a TCI system may include model misspecifications and mechanical errors of the infusion pump, such as trumpet curves [14]. A trumpet curve could be more likely to develop on long time of infusion. In this study, effect of trumpet curve can be excluded from interpretation of result, because predictive performance of BIS prediction was analyzed in induction and recovery periods. Model misspecification of pharmacodynamic model shows a tendency of being smaller in the sequential pharmacokinetic and pharmacodynamic modeling, compared with simultaneous pharmacokinetic and pharmacodynamic modeling. Model misspecification of pharmacokinetic model can convert to that of pharmacodynamic model in simultaneous pharmacokinetic and pharmacodynamic modeling. Pharmacokinetics of microemulsion propofol were well described by mammillary three compartment model and the results of typical pharmacokinetic parameter were used to characterize the relationship concentration and effect using inhibitory sigmoid Emax model.
In summary, the median time to maximally decreased BIS from baseline value after an intravenous bolus of microemulsion propofol 1 mg/kg was 1.68 min. BIS values predicted by ke0_estimation method showed higher accuracy than those predicted by ke0_tpeak method.