Introduction
Pharmacokinetic (PK) models of propofol have been used in target controlled infusion (TCI) for the rapid achievement and maintenance of a stable plasma concentration (Cp) within a clinically acceptable range of performance errors [1-3]. However, each PK model has different parameter values, even though the parent drug is the same. Recent reports using a non-linear mixed effect model present complex parameter sets that are expressed with complex equations of covariates. Commercially available TCI devices and PK software programs have various PK models for one drug. Therefore, we have faced some difficulties in choosing the appropriate PK model for routine clinical settings. Furthermore, time courses of predicted Cp and effect-site concentration (Ceff) of propofol were different when the manual bolus and continuous infusion were simulated using different PK models. Likewise, the amounts of propofol administered for maintenance of a stable Cp were also different between the PK models [4]. Therefore, we compared the PK models of propofol to investigate different infusion patterns using the reproducing simulation of TCI data of one PK model using another PK model.
Materials and Methods
With approval of the Institutional Review Board and signed informed consent, a total of 60 female patients, American Society of Anesthesiologists physical status I, age 20-50 years, and scheduled for gynecologic surgery under general anesthesia were enrolled in this study. Exclusion criteria included body weight of over 150% of ideal body weight, medications for the central nervous system, patients with chronic pain, or neurological and endocrine disorders. Patients received glycopyrrolate 0.2 mg intravenously for premedication; however, no other sedatives were administrated before and during the period of this study. Electrocardiograph, pulse oximeter, noninvasive blood pressure monitor, and capnogram were applied. Heart rate and blood pressure were monitored and recorded every 30 s during the study and thereafter every 3 min. After pre-oxygenation, lidocaine 30 mg was given and propofol TCI was started.
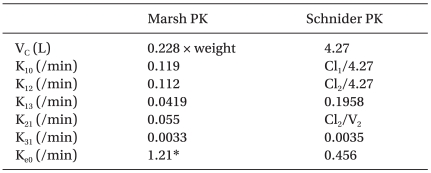
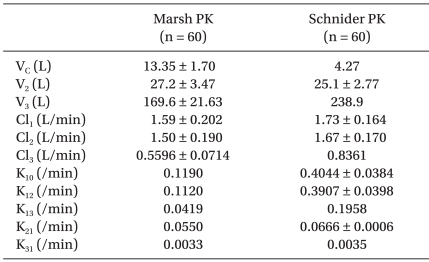
Patients were randomfly assigned to one of two groups. The three compartment mammillary pharmacokinetic model of Marsh PK [5] and 1.21/min of Ke0 [6] were used for Group M, and the multiple covariate-adjusted model of Schnider et al. [7,8] was used for Group S. The PK parameters and their equations with covariates and the Ke0 are illustrated in Table 1. Propofol (1% Fresofol┬«, Fresenius Kabi, Graz, Austria) was administrated using a syringe pump (Graseby 3500, Sims Graseby Ltd., Herts, England) targeting at 6.0 ┬Ąg/ml of Cp for induction of anesthesia. The syringe pump was controlled using pharmacokinetic/pharmacodynamic (PK/PD) software (STANPUMP┬®, written by Steven L. Shafer, Palo Alto, CA, USA) through RS232 serial communication. The propofol-filled syringe was connected to the 3-channel extension tube with a unidirectional valve preventing the back flow to the intravenous bag. In the case of any alarm triggered from the TCI device during the study, the patient was also excluded from the study.
Assessment of loss of responsiveness
About the time the patients became drowsy, a blind investigator assessed the loss of responsiveness (LOR), asking them to open their eyes with mild prodding of their shoulder every 10 s. Any responses to these stimuli, such as opening their eyes, nodding their head, and any kind of behavior showing an attempt to respond, were defined as 'responsiveness', and no response was defined as 'LOR'. We have chosen the 10-s interval because the interval for pump control update and data saving was set at 10 s. Time to LOR, the predicted Ceff and the amount of propofol infused until LOR were recorded. Interventions were terminated when subjects had shown LOR. During the study, patients received oxygen via a facemask. If oxygen saturation decreased below 95%, they were encouraged to breathe deeply if they responded to verbal commands, and if not, then manual breathing was supported using an anesthetic breathing circuit system with oxygen, while maintaining the end-tidal CO2 partial pressure between 30 and 35 mmHg. After LOR, opioid or neuromuscular blocking agents were administered, and tracheal intubation was done according to scheduled surgery.
Total cross-simulation of the predicted plasma and effect-site concentrations
After surgery, two kinds of TCI regimen were simulated for every patient. (1) Regimen I: Two hour TCI was virtually performed targeting 6.0 ┬Ąg/ml of Cp. (2) Regimen II: TCI was provided targeting 6.0 ┬Ąg/ml of Cp (0 min to 10 min), then decreased to 4.0 ┬Ąg/ml (10 min to 2 hr). The cumulative amounts of propofol infused until 1, 5, 10, 30, 60, 90, and 120 min were compared between models. Total cross-simulation was performed using the reproducing function of STANPUMP┬®; the TCI using Marsh PK (Marsh TCI) was analyzed using Schnider PK (MARSHSCH), and the TCI using Schnider PK (Schnider TCI) was analyzed using Marsh PK (SCHNIDERMAR). The analysis was performed using the command line arguments with a patient-specific external parameter PK/PD file (e.g. Stanpump kinetics marsh.kin rep patient1.dat). In addition, the reproduced Cp (Cp-rep) and Ceff (Ceff-rep) were saved on a hard disk. We also investigated the correlation between the patient's covariates (age, body weight, height, and LBM) and the percentage differences after 2 hr infusion. The percentage difference was calculated as follows:
Percentage difference (%) = 100 ├Ś (Cp-rep - Cp-prior) / Cp-prior
Time courses of Cp-rep and Ceff-rep were evaluated with the prior target plasma (Cp-prior) and effect-site concentration (Ceff-prior). Peak deviation from the prior target, time to intercept the prior predicted concentration, and Cp-rep and Ceff-rep at 30 min and 2 hr were compared.
Separate cross-simulation of the predicted plasma concentrations
Separate cross-simulation was performed in order to determine the effect of one PK parameter on the overall differences. We replaced only one PK parameter of one model with the corresponding value of the other PK model, and performed simulations with the infusion data that targeted 6.0 ┬Ąg/ml of Cp. Each simulation was separately investigated for six PK parameters (VC, V2, V3, Cl1, Cl2, and Cl3), and time courses of the percentage difference were evaluated. The percentage difference was calculated as follows:
Percentage difference (%) = 100 ├Ś (Cp-rep - Cp-prior) / Cp-prior
Statistics
Comparisons of demographic and hemodynamic variables, observations of LOR, total propofol infused, differences of Cp-rep and Ceff-rep were performed with the Student t-test (SPSS┬®, version 10.0.1, SPSS Inc.) at a P < 0.05 level of significance. Data were presented as mean ┬▒ SD, unless stated otherwise. Regression between the covariates and the discrepancy observed in the predicted concentrations were performed with linear regression (SigmaPlot┬® 2004 for Windows Version 9.0, Systat Software, Inc., USA).
Results
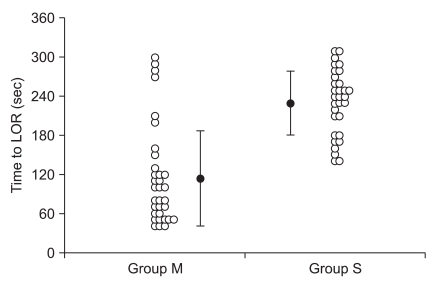
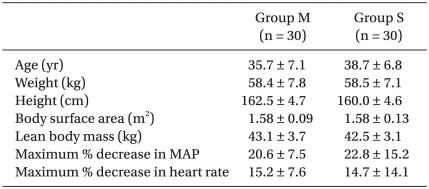
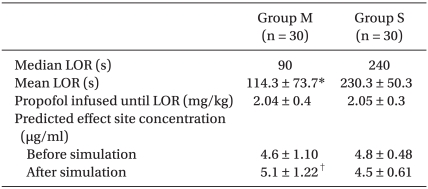
There were no significant differences in the demographic data and hemodynamic variables between groups (Table 2). Group M showed shorter time to LOR compared to Group S (P < 0.001). However, the amount of propofol infused until LOR did not differ significantly between the groups (Table 3 and Fig. 1). Ceff at LOR did not differ between groups, but after cross-simulation using the other PK/PD model, Ceff at LOR were significantly different between groups (P = 0.009) (Table 3).
Total cross-simulation
Regimen I
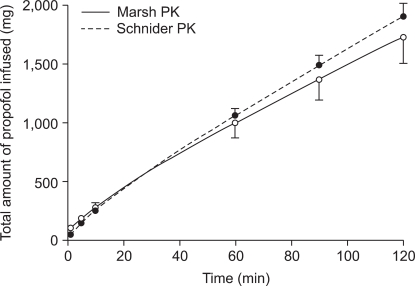
Marsh TCI infused more propofol than Schnider TCI until 1, 5, and 10 min (P < 0.001); in particular, nearly twice the amount of propofol was infused during Marsh TCI (98.6 ┬▒ 11.9 mg) compared to Schnider TCI (48.4 ┬▒ 1.3 mg) during the first 1 min after the start of infusion. However, Marsh TCI infused less propofol until 60 min (P = 0.009), 90 min (P = 0.01), and 120 min (P < 0.001) compared to Schnider TCI (Fig. 2).
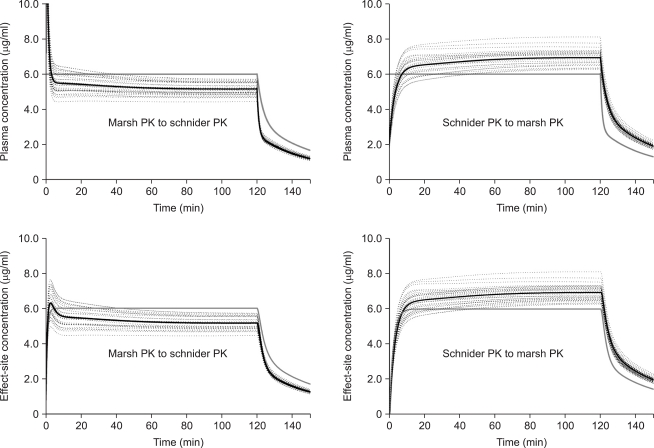
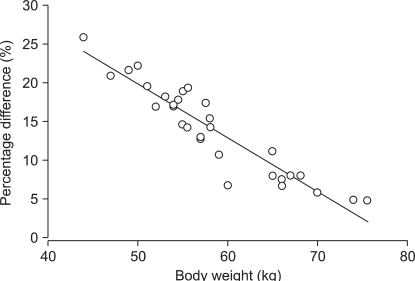
MARSHSCH showed that Cp-rep was over-predicted up to 15.4 ┬▒ 1.86 ┬Ąg/ml, and decreased to Cp-prior at 3.3 min after the start of infusion (Fig. 3, left upper graph). Thereafter, it gradually decreased to 5.4 ┬▒ 0.44 ┬Ąg/ml at 30 min (P < 0.001) and 5.1 ┬▒ 0.35 ┬Ąg/ml at 2 hr (P < 0.001). Ceff-rep was also over-predicted up to 6.3 ┬▒ 0.71 ┬Ąg/ml at 2.9 min (P < 0.001) (Fig. 3, left lower graph). Thereafter, it gradually decreased to 5.4 ┬▒ 0.45 ┬Ąg/ml at 30 min (P < 0.001) and 5.2 ┬▒ 0.35 ┬Ąg/ml at 2 hr (P < 0.001). The percentage of difference of prediction at the end of the 2 hr infusion correlated well with body weight (Rsqr = 0.9821, P < 0.001) (Fig. 4), and LBM also correlated well (Rsqr = 0.9603, P < 0.001).
SCHNIDERMAR showed that Cp-rep was under-predicted during the initial period of infusion and while it reached Cp-prior at 7.5 min. It then increased to 6.61 ┬▒ 0.51 ┬Ąg/ml at 30 min (P < 0.001) and 6.94 ┬▒ 0.45 ┬Ąg/ml at 2 hr (P < 0.001). Ceff-rep increased more slowly than Ceff-prior during the early period of infusion and became Ceff-prior at 8.7 min. It then increased to 6.61 ┬▒ 0.51 ┬Ąg/ml at 30 min (P < 0.001) and 6.9 ┬▒ 0.45 ┬Ąg/ml at 2 hr (P < 0.001).
Regimen II
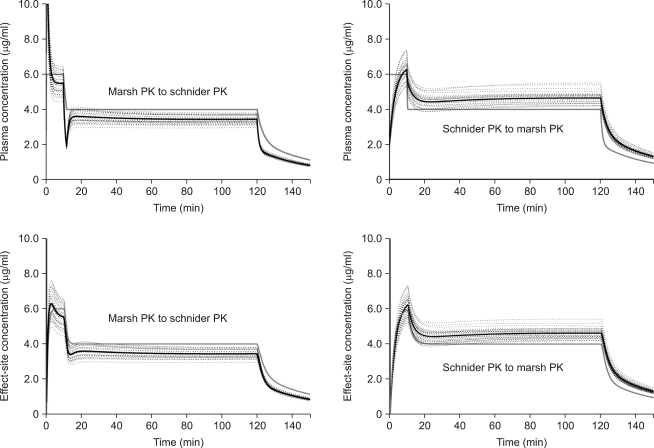
Patterns of discrepancy during the first 10 min were similar to those of Regimen I. After the target concentration decreased to 4 ┬Ąg/ml, MARSHSCH showed that Cp-rep decreased to 2.0 ┬▒ 0.13 ┬Ąg/ml, and increased to 3.6 ┬▒ 0.28 ┬Ąg/ml at 30 min (P < 0.001), then decreased to 3.4 ┬▒ 0.23 ┬Ąg/ml at the end of the 2 hr infusion (P < 0.001) (Fig. 5, left upper graph). After the target concentration decreased to 4 ┬Ąg/ml, Ceff-rep decreased to 3.4 ┬▒ 0.30 ┬Ąg/ml at 14.3 min, and became 3.6 ┬▒ 0.29 ┬Ąg/ml at 30 min (P < 0.001). It finally decreased to 3.4 ┬▒ 0.23 ┬Ąg/ml at the end of the 2 hr infusion (P < 0.001) (Fig. 4, left lower graph).
After the target decreased to 4 ┬Ąg/ml, SCHNIDERMAR showed that Cp-rep decreased, but remained higher than Cp-prior and increased to 4.5 ┬▒ 0.36 ┬Ąg/ml at 30 min (P < 0.001) and 4.7 ┬▒ 0.34 ┬Ąg/ml at 2 hr (P < 0.001) (Fig. 4, right upper graph). After the target concentration decreased to 4 ┬Ąg/ml, Ceff-rep showed a much slower decrease, but remained higher than Ceff-prior, and showed a maximal decrease to 4.4 ┬▒ 0.35 ┬Ąg/ml at 24.3 min, and increased to 4.4 ┬▒ 0.34 ┬Ąg/ml at 30 min (P < 0.001) and 4.6 ┬▒ 0.29 ┬Ąg/ml at 2 hr (P < 0.001) (Fig. 4, right lower graph).
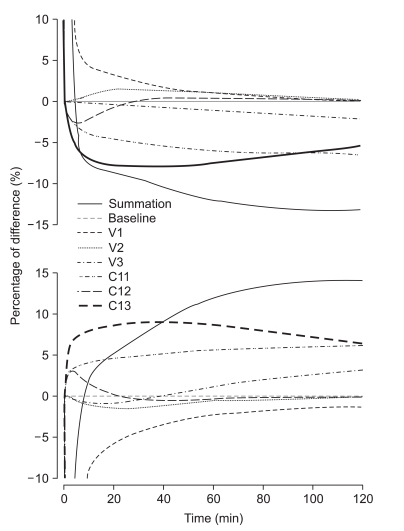
Separate cross-simulation
The mean ┬▒ SD or fixed values of PK parameters for separate cross-simulation are illustrated in Table 4. Fig. 6 shows the time course of the percentage difference of each parameter. VC appeared to be relevant to the initial large difference. Thereafter, Cl1 and V3 increasingly contributed to the difference until 2 hr of infusion. The upper and lower graphs show a mirror image, and the summation curve of the percentage differences of each parameter appeared to be similar with MARSHSCH and SCHNIDERMAR of Regimen I.
Discussion
During TCI of propofol, the infusion data files that were supposed to maintain a stable Cp did not produce identical results when played back to a different PK model. The differences were greater during the early period of infusion, whereas later a relatively stable range of differences was maintained, but with a continual increase during long-term infusion. These discrepancies highly correlated with the body weight of the subject.
Using simulations, we attempted to perform a straightforward comparison of the integrated difference of the two PK models. Apparently, the volume of the central compartment of Marsh PK was nearly triple that of Schnider PK. Therefore, Marsh PK required a larger amount of propofol to fill up the central compartment when there was no drug in the body, and, as a result, showed a more rapid loss of responsiveness than Schnider PK. However, the clearance of the central compartment of Marsh PK was smaller than that of Schnider PK. Therefore; we could deduce that Marsh TCI requires less propofol than Schnider TCI. These differences appeared to be distinct when we simply compared the cumulative amounts of propofol and the PK parameters (3 volumes and 3 clearances). However, the degree of discrepancy during TCI and time course of the predicted concentration could not be determined.
Therefore, we performed total and separate cross-simulation. During the early phase of infusion, the difference of Cp was significant. Thereafter, overall differences were shown to be roughly 10% (at 30 min) and 15% (at 2 hr) under- or overprediction of Cp, and the differences showed a gradual increase with time. However, total cross-simulations could not explain the impact of each parameter on the overall difference of prediction. Therefore, we performed separate cross-simulations. Young and Shafer [9] also demonstrated the changes of Cp and decrement time of three opioids by independently changing the volumes and clearance of the three compartments. They used simulations that were similar to our method, while predicting the change in Cp of opioid after a bolus if each pharmacokinetic parameter were independently increased by 5%. Our separate cross-simulation showed that VC mainly contributed to the initial differences, and Cl1 and V3 to the difference of long-term infusion. The difference of Cl3 also seemed to be an important factor during the initial period, but contributed less during long term infusion.
Even though Marsh TCI showed a more rapid loss of responsiveness than Schnider TCI, the amount of propofol infused until LOR and Ceff at LOR did not differ between the groups (Table 3). The ke0 used for Marsh PK was 1.21/min [6], whereas 0.456/min was used for Schnider PK. The volume of distribution of Schnider PK was small and time to LOR was long during Schnider TCI, but the predicted Ceff slowly increased because of its smaller ke0 than Marsh PK. Therefore, Ceff at LOR appeared to be insignificant between groups. However, the reproduced Ceff at LOR after simulation was significantly different between groups. During TCI, Ceff is calculated using the ke0 and Cp. However, the value of ke0 is highly influenced by the PK model and it was reported that it is unwise to use the ke0 from one PK model with another PK model from a different study [6,10,11].
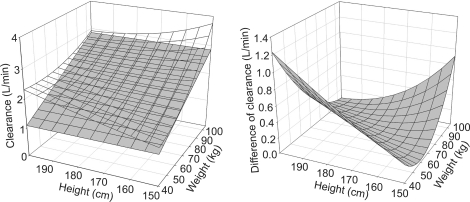
Body weight and LBM correlated well with the discrepancies of prediction. LBM is calculated using body weight and height. In Marsh PK, body weight influences VC, V2, V3, Cl1, Cl2, and Cl3. As a result, decreasing body weight leads to a smaller volume and clearance of each compartment. In addition, the relationship between Cl1 and height-body weight showed a flat mesh (Fig. 7, left graph, gray mesh). In Schnider PK, only Cl1 is influenced by body weight and height. Decreasing body weight and height leads to smaller Cl1, and increasing height with lower body weight or decreasing height with higher body weight leads to a higher Cl1 (Fig. 7, left graph, transparent mesh). Therefore, a taller patient with a lower body weight or a shorter obese patient showed a larger difference of clearance between the two models (Fig. 7, Right graph). Accordingly, there could be a large difference in the level of hypnosis between models during the TCI to these types of patients.
In our study, the mean Cl1 of Schnider PK was 8.8% higher than that of Marsh PK. Wietasch et al. reported that they found a smaller VC (3.55 L) than Marsh PK, and Cl1 was reduced to 1.31 L/min in comparison with that of Marsh PK (2.04 L/min) and Schnider PK (1.89 L/min) [3]. In this study, contrary to our study, Cl1 of Marsh PK was greater than Schnider PK, and mean body weights of subjects were around 75 kg, which was the heaviest body weight in our study. Kim et al. [12] reported that the VC of lipid emulsion of propofol was 3.9 L and Cl1 was 1.53 L/min. Jung et al. [13] reported that VC of lipid emulsion of propofol was 6.78 L and Cl1 was 1.46 L/min. The populations of these two reports were similar overall to those of our study. Marsh PK and Schnider PK are known to under-predict Cp [3,14]. White et al. [15] also suggested the use of the parameters of Marsh PK adjusted with the covariates, such as age and gender. Therefore, the possibility of overdose of propofol using Schnider PK could increase during long term infusion, especially for patients with low body weight.
There are some caveats that need to be taken into consideration. First, our study evaluated the PD difference between the models, only for the period of induction of anesthesia. Further study on the PD differences during maintenance of anesthesia and recovery period will be helpful in differentiation of the characteristics between the models. Second, the population of this study was limited to females. TCI using Marsh PK administers propofol irrelevant to gender. However, Schnider PK estimates different Cl1 according to gender. The covariate, LBM, used for calculation of Cl1, is differently calculated according to gender; men, LBM = 1.1 ├Ś weight - 128 ├Ś (weight / height)2; women, LBM = 1.07 ├Ś weight - 148 ├Ś (weight / height)2 [16]. Cl1 for women is calculated higher than that of men when other covariates are equal. Therefore, the results of this study could be different if investigated for both genders. Third, it took nearly 4 min to induce LOR using Schnider PK. The longest time to LOR was 310 s in Group S, which is considered to be inadequate for the routine induction of anesthesia. Therefore, other modalities, such as higher target of Cp or targeting Ceff, are indicated.
The primary goal of this study was to increase our understanding between the different PK models and the influence of PK parameters on the infusion patterns during TCI. This comparison method between PK models would be helpful in selection of an appropriate PK model of a certain drug in clinical settings and research fields.