Introduction
Propofol and remifentanil are commonly co-administered in intravenous anesthesia and have shown a synergistic effect [1,2]. However, reports on hypnotic interaction between propofol and remifentanil measured by bispectral index (BIS) have been a few and contradictory [3-7].
The combination index (CI), dose-effect curve and isobologram have been used in many biomedical studies to evaluate drug interactions and to determine the optimal doses of combined injection [8-10]. However, there have been few studies employing these parameters to analyze the interactions of propofol and remifentanil.
Therefore, in this study, we determined the interaction of the two drugs on BIS and the best hypnotic dose combinations using dose-effect curve, isobologram, and CI on patients undergoing a gastrectomy.
Materials and Methods
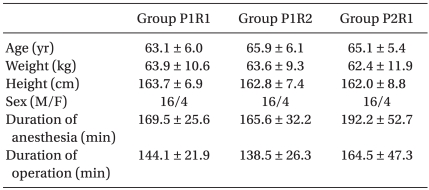
This study was approved by the hospital ethics committee and informed consent was obtained from the patients. Patients undergoing an open gastrectomy were randomly assigned by sealed envelope technique into the propofol : remifentanil 1 : 1 potent ratio (P1R1) group (n = 20), the propofol : remifentanil 1 : 2 potent ratio (P1R2) group (n = 20) and the propofol : remifentanil 2 : 1 potent ratio (P2R1) group (n = 20). The inclusion criteria were American Society of Anesthesiologists (ASA) 1 or 2 patients between the ages of 55 and 75. The exclusion criteria were patients with severe cardiovascular, renal, hepatic, or neuropsychiatric diseases, and a history of addiction or allergic reactions to opioids and sedatives. Patients and an anesthesiologist evaluating the BIS were blinded to the group assignment. Modulation of the infusion pump was carried out by another anesthesiologist outside of the anesthetic field. The demographic profiles and the operation-related data were similar in all three groups.
No patient received premedication. Routine intraoperative monitoring and a BIS monitor version 2.1 (A-2000, Aspect medical Systems, Natick, MA, USA) were applied. The baseline mean blood pressure, heart rate, and BIS were measured when the patient was stable before inducing anesthesia. A routine anesthetic induction was conducted using lidocaine 40 mg, propofol 2.5 mg/kg, rocuronium 0.6 mg/kg and sevoflurane.
Study to construct the dose-effect curves was performed after the retractor had been applied and during surgical stimuli was similarly maintained. Sevoflurane was washed out, while N2O 2 L/min and O2 1 L/min were started. When the BIS reached 70, the designated drugs were started according to the groups. The drugs were administered by effect site target concentration using an Orchestra pump (Orchestra™, Fresenius Vial, France). No other opioids or sedatives were used during the study.
In the previous study of Kim and Ahn [11] with the same setting with this study, the EC50 of propofol and remifentanil single administration was effect site concentration 1.34 µg/ml and 1.93 ng/ml, and the EC90 was effect site concentration 4.73 µg/ml and 12.93 ng/ml, respectively. Based on this EC50, the P1R1 group received an equipotent drug infusion; 1/4 × EC50 of each drug was co-administered, and the dose was increased to 1/2 × EC50, EC50, 1.5 × EC50, and 2 × EC50 at 6 minute intervals. The P1R2 group received a remifentanil dominant infusion; 1/4 × EC50 of propofol and 1/2 × EC50 of remifentanil were co-administered, which were increased to 1/2 × EC50 and EC50, EC50 and 2 × EC50, 1.5 × EC50 and 3 × EC50 at 6 minute intervals. The P2R1 group received a propofol dominant infusion; 1/2 × EC50 of propofol and 1/4 × EC50 of remifentanil were co-administered, which were increased at 6 min intervals to EC50 and 1/2 × EC50, 2 × EC50 and EC50, 3 × EC50 and 1.5 × EC50.
The BIS were measured at the end of every six minutes (6 minutes : 6 times of the blood-effect site equilibration half-time (T1/2keo) of remifentanil [12], 3 times of the [T1/2keo] of propofol [13]). The BIS values were calculated by averaging the three epochs immediately before the assessment.
The dose-effect curves, isobologram, and CI of co-administration groups were constructed using the multiple drug-effect equation suggested by Chou-Talalay using the Calcusyn program (Biosoft, Cambridge, UK) [9]. Targeted BIS was 40 (BIS = 40, effect = 1) and effect 0 was the mean baseline BIS (BIS = 97.3, effect = 0).
(fa)1,2/(fu)1,2 = [(D)1/( EC50)1 + (D)2/( EC50)2]m
Where (D)1, (D)2 : the dose of drug 1 and 2, (EC50)1, (EC50)2: the median-effect dose of drug 1 and 2, (fa)1,2: the fraction affected by the dose of drug 1 and 2, (fu)1,2: the fraction unaffected by the dose of drug 1 and 2, fu = 1 - fa, m: an exponent signifying the sigmoidicity (shape) of the doseeffect curve.
CI = (D)1/(Dx)1 + (D)2/(Dx)2
Where (Dx)1: dose of D1 drug alone that affect a system x%. (Dx)2: dose of D2 alone that affect a system x%. (D)1: dose of D1 in combination that affect a system x%. (D)2: dose of D2 in combination that affect a system x%.
The CI shows the type of interaction of the combined drugs. Usually, a CI in the range of 0.9 and 1.1 is considered to be an additive action. A CI < 0.9 and CI > 1.1 indicate synergism and antagonism, respectively.
The isobologram is a convenient graphical display, in which equipotent pairs of the doses of two drugs are connected by a line, which represents the additive activity between the two drugs. Synergism or antagonism was considered to exist between the two drugs if the dose of the combined drugs was lower or higher than this line, respectively [8].
Data analysis
The primary outcome variable was the difference in the CI at EC90 between the three groups. The expected differences in means were set at 0.5 with an expected standard deviation of 0.5. A sample size of 20 in each group was required to achieve a power of 80% with an alpha error of 0.05. A z-test with Bonferroni's correction was carried out to compare the CI in the three groups. The comparisons of the effect site concentrations between the co-administration groups were performed by One way analysis of variance or Kruskal-Willis one way analysis of variance on ranks according to the normality of the data. A P value < 0.05 was considered significant.
Results
No differences in demographic data were evident among the three groups (Table 1).
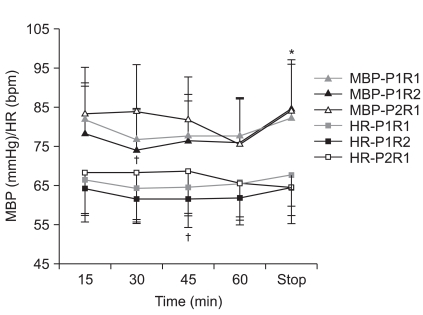
Mean blood pressure and heart rate were lower in the P1R2 group compared to the other groups (Fig. 1).
Each effect site concentration and the corresponding BIS in the three groups were shown in the Table 2.
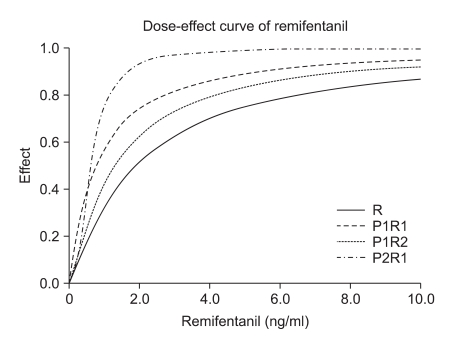
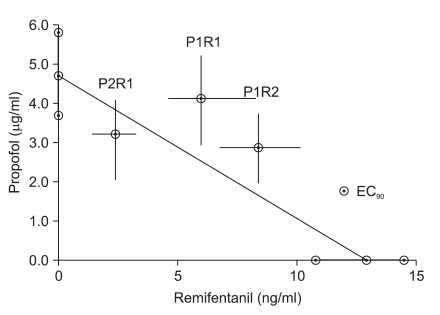
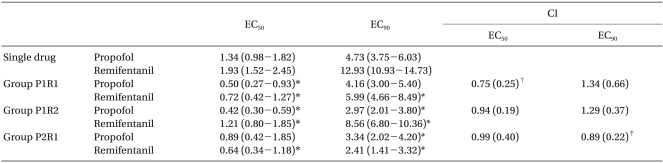
In our study, synergism is defined better efficacy than a simple additive action shown in isobologram and CI < 0.9. In this regard, only the P2R1 group showed synergism. Higher effect site concentration of each drug than that in additive action was needed in other dose combinations (Table 3, Fig. 2-4).
Discussion
Most previous studies used arbitrary chosen dose combinations of propofol and remifentanil [3-7]. We used propofol and remifentanil 1 : 1, 1 : 2, and 2 : 1 ratio combinations based on potency to find out whether propofol or remifentanil dominant co-administration or the same potent co-administration of each drug would be more synergistic. Most previous studies also did not include N2O in their studies, however, N2O is routinely administered in our institution and in many others during propofol and remifentanil anesthesia. To reflect clinical practice, we administered 66% N2O simultaneously.
In this study, the P2R1 group was found to be the most effective combination for adequate hypnosis measured by BIS and the effect site concentration at EC90 was propofol, 3.34 µg/ ml and remifentanil, 2.41 ng/ml under 66% N2O.
In general, most studies on the co-administration of propofol and remifentanil have reported synergism. They used the clinical responses, such as Observer Assessment of Alertness/Sedation, autonomic, hemodynamic, or somatic responses to various stimuli as a potency measurement of the combined drugs [1,2,14,15].
The studies regarding the interactions of propofol and remifentanil on the BIS showed controversial results. Strachan and Edwards [3], Koitabashi et al. [4], and Röpcke et al. [5] showed the dose-dependent decrease in the BIS or a decrease in the propofol requirements to maintain a certain BIS with increasing remifentanil concentrations and presented them as evidence of synergism. On the contrary to above reports, Lysakowski et al. [16] and Guignard et al. [7] found that the relationship between propofol effect-site concentration and BIS was preserved with or without opioids. Wang et al. [6] also found that an infusion of remifentanil did not reduce the propofol requirements.
In our study, the addition of remifentanil reduced the propofol requirement and vise versa in all three groups (Table 3, Fig. 2 and 3). However, synergism should be defined as lower doses than the doses of additive action. In this regard, only the P2R1 group showed synergism at the hypnotic level of BIS. The P1R1 and P1R2 groups required larger doses than the doses of additive action (Table 3, Fig. 4).
No synergistic effect in the P1R1 and P1R2 groups might be explained by that opioids have a ceiling effect on EEG. Once this ceiling effect has been reached, increasing opioid dosage does not further affect the EEG [17]. For another possible reason, opioids induce neuroexcitatory phenomena (sharp and spike wave activity) on EEG after large doses [18] which can be interpreted as high BIS values. Therefore, as a simplified EEG measurement, BIS might not reflect the real hypnotic or anesthesia in the case of equipotent infusion of propofol and remifentanil or remifentanil dominant infusion. And our result implies that only propofol dominant co-administration is advisable to reduce the amount of each drug during BIS guided anesthesia.
The limitations of our study include the use of sevoflurane before the start of study. We used sevoflurane because we assumed that sevoflurane which is more rapidly eliminated from the body than intravenous anesthetics would affect less on the intravenous concentration of studied drugs. All the groups had the same sevoflurane which was almost washed out during the study period. The end tidal concentration of sevoflurane was 0.10-0.20 vol% when the study started. However, remnant sevoflurane might have affected on BIS. For another limitation, we administered 66% N2O to all groups to reflect our clinical practice. There have been controversies regarding the effect of N2O on BIS. Some insisted that N2O up to 70% does not affect the BIS [19]. However, addition of N2O to propofol and remifentanil co-administration deepened anesthesia and prevented movement without affecting BIS [20]. In the contrary, others demonstrated significant changes on BIS by N2O [21]. Therefore, N2O might have influenced our results, however, with keeping the N2O concentrations similar among three groups, the focus of our study-interaction of propofol and remifentanil on BIS is still considered valid.
In conclusion, the propofol dominant-infusions are recommended for a BIS guided hypnosis and the addition of high dose-remifentanil might not result in synergistic dose reduction on BIS guided anesthesia.