Introduction
Dynamic preload indices reflecting respiratory changes in heart-lung interaction, such as systolic pressure variation (SPV), pulse pressure variation, and stroke volume variation (SVV), have been demonstrated to be useful in predicting fluid responsiveness in mechanically ventilated patients [1-3]. However, these dynamic preload indices were found to be inaccurate in predicting fluid responsiveness in patients with SB activity, because SB conditions differ from positive pressure ventilation, especially in the amplitude of intrathoracic pressure swing and the irregular, uncontrolled nature of the tidal volume under SB conditions [4,5].
The respiratory-related hemodynamic variables can easily be distinguished by frequency domain analysis, allowing intrinsic variability in particular phenomena to be divided into various components characterized by different frequencies. In particular, the high- frequency or respiratory frequency (RF) power of SPV (SPVRF), which principally represents the mechanical effect of respiration on blood pressure, has been shown in mechanically ventilated animals to indicate the preload state of graded hypovolemia [6-8]. Additionally, paced breathing (PB) maneuvers have been frequently used to standardize measurements of respiratory-related variables in studies of autonomic cardiovascular regulation [9,10]. We therefore hypothesized that PB maneuvers concentrated and augmented the mechanical effects of respiration in SB patients with hypovolemia, and that respiratory parameters would be similar to those in patients receiving mechanical ventilation.
In the present study, we tested the hypothesis that RF spectral analysis of dynamic preload variables using may permit construction of a useful index for detecting changes in intravascular volume and fluid responsiveness in voluntary PB conscious subjects. Such a method might obviate the difficulties inherent in measuring undersized and inconsistent heart-lung interaction indices, which frequently occur in hemodynamically unstable SB patients.
Materials and Methods
Subjects
The subjects consisted of 18 healthy volunteers, 11 men and 7 women, of mean age 32 years (range, 26-45 years). Volunteers were free of cardiovascular and other systemic diseases, and none was taking any cardiovascular medication. The study protocol was approved by the local Institutional Review Board for Protection of Human Subjects, and all subjects provided written informed consent before participation.
Paced breathing
Subjects were placed in the supine position and encouraged to stay relaxed throughout testing. After instrumentation was standardized, subjects were acclimatized to the PB protocol. To avoid involuntary slow and fast breaths, each subject breathed in synchrony with a computer-controlled voice that signaled the beginning and the end of each inspiration and expiration at a frequency of 0.25 Hz (15 breaths/min). Tidal volumes were not set, and subjects were instructed to breathe at a comfortable depth and advised not to force their breathing, to prevent hyperventilation.
Lower body negative pressure as a hemorrhage model
To simulate central hypovolemia, each subject was placed into a lower body negative pressure (LBNP) chamber, consisting of a steel cylindrical apparatus, in which the subject rested supine on a well-padded seat. Each subject wore a kayak-style skirt, which formed an airtight seal between the subject and the chamber at the level of the iliac crest. Suction was applied using a commercial vacuum cleaner equipped with a variable-speed motor, and chamber pressure was continuously monitored. Subjects were instructed not to contract their leg muscles during LBNP. Subjects were exposed to progressive LBNP; baseline, -30 mmHg, and -60 mmHg, which were considered equivalent to normality, and moderate and severe hemorrhagic conditions, respectively [11]. The LBNP test was terminated when any sign of presyncope was observed; these included nausea, sweating, blurred vision, or dizziness; accompanied by a >15 mmHg drop in systolic blood pressure, a fall in heart rate greater than 15 beats/min, or progressive reduction in systolic blood pressure to below 80 mmHg.
Recordings and study protocol
A Cardiocap monitor™ (Datex-Ohmeda, Helsinki, Finland) was used to assess the partial pressure of end-tidal CO2 via nasal prongs, as a monitor of respiratory frequency, and to perform electrocardiography (ECG). Beat-by-beat arterial blood pressure (ABP) was non-invasively and continuously measured by a fully automated Finometer® device (Finapres Medical Systems, TNO-BMI, The Netherlands), which uses a volume clamp technique and has been well validated against intra-arterial BP measurements [12]. Beat-by-beat ECG and ABP signals were digitized and collected at 500 samples per second using an online personal computer that interfaced with an analog-to-digital converter for offline analysis using dedicated signal processing software (Windaq, DATAQ instruments; DADiSP, DSP development, Cambridge, MA, USA).
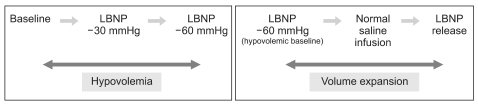
Hypovolemia was simulated by progressive levels of LBNP: baseline, -30, and -60 mmHg, and the hypovolemic baseline state was set at -60 mmHg. Volume expansion was produced in two steps: infusion of 10 ml/kg of normal saline via an 18 G intravenous catheter placed in the antecubital vein for 10-12 min at hypovolemic baseline and subsequent release of LBNP to baseline level (Fig. 1). At each level of LBNP and volume expansion, data were recorded continuously during for a 90 sec period of PB at 0.25 Hz after allowing at least 3 min for stabilization of biosignals.
Time domain analysis of respiratory changes in SBP and SV: SPV and SVV
Systolic blood pressure (SBP) and diastolic blood pressure (DBP) were measured on a beat-by-beat basis. The beatby-beat stroke volume (SV) was derived from the blood pressure waveform using Beatscope® software (1.1a, TNO-BMI, Amsterdam, The Netherlands), a program that employs the Modelflow technique computing cardiac output (CO) by simulating a non-linear three-element Windkessel model of aortic input impedance [13]. This methodology has been shown to be able to track fast changes in SV in various experimental protocols, and has been used to derive simple on-line beat-by-beat SV of cardiovascular status to monitor cardiac preload in critically ill patients [14]. Maximal and minimal values for SBP (SBPmax and SBPmin) and SV (SVmax and SVmin) were determined over a single respiratory cycle of PB. SPV and SVV were calculated using the formulae:
SPV (%) = 100 × (SBPmax - SBPmin) / [(SBPmax + SBPmin)/2]
SVV (%) = 100 × (SVmax - SVmin) / [(SVmax + SVmin)/2]
and were averaged over three consecutive respiratory cycles.
Frequency domain analysis of respiratory changes in SBP and SV: SPVRF and SVVRF
Data from the last 60 sec of each 90 sec breathing session were subjected to spectral analysis for PB testing. Beat-by-beat SBP and SV were linearly interpolated at 4 Hz to provide equidistant samples and were divided into three equal overlapping segments. Each segment was linear-detrended, Hanning-filtered, and fast-Fourier transformed to yield a frequency representation squared. The periodograms were next averaged to produce a power within the RF (0.2-0.3 Hz) band of SBP variability and SV variability (SPVRF and SVVRF, respectively). SPVRF and SVVRF were computed as natural logarithms. Variability at frequencies other than the RF was not assessed.
Statistical analysis
All data are presented as means ± SDs. Normality of data distribution was assessed using the Kolmogorov-Smirnov test. Nonparametric statistical methods were used when variables did not show a normal distribution. Hemodynamic data and dynamic preload indices at different experimental stages were assessed by one-way analysis of variance for repeated measures or by the Friedman test for nonparametric distributions, followed by the Bonferroni correction. Responders and non-responders were compared using unpaired t-tests, and correlations were evaluated using linear regression and Pearson correlation analysis. P < 0.05 was considered statistically significant. Receiver operating characteristic (ROC) curves were generated for SPV, SVV, SPVRF, and SVVRF, with the changes in SV after volume challenge used as the response criterion. The area under the ROC curve (AUC) was calculated for each variable.
Results
Two subjects developed presyncopal symptoms during LBNP at -60 mmHg, requiring early termination of testing before completion of all measurements. The remaining 16 subjects completed the entire protocol without any adverse reactions.
Hemodynamic data
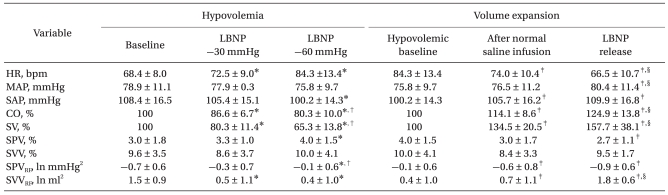
During graded hypovolemia, the heart rate increased significantly, whereas CO and SV decreased significantly, compared with baseline values. At LBNP -60 mmHg, SBP decreased compared with baseline value. During volume expansion with normal saline and release of LBNP, heart rate decreased significantly, and SBP, CO, and SV rose correspondingly at each step. Mean arterial pressure (MAP) did not change significantly until release of LBNP (Table 1).
Time domain analysis of respiratory changes in SBP and SV: SPV and SVV
SPV was significantly higher than baseline at LBNP -60 mmHg and was significantly lower than the hypovolemic baseline value following LBNP release. There were no significant differences in SVV during hypovolemia and volume expansion (Table 1).
Frequency domain analysis of respiratory changes in SBP and SV: SPVRF and SVVRF
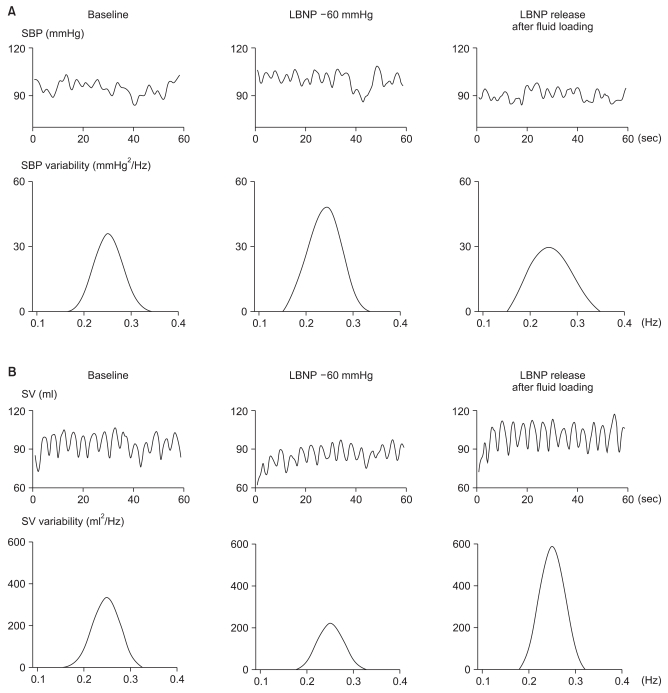
During PB activity, peaks of SBP and SV variability spectra were concentrated at 0.2-0.3 Hz (Fig. 2). SPVRF was significantly higher than baseline during hypovolemia and significantly lower than the hypovolemic baseline value during volume expansion. Conversely, SVVRF decreased significantly during hypovolemia and increased during at each step of volume expansion (Table 1).
Fluid responsiveness
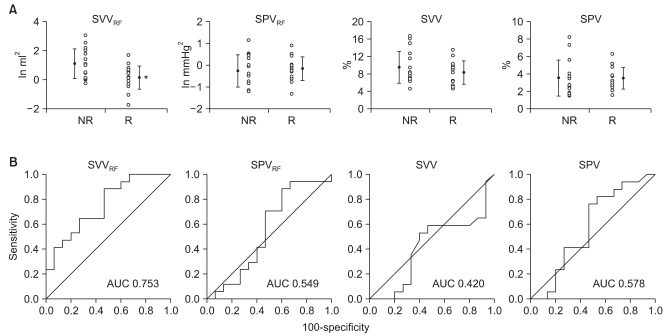
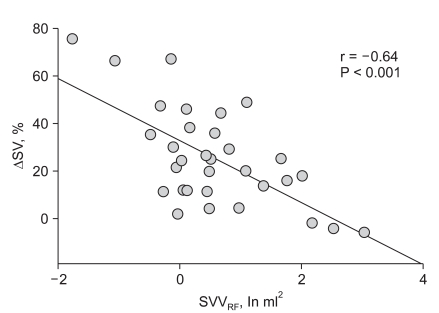
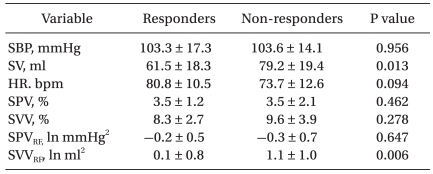
To assess volume responsiveness, subjects with ≥20% and <20% increases in SV were classified as "responders" and "non-responders," respectively. Before volume challenge, SVVRF was significantly lower in responders than in non-responders (P = 0.006), whereas SPV, SVV, and SPVRF did not differ significantly (Table 2). In ROC analysis, the AUC was higher for SVVRF than for SPV, SVV, or SPVRF (Fig. 3). Moreover, SVVRF before volume challenge was significantly correlated with changes in SV induced by volume expansion (r = -0.64, P < 0.001) (Fig. 4).
Discussion
The main results of our study, in which hypovolemia was simulated in volunteers with SB activity, were that (a) SPV and SVV failed to reliably reflect intravascular volume status under SB conditions, despite PB activity; (b) the RF power of dynamic preload indices using spectral analysis may reflect intravascular volume status in healthy volunteers using PB; and, (c) SVVRF was more reliable in predicting fluid responsiveness than were SPV, SVV, or SPVRF under SB conditions.
Spectral analysis of SBP variability can be a useful tool to represent cardiovascular autonomic nervous system [15]. Particularly, high frequency component of SBP fluctuations is believed to be the result of the mechanical interaction between SBP and respiration [16]. It has been shown that SPVRF increases during hemorrhage and falls following volume restoration in animal models [8,17]. In addition, SPVRF increased significantly in the upright tilt model, which leads to displacement of blood toward the lower body, as in LBNP [18]. These findings suggested that SPVRF is generated from an interaction between respiration and blood volume. In agreement with these results, we also found that SPVRF changed in parallel with the status of the intravascular volume during graded hypovolemia and volume expansion. Accordingly, SPVRF may reflect changes in circulatory blood volume and may thus be used to evaluate volume status, with or without mechanical ventilation.
Although there is little information on power spectral analysis of SV variability, respiration-related SV variability has been shown to be caused by changes in intrapleural pressure and direct mechanical interactions between the right and left parts of the heart [19]. It has been shown that SVVRF decreases during orthostatic load tests, which induce central hypovolemia [20]. We also found that SVVRF fell with hypovolemia and increased during volume expansion. In our study, volunteers with a low value of SVVRF at hypovolemic baseline responded to volume expansion with a high increase in CO. Furthermore, the AUC under the ROC curve was higher than those of the other variables tested. These results suggest that SVVRF predicted fluid responsiveness in SB hypovolemic volunteers. However, contrary to SPVRF, SVVRF was inversely correlated with intravascular volume depletion. Although the reason for this inverse relationship is not yet clear, we consider that a marked decrease in SV during hypovolemia may be less affected by direct mechanical heart-lung interaction under SB conditions, thus influencing respiratory SV fluctuation to a lesser degree than SBP fluctuation. Nonetheless, we found that frequency domain spectral analysis with PB enabled detection of subtle changes in SV with intravascular volume status, and prediction of fluid responsiveness under SB conditions.
Previous dynamic preload indices such as SPV and SVV were of little value in predicting fluid responsiveness in patients with SB activity, because of insufficient changes in pleural pressure, the effect of afterload caused by active expiratory movement, high respiratory rates, and variability in tidal volume [4,5]. To overcome these problems, all of our subjects underwent PB at a frequency of 0.25 Hz. PB forces the breathing frequency of subjects to converge to 0.25 Hz, and the RF power of SBP variability is augmented during PB [16,21]. Markedly irregular breathing patterns broaden the frequency of SBP variability, making it difficult to discern RF spectra. Thus, to assess the functionality of the autonomic nervous system, voluntary control of respiration at frequencies above 0.2 Hz has been used to standardize measurements in several investigations of autonomic cardiovascular regulation [22]. It has been demonstrated that PB can also concentrate and augment power spectra in the RF range, as well as permitting maintenance of constant frequency and depth of respiration during recording, without alteration of the autonomic nervous system [10,23]. Although subjects engaged in PB, time domain analysis of dynamic preload indices did not sensitively discriminate among intravascular volume changes, so such data cannot be used as indicators of volume responsiveness in patients with SB activity. Thus, our results demonstrate that data quantified for during the entire recorded period by determining the area under the power spectrum curve in the RF range are more reliable than is time-domain analysis, that gathers information from only three consecutive respiratory cycles.
Recently, alternative methods such as passive leg raising (PLR) and Valsalva maneuver (VM) were suggested to assess fluid responsiveness in patients with SB activity [24,25]. However, frequency domain analysis of preload indices under PB conditions also offers advantages over these methods. First, spectral analysis under PB conditions is relatively easy to perform, only requiring analysis software, and does not necessitate provocative methods. For example, the VM may require the active collaboration of the subject [24]. To achieve a reliable hemodynamic response, straining over 15 sec with a pressure of 30-40 mmHg is recommended, making this procedure difficult for patients with respiratory weaknesses. Moreover, the VM may affect afterload, contributing to respiratory changes in SV. Second, our frequency domain preload indices may provide alternative indices reflecting respiration-related heart-lung interactions under SB conditions. Although the PLR test has been found to predict fluid responsiveness in patients with SB activity [25], this test measures only transient changes in CO, indicative of preload, and does not yield a specific index reflecting respiration-related heart-lung interactions showing fluid responsiveness [26]. Finally, only 1-min recordings of hemodynamic variables are needed to obtain RF components for spectral analysis. Recordings of approximately 1 min have been deemed sufficient to assess the high-frequency (0.15-0.4 Hz) components in the spectrum of hemodynamic variables [27].
The limitations of our study should be discussed. First, LBNP differs from actual hypovolemia, and we administered a fluid bolus during LBNP. However, hemodynamic and autonomic responses induced by LBNP are proposed to be similar to those produced by actual blood loss [28]. Based on the linear relationship between either hemorrhage or LBNP and central venous pressure or SV, moderate LBNP, in the order of 10-20 mmHg, is equivalent to blood loss of 400-550 ml. LBNP of 40-60 mmHg thus corresponds to >1,000 ml blood loss [11]. Furthermore, LBNP has been proven to be a noninvasive, safe, and easily reversible procedure, usually applied in the supine position [29]. Second, CO and SV were not measured by the reference thermodilution technique, but were rather estimated using the Modelflow method. The latter has been shown to reliably monitor CO changes over a wide range of hemodynamic states and to precisely estimate the absolute value of CO after calibration [30]. We therefore expressed changes in SV and CO as percentage changes from baseline. Third, we designed the PB to augment power spectra in the RF range. The PB maneuver requires patient cooperation, participation, and quiet respiration. Such a PB maneuver may reproduce the dyspnea observed in critically ill patients with poor respiratory performance.
In conclusion, our findings suggest that RF spectral analysis of dynamic preload indices, such as SVVRF and SPVRF may provide feasible indices of intravascular volume changes, and that SVVRF may predict fluid responsiveness as a result of improving the estimation of heart-lung interaction, if PB is performed under SB conditions. Further investigations are needed to clarify the applicability of frequency-domain spectral analysis of dynamic preload indices in actual hypovolemic patients with SB activity.